
After completing this chapter, you will be able to
Understand the term “trusted data.”
Understand SQL Server 2008 R2 and its role in business intelligence (BI).
Understand the life cycle of a BI implementation.
Create a data warehouse.
Move data from a source to the data warehouse.
Create a SQL Server Analysis Services cube.
The major focus of this book is on how to use SharePoint Server 2010, integrated with SQL Server 2008 R2, to present data to business users. This would be pointless without data you can trust to present to your business user applications. Trusted data comes from business processes occurring in departments such as marketing, finance, e-commerce, and more, and is then transformed for use in decision-making. The transformation lets trusted data be delivered in formats and time frames that are appropriate to specific consumers of reports, spreadsheets, visualizations, and other data rendering tools.
Data that’s incomplete, out-of-date, or poorly documented can destroy users’ trust. Users who don’t have confidence in the data might refuse to use the reports and analyses created from this data. Instead, they might build their own data stores. The solution is a combination of following best practices for data collection, data profiling, and data integration, plus the application of guidelines from related disciplines, such as data quality, master data management, metadata management, and so on. The BI maturity model mentioned in Chapter 2, shows that making trusted data available across an organization doesn’t occur as a single event; it’s a process that occurs in stages.
Another way to look at trusted data is as data “approved for viewing.” The viewers are business users who range from front-line employees to executive management and external stakeholders. You can imagine the importance of having trusted data when everything rides on decisions being made at the corporate level.
The broad definition of BI described at the beginning of this book includes both the data warehouse and the tools used to view the data from the warehouse. This chapter explains what a data warehouse is, what online analytical processing (OLAP) is and how it relates to data warehousing, and finally, how Microsoft implements these technologies to deliver the right information and the right amount of information in the right form, fast.
Additionally, for most of the authoring tools, a cube is the ideal data source, because:
It’s not just that it’s structured data—it’s structured in a way that mirrors how the users already view their business, so it’s intuitive.
Cube data is faster to query, so questions can be asked and answered very quickly.
The data in a cube is interactive and more easily presented by using a variety of tools for reporting and analysis. While standard reports are frequently referenced, structured reports and analysis are interactive and can be generated for ad hoc exploration of data in search of answers.
When in place, a cube can help prevent long lines (waiting periods) for the IT department because it enables more self-service authoring.
The authoring tools support drag-and-drop elements for building reports, charts, graphs, and scorecards. The following illustration shows an example using Excel’s PivotTable Field List dialog box, which makes data available in a drag-and-drop format for building reports. The data is organized intuitively.

A lot of thought and work goes into warehousing data in such a way that it can be retrieved easily. This chapter provides a broad overview of the steps toward creating trusted data; you can find other resources that provide deeper coverage. Data warehousing and OLAP have developed over decades, and many people have written books about these subjects. Some of the more popular books come from Ralph Kimball and the Kimball Group, such as “The Data Warehouse Toolkit: The Complete Guide to Dimensional Modeling” and the “Data Warehouse ETL Toolkit: Practical Techniques for Extracting, Cleaning, Conforming, and Delivering Data,” both available at http://www.ralphkimball.com/html/books.html . A good resource for white papers about BI, managing BI projects, and more is the data warehouse institute (TDWI) ( http://tdwi.org/ ). And you can see why they’re a primary area of professional focus when you consider how so many companies struggle to harness mountains of data and then try to make that data useful.
This chapter also dives into what SQL Server 2008 R2 offers as the foundation for trusted data and why it is so important to SharePoint Server 2010 services that are dedicated to BI. PowerPivot for Excel and PowerPivot for SharePoint were developed by the SQL Server product team in large part because the client and back-end databases have a symbiotic relationship.
Additionally, this chapter provides examples of the end-to-end BI implementation life cycle.
Finally, at the end of this chapter, you can learn how to create your own cube by using SQL Server Analysis Services.
Before discussing the tools, it’s worth taking a look at the concepts that can help you get closer to having trusted data.
SQL Server has traditionally been a one-stop shop for customers seeking to implement BI solutions. Many companies still use SQL Server to move data from disparate sources in an extract, transform, and load (ETL) process, develop solutions to surface multidimensional data, and use products such as SQL Server Reporting Services to build reports from relational and multidimensional databases.
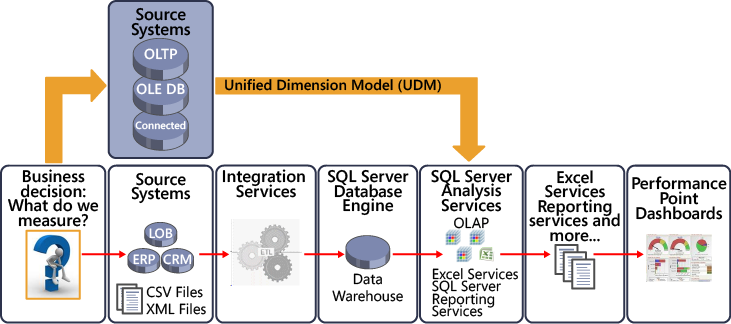
The following illustration, sectioned from a downloadable poster on TechNet at http://www.microsoft.com/downloads/details.aspx?familyid=FC97D587-FFA4-4B43-B77D-958F3F8A87B9&displaylang=en , shows how SQL Server 2008 R2, SharePoint 2010, and Office 2010 work together to deliver data that helps business users.
Note
Microsoft BI authoring tools are available in all three layers shown in the illustration. Some tools come from SQL Server, such as Report Builder; some, like PerformancePoint, are in SharePoint; and others are in Office, including Excel and Visio. See Chapter 2.
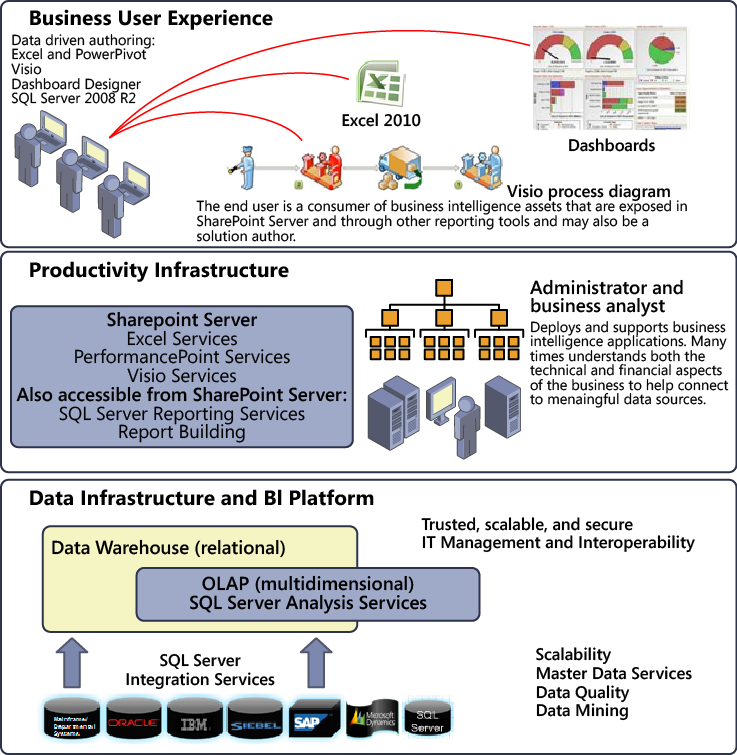
You can use SharePoint Server in conjunction with SQL Server Reporting Services and BI tools to show BI data in meaningful and productive ways. SQL Server provides the primary data infrastructure and BI platform that gives report authors and business users trusted, scalable, and secure data.
The following sections describe the technologies and features in SQL Server that support BI functionality and features.
Important
These tools are discussed at greater length in the section Life Cycle of a BI Implementation later in this chapter, to help you see where and how the tools fit in the context of the phases of an end-to-end scenario.
The important products in the Microsoft BI technology stack include Microsoft SQL Server Integration Services, Microsoft SQL Server Analysis Services, Microsoft SQL Server Reporting Services, and Microsoft Business Intelligence Development Studio. These products make up the core of the BI features in SQL Server and are important to understand if you want to understand Microsoft’s BI offerings.
This section describes each of the four core components that make up the SQL Server BI features.
The SQL Server database engine is the core service for storing, processing, and securing data; it serves as the engine for both the staging and the data warehouse databases. BI data is derived from databases managed by the SQL Server database engine.
Microsoft SQL Server Integration Services (SSIS) gives you data integration and data transformation solutions to help you get to trusted data faster. You can create repeatable data integration using the ETL process. This process can be automated, moving data from sources such as XML data files, flat files, or relational data sources to one or more destinations. Data from disparate sources must often be cleansed.
Features that make SSIS compelling for ETL solution building include:
A user interface that helps users move data and perform ETL.
Wizards for importing and exporting data and that help create a package that contains the business logic to handle data extraction, manipulation, and transformation. Workflow elements help process data.
Runtime debugging so that BI developers can step into code and watch the processes in a package. Reusable event handlers also help developers to create rich, repeatable ETL processes.
On another note, because this book is about SharePoint, it makes sense to mention that SharePoint is also a source and destination system from which to extract and load data. It is becoming increasingly more important to know how to move data from and to SharePoint as companies adopt SharePoint to store business data. Some data will be tied directly to another software product that has partnered with SharePoint for sharing.
We give an example of SSIS in action in the section Step 3: Create and Populate the Data Warehouse.
For more information, see “SQL Server Integration Services,” at http://go.microsoft.com/fwlink/?LinkId=199546 .
Microsoft SQL Server Analysis Services (SSAS) is designed to support ad-hoc reporting needs, and multidimensional data is the key to this. Using SSAS, formerly known as OLAP Services, you can design, create, navigate, and manage multidimensional structures that contain detail and aggregated data from multiple data sources. Learn more about multidimensional data in the section Step 4: Create an SSAS Cube from Warehouse Data.
SSAS uses wizards to simplify the cube development process. Dimensional data or cube data is a common data source for the types of analysis you can perform using Microsoft Office, SQL Server Reporting Services, PowerPivot, and BI-related service applications in SharePoint.
Multidimensional data helps users analyze data. For more information, see “SQL Server Analysis Services—Multidimensional Data,” at http://go.microsoft.com/fwlink/?LinkId=199541 .
SQL Server Analysis Services data mining tools provide a set of industry-standard data mining algorithms and other tools that help you discover trends and patterns in your data. Data mining complements what you do in SSAS by helping you discover surprises in data and often provides a glimpse of “what will happen.” This is sometimes referred to as predictive analysis. Also, SSAS helps you validate “what you think happened,” to support a belief that is based on historic data.
By looking at the following data mining case studies, available at ( http://www.microsoft.com/casestudies/ ), you can learn more about specific business problems that were solved using SSAS data mining. Here are some examples:
Illinois Department of Transportation . “The Illinois Department of Transportation Saves Lives with Microsoft Business Intelligence Solution” ( http://www.microsoft.com/casestudies/Case_Study_Detail.aspx?CaseStudyID=4000001842 )
The Banca Marche Group . “New Information System Increases Efficiency and Helps Double Profits at Italian Bank” ( http://www.microsoft.com/casestudies/Case_Study_Detail.aspx?CaseStudyID=201077 )
Zillow.com . “Database Products Help Real Estate Service Evaluate Millions of Homes Daily, Cut Costs” ( http://www.microsoft.com/casestudies/Case_Study_Detail.aspx?CaseStudyID=1000003853 )
The following Excel add-ins can help you perform predictive analysis:
Table Analysis Tools for Excel provide easy-to-use features that take advantage of Analysis Services Data Mining to perform powerful analytics on spreadsheet data. For more information, see “SQL Server Analysis Services—Data Mining,” at http://go.microsoft.com/fwlink/?LinkId=199543 .
Data Mining Client for Excel enables you to work through the full data mining model-development life cycle within Microsoft Office Excel 2007 and Excel 2010, using either worksheet data or external data available through Analysis Services.
Microsoft SQL Server Reporting Services (SSRS) and SharePoint 2010 are integrated include a full range of tools with which you can create, deploy, and manage reports for your organization. SSRS also has features you can use to extend and customize your reporting functionality.
The following illustration shows the Welcome page of the SSRS Report Wizard, which you can use to create an RDL file that can be stored in SharePoint integrated mode.
SSRS includes Report Builder 3.0, an authoring tool that you can launch directly from SharePoint Products 2010. You can publish report server content types to a SharePoint library and then view and manage those documents from a SharePoint site.
Why use SharePoint for managing SSRS reports? Stacia Misner in “SSRS 2008 R2 and SharePoint 2010”[4] says, “You’ll have only one security model to manage and, even better, business users will have only one environment in which to create, find, and share information, whether that information is in the form of reports, lists, documents, or other content types. Furthermore, you can manage reports using the same content management, workflow, and versioning features that you use for other SharePoint content.”
In a nutshell, SharePoint provides SSRS with similar or the same BI asset management benefits as other BI assets such as Excel Spreadsheets, Visio diagrams, PerformancePoint Dashboards, and more.
For more information about SSRS, see “SQL Server Reporting Services,” at http://go.microsoft.com/fwlink/?LinkId=199545 .
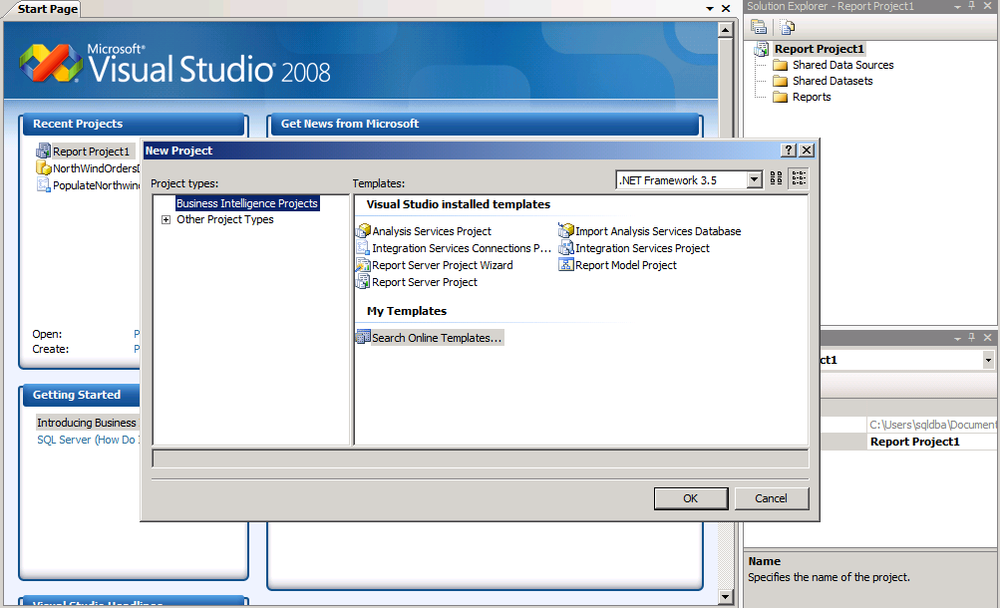
Microsoft Business Intelligence Development Studio (BIDS) provides several intuitive wizards for building integration, reporting, and analytic solutions within a unified environment. BIDS supports the complete development life cycle for developing, testing, and deploying solutions. The BIDS development environment uses a Visual Studio shell and includes project templates that make it easy to design solutions for ETL processes, cubes, and reports. The following illustration shows the projects from templates that you can create in BIDS.

The following sections briefly describe other SQL Server 2008 R2 features that can help you develop more comprehensive BI solutions.
PowerPivot is an add-in for Excel that enables users to create self-service BI solutions. It also facilitates sharing and collaboration on those solutions by using the SharePoint Server 2010 environment. The major components of PowerPivot are as follows:
PowerPivot for Excel 2010 is a data analysis add-in that delivers computational power directly to Microsoft Excel 2010. PowerPivot for Excel enables users to analyze large quantities of data and integrates with SharePoint Server to help IT departments monitor and manage collaboration. The add-in extends Excel so that it can work with data exceeding one million rows, including external data. PowerPivot includes the Vertipaq engine, which provides rapid calculations over large data sets. For more information, see Chapter 5.
PowerPivot for SharePoint 2010 extends SharePoint Server and Excel Services to add server-side processing, collaboration, and document management support for the PowerPivot workbooks that publish to SharePoint sites. For more information, see “PowerPivot for SharePoint,” at http://go.microsoft.com/fwlink/?LinkId=199547.
Important
While SSAS is an OLAP engine available for IT professionals to build sophisticated, high-performance solutions to deploy across the organization, PowerPivot for Excel is intended for information workers who build BI solutions for their own use rather than for use across the entire organization.
Users can publish their PowerPivot files to SharePoint Server or SharePoint Foundation for use by a team. To learn more about the differences, see the PowerPivot Team Blog post “Comparing Analysis Services and PowerPivot,” at http://go.microsoft.com/fwlink/?LinkId=192047 .
You can use SQL Server Master Data Services (MDS) to centrally manage important data assets company-wide and across diverse systems to provide more trusted data to your BI applications. MDS helps you create a master data hub that includes a thin-client data management application. This application is used by a data steward who ensures compliance with rules established as part of a company’s data governance initiative. This application can significantly reduce the need to perform ETL because data is being managed with foresight. BI developers can spend less time extracting data from disparate sources and more useful time collecting accurate data from MDS, the “single source of the truth.” The benefits also include improving report consistency and a more trusted source. Aligning data across systems can become a reality.
MDS can also apply workflow to assigned owners, apply extensible business rules to safeguard data quality, and support the management of hierarchies and attributes. For more information, see “Master Data Services,” at http://go.microsoft.com/fwlink/?LinkId=199548 .
Microsoft StreamInsight is a new feature in SQL Server 2008 R2 that helps you monitor data from multiple sources and that can detect patterns, trends, and exceptions almost instantly. StreamInsight also lets you analyze data without first storing it. The ability to monitor, analyze, and act on high-volume data in motion provides opportunities to make informed business decisions more rapidly. For more information, see “Microsoft StreamInsight,” at http://go.microsoft.com/fwlink/?LinkId=199549 .
The best way to explain BI concepts is within the context of a BI implementation life cycle. The diagrams in this section give you a 50,000-foot view of the life cycle of a BI implementation, from determining KPIs to actually surfacing data and monitoring those KPIs in a dashboard. The example in this section is not indicative of the reality that companies face; it’s intended only as an illustration of the end-to-end process. However, for the purpose of learning about the major components of an implementation, which include subcomponents for each phase, this example is useful. After the end-to-end example, you can work through a quick hands-on lab to practice creating a cube from a very small data warehouse.
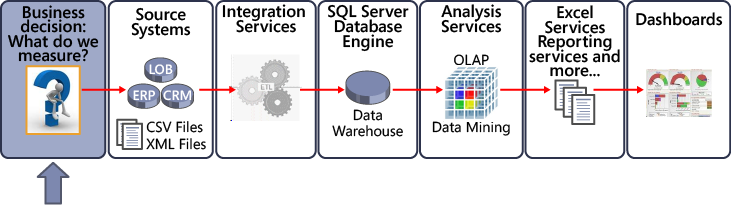
Suppose your company decides it wants to answer questions by using data it has collected from transactional systems. Or perhaps your company wants to improve its forecasting process by collecting the right information, by having more reporting flexibility, or by giving more people access to information. The required steps for these BI initiatives can go wrong in several places. You need to get to what your customer wants, and you want to be effective so that you build the solution the organization needs.
Determining what to do with the data might be the most important—and often the most difficult—step. It’s important because you do not want to spend resources collecting data that is not useful. Savvy developers and solution designers must work with users to determine their data requirements in an efficient, iterative manner.
The easier a designer makes it for users to quickly understand the results of a BI solution, the closer a designer can come to delivering a useful solution. For this reason, one of the tools, the SQL Server Business Intelligence Developer Studio (BIDS) browser, enables developers to see the results of data collection and queries, and it is nearly identical to the viewer in Excel. Both tools provide great support for prototyping and scope checking.
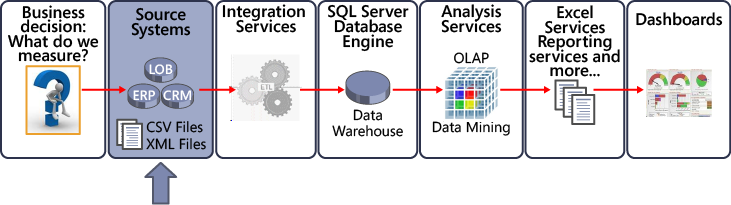
After you know what you want to measure, you must determine where the data will come from and plan how to collect it. The preceding illustration shows data from Line-of-Business (LOB) systems, Enterprise Resource Planning (ERP) systems, Customer Relationship Management (CRM) systems, and flat files, such as CSV and XML files. Other sources, such as Excel files and data from online transaction processing (OLTP) systems, are also common and are valuable as raw data sources that can be cleaned and prepared for BI solutions.
An OLTP system can be defined as a relational store that is designed and optimized for computer-based transactions. Transaction processing is information processing, one transaction at a time. For example, when an item is purchased at a store, the store records that purchase as a single transaction in a computer system that uses an OLTP database. An OLTP system records business transactions as they happen and supports day-to-day operations in an organization. Transactional data is the raw data that the business can use as the basis for fact data and, later, to calculate measures (in cubes), as discussed in the next section.
As you can see, it’s common to draw from multiple data sources to deliver a useful BI solution. It’s also common to gather data from multiple OLTP systems. Because of the variety of sources, the data very likely contains a variety of different formats for dates, product and category names, and other data. Inconsistent data types used for the same data, different time periods, and other problems require you to consolidate and cleanse the data.
Before cleansing data, your primary goal is to determine where the data is to extract, clean, and conform. Because the ETL process can be the most resource heavy, it’s also vital that you understand exactly what the users require before you begin. Best practices for understanding user requirements often include a prototyping and iterative back-and-forth discussion among analysts, report users, and developers. It is particularly important to validate that you’re collecting the right amount of information at the right time, in the right format, and with the most helpful visualizations.
Far too often, a company starting a BI initiative wants to integrate the enterprise’s data right now, so they’re reluctant to take the time to design an extensible and universal solution—but not doing so increases the likelihood of unusable solutions that lead to future rework. It is well worth your time to review the methodologies and literature around BI project management solutions in other books and articles.
You deliver the cleaned source data into a dimensional data store that implements querying and analysis capabilities for the purpose of decision-making. There are excellent books and articles on best practices for ETL data. Ralph Kimball is a pioneer for data warehousing and has published much of the original content for ETL and other data warehousing best practices. You can find his books and articles at http://www.ralphkimball.com . Other sources include The Data Warehouse Institute (TDWI), at ( http://tdwi.org ), which is an educational institution for BI and data warehousing. In addition, the “Information Management” site, at http://www.information-management.com/ , provides news, commentary, and feature content serving the information technology and business community.
As the following illustration shows, Step 3 occurs in two phases. First you must design and create a data warehouse in SQL Server. (A number of books have been written on best practices for creating a data warehouse.)
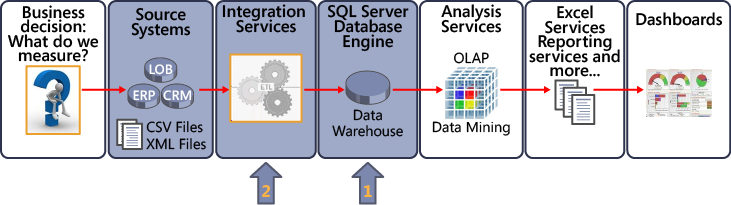
What is not shown in the preceding diagram is a staging database. A staging database is an intermediate storage location used for organizing, cleansing, and transforming data to prepare it for a data warehouse. A staging database helps minimize the impact on the source systems during the ETL process. Basically, you want to get in and out of the data warehouse quickly. If you put everything into a staging database, and then if a transformation step fails, you can restart with the data in staging instead of having to go back and touch (impact) the source systems again. The staging database sits between the various sources and the data warehouse.
After creating a data mart or data warehouse, you can use stored procedures or SSIS to create a repeatable ETL process for getting various sources of data into your data warehouse databases. SSIS is a rich tool that performs useful operations, such as making the data conform to specifications so that you can use it in applications, to create cubes, or to connect directly to it from reports.
Let’s look at some of the components of a data warehouse.
A data warehouse is a database that functions as a repository for storing an organization’s data for reporting and analysis. The core data in the data warehouse typically consists of numeric values that you can aggregate in a number of ways. The data is usually stored in a structure called a “star schema” rather than in a more normalized structure found in typical transactional databases. Querying data can be very resource-intensive, so the data warehouse structure provides much better querying times. Ad hoc queries return summed values, similar to queries you would perform in a transactional database to create a report.
A data warehouse usually contains data from multiple sources and covers multiple subject areas. In contrast, a data mart is subject-specific and contains a subset of data applicable to a specific department or segment of an organization. A data warehouse can contain one or more data marts.
When you work with data warehouses, you quickly learn that the entire discussion centers on facts and dimensions. Data warehousing is about storing the data that people can use to solve business problems—and you determine what data to store by asking questions like “What number needs to be viewed, and in what manner does the number need to be analyzed?”
The what part is typically a number such as the number of products produced, the defect rate, the manufacturing cost, and so forth. These numbers are called fact data. The values stored in a data warehouse (or data mart) consist primarily of fact data.
After identifying the what, you must determine how users should see the fact data. How the user will analyze the fact data becomes the dimension. The most common dimension is time, which gives context to the facts that are stored. For example, users might want to see trends in manufacturing costs over time, or they might want to see sales volume over time.
A data warehouse has a different structure than a transactional database. The primary reason for the structure change is to improve the speed of querying the data. The following illustration shows a scaled-down version of a star schema. It also illustrates how fact data and dimensions are made available—from which you would choose report elements to create a report. A report is a subset of the data in the relational database, but as you can see, multiple scenarios are available, and the report you want to create is dictated by the data within the facts and dimensions. The schema in the illustration shows only one fact and only a handful of dimensions, but in real-world situations, a schema may hold more facts and many, many more dimensions.

The information shown in the report at the bottom of the preceding illustration could be a prototype for a customer to communicate requirements to a business user. The report communicates one variation of two facts, Quantity and Dollar Sales. The Date column shows how the two facts are aggregated, in addition to the context provided by the dimensions.
SSIS is a tool that SQL BI developers use to move data from various sources to the data warehouse. The next section, From Data Warehouse to Report, Using SSIS, provides an example of how to make a copy of some data and then move it from the original data warehouse to a subset data warehouse.
Other BI developers might prefer to clean and load data to the data warehouse by using T-SQL and stored procedures, but SSIS provides a useful alternative to T-SQL and stored procedures because it can support repeatable ETL processes.
This phase can be the most expensive part of your BI solution because it’s typically the most time-consuming part of the project. You can expect a lot of surprises in the data—such as missing or invalid values—and cleaning it is typically a very iterative process during which misunderstandings get ironed out and data quality issues are resolved. The cost of ETL for any BI solution is also affected by other variables, too many to list them all here, but that include issues such as the following:
How well the project is sponsored, starting from the very top (CIO, CEO, and so on).
The size of the project and business unit. The solution could reach the organization, department, team, and a group of individuals, each of which vary in size.
The culture and dynamics of the organization, department, and team and how well they are able to communicate requirements and how well the prototypes are presented. Typically ETL is an iterative process—and even after that, misunderstandings often lead to changes. A good change-management system helps control the scope of the project and, ultimately, the time and money spent.
The preceding is not an all-inclusive list of variables or considerations. You can find several good books that discuss project methodologies, such as agile BI data warehousing, as well as books explaining how to use SSIS for more than just creating a repeatable ETL solution.
A great example example of SSIS being used with the Contoso data warehouse is given by Valentino Vranken in his blog post “Calculating LastXMonths Aggregations Using T-SQL and SSIS.” You can download this sample SSIS package from http://blog.hoegaerden.be/category/sqlserver/t-sql/ . Vranken’s post shows how you use the Merge Join data transformation in SSIS and Common Table Expressions in T-SQL to calculate aggregations over a specified period of time. The sample also provides a good example of when you don’t necessarily need to spend the time to create a cube.
The scenario begins with a database, the Contoso data warehouse, which contains some sales figures. Management asks for sales-related data to be made available somewhere for easy analysis. Ideally, you’d build a cube, but because budgets are currently tight, a less work-intensive temporary solution is appropriate, consisting of an additional table that will be created and populated with the data that management requires. The new table must contain details (number of items and amount of the sale) about products sold, grouped by the date of the sale, the postal code of the location where the sale occurred, and the product category.
Furthermore, each record must contain the sum of all sales of the last month for the postal code and the product category of each particular record. Two additional aggregations should calculate the sales for the last three months and for the last six months, respectively.
The following illustration shows the SSIS Data Flow tab.

When you double-click the OLE DB Source data flow task called OLE_SRC Daily Sales, you see the source code in the SQL command text of the Ole DB Source Editor dialog box. Each flow task performs an activity that you control. When you run the package, you can see the progress of each flow task. All of this occurs in development, because packages typically run as scheduled unattended processes.
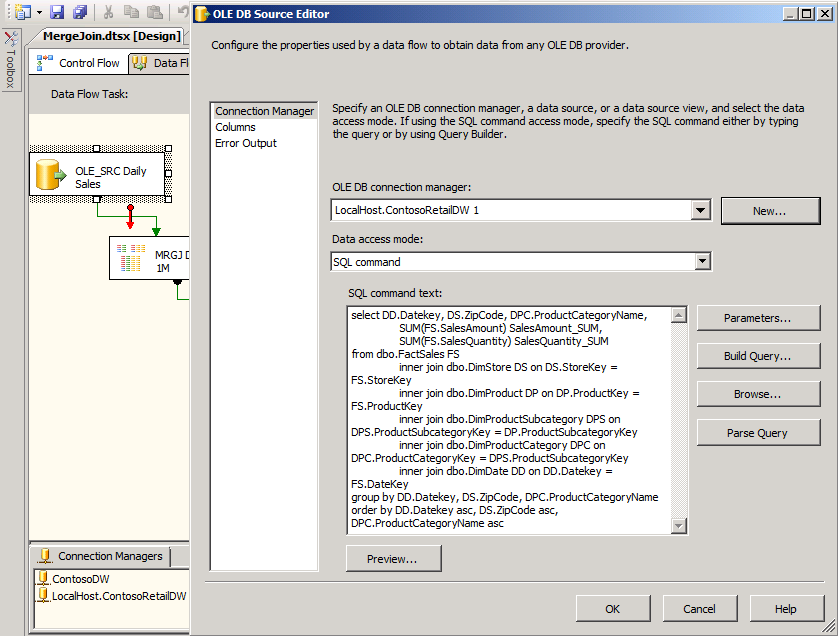
The preceding example provides only a glimpse of what you can do with SSIS to extract, transform, and load data.
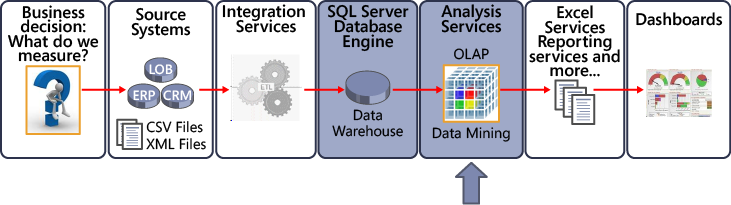
This section explains the concepts involved in creating a cube, followed up with a hands-on practice exercise to create your own cube. The following illustration shows where cube creation fits into the overall BI life cycle.
OLAP stands for On Line Analytical Processing, a series of protocols used mainly for business reporting. Using OLAP, businesses can analyze data in a number of different ways, including budgeting, planning, simulation, data warehouse reporting, and trend analysis. A main component of OLAP is its ability to make multidimensional calculations, which means it supports a wide and lightning-fast array of possibilities. In addition, the bigger the business, the bigger its business reporting needs. Multidimensional calculations enable a large business to complete calculations in seconds that would otherwise take minutes to obtain.
OLAP is a technology that stores detail and aggregate data in a multidimensional structure that supports fast queries and on-the-fly calculations. A general way to understand what OLAP does is to see it as part of a specialized tool that helps makes warehouse data easily available.
In the section Core BI Components, we provide a brief description of what SSAS is. Here we reiterate why it is important. SSAS provides server technologies that help speed up query and reporting processing. Aggregations can be preprocessed to make querying very, very fast. Analysis Services implements OLAP technology to simplify the process of designing, creating, maintaining, and querying aggregate tables while avoiding data explosion issues.
SSAS allows BI developers to:
Create KPIs that can later be used in authoring tools such as PerformancePoint Dashboard Designer.
Create perspectives, which are subsets of data from a cube. Sometimes developers compare perspectives to database views. Perspectives allow BI developers to reduce the amount of data made available so that departments, such as an accounting department, have the data they need.
Apply cell-level security that affects what data can be used in Office applications such as Excel, SSRS, and PerformancePoint Services.
Use Multidimensional Expressions (MDX) to query cubes.
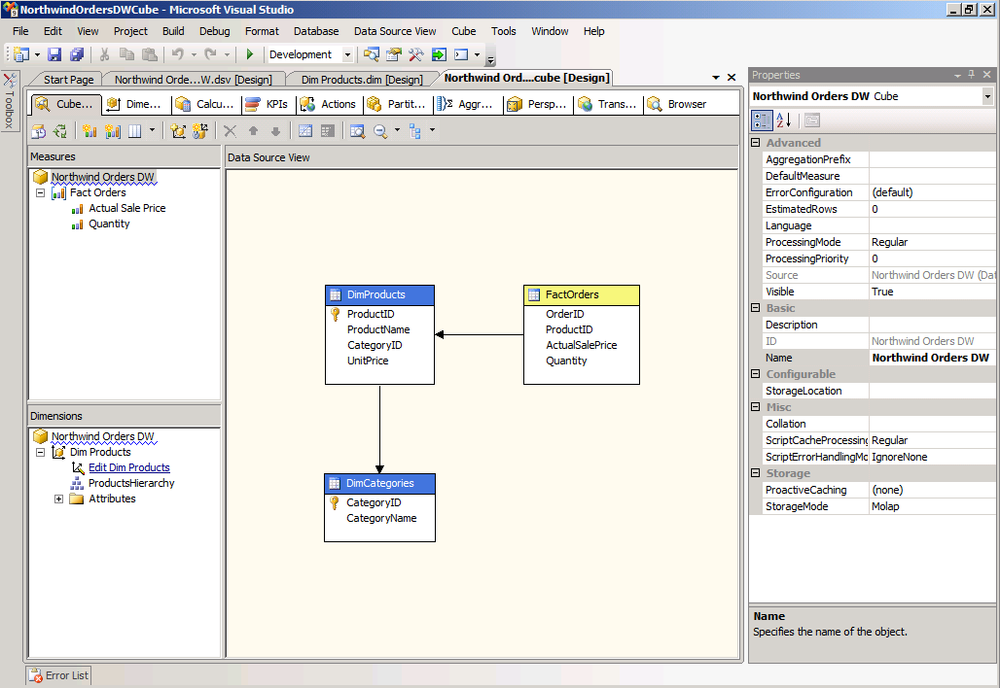
The following illustration shows the NorthWindOrdersDW project using SSAS. We hope the illustration gives you a sense of how rich the tool is for designing cubes.
An OLAP cube is a logical structure that defines the metadata of its underlying data warehouse data. The cube provides multidimensional data derived from relational tables or a data warehouse, and it’s optimized for rapid querying. In other words, the term cube describes existing measure groups and dimension tables. The “Understanding the OLAP Environment, Basic Terminology” video, at http://www.microsoft.com/business/performancepoint/productinfo/proclarity/training/WEB50P-1/OLAP_Terminology/OLAP_Terminology.html , can help you understand OLAP terminology.
Querying a cube is significantly faster than querying the source data directly, but remember that to get these performance gains you must store significantly more data.
Business logic can be encapsulated in the cube so that there is only one way to perform a calculation, to prevent a myriad of versions from user-calculated values.
In short, OLAP cubes contain lots of metadata; metadata, in its simplest definition, is data about data. MDX is a metadata-based query language that helps you query OLAP cubes.
You can build MDX calculations, such as sales of a previous week, with great efficiency. This task would otherwise be very difficult to do in a relational language and could include hundreds of lines code to accomplish. In MDX, you would need only one line of code!
As shown in the following illustration, the Unified Dimension Model (UDM) defines business entities, business logic, calculations, and metrics and provides a bridge between BI developers and data sources. BI developers can run queries directly against the UDM by using BI tools. To use the UDM, you must have an OLE DB or SQL Server connection.
In reality, you can create cubes on OLTP (or relational and normalized data) or almost any other data source, in any format to which you can connect, through SSAS data source providers. This flexibility is both good and bad. If you’re new to creating OLAP cubes, you’ll want to build projects using the wizards and tools in BIDS. These wizards save you time and are designed to work with traditional star schema source data as depicted in the following diagram.

With prepared data ready, you can work on how you want to present the data. (Note that the sequence of events leading up to this point, as presented in this chapter, do not always happen in this exact sequence.) The authoring tools let you connect to data that does not come from a data warehouse or cube but rather directly from SharePoint lists, Excel files, CSV files, OLTP databases, and other sources. In particular, PerformancePoint Services can include data produced in the other BI authoring tools, which enables you to create a dashboard and a mash-up of work performed by other analysts, developers, and business users.
In the following section, to more fully understand the data preparation process, you can walk through an exercise to create your own cube.
The lab exercise in this section ties together the information provided earlier in this chapter. You can use this exercise to learn more about the conceptual, physical, and logical models being used—from creating the data warehouse to creating a cube for reporting.
The purpose of this lab is to show how data warehousing and multidimensional concepts are easier to understand when you perform the tasks with a very simplified dataset. Of course, the complexities multiply when you have much larger data sources and real-world data; typically, you would use multiple data sources from disparate systems, or you might find that the data sources for what you want to measure don’t even exist in electronic format. There are other complications as well.
The goals for this hands-on lab are as follows:
Determine the reports that the data warehouse is supposed to support.
Identify data sources.
Extract data from their transactional sources.
Build and populate a dimensional database.
Build and populate Analysis Services cubes.
Build reports and analytical views by:
Using Excel, PerformancePoint, SSRS, PowerPivot, or Visio.
Creating a custom analytical application and writing MDX queries against cubes.
Maintain the data warehouse by adding or changing supported features and reports.
This exercise uses the Northwind database, available at the Northwind Community Edition, located at http://northwindcommunity.codeplex.com/SourceControl/list/changesets . You might ask, why use Northwind? The answer: because it is easy to use, takes two seconds to install, and is small and simple enough to use for getting-started demos. The Northwind database contains good sample data, so it’s an excellent place to show you how to create a data warehouse.
Suppose you work for the Northwind Traders Company. This hypothetical company sells products around the world and records data into the sample database created when you installed the Northwind database. Business owners want views that let them break down the order details by product, product category, quantity, and price. Having such a tool can help stakeholders get quick views of which products are selling.
More typically, a BI solution specialist would extract that information from business users through an iterative process. Business users might not know what they really want until after some interviews and after evaluating several prototypes. For the purposes of this exercise, assume that management has predetermined exactly what they want to see in a report.
This example is simplistic and therefore considerably easier to build than a typical warehouse. Baya Dewald, in his article “Case Study of Building a Data Warehouse with Analysis Services (Part One),” at http://www.informit.com/articles/article.aspx?p=443594 , describes some of the challenging aspects of creating a data warehouse as follows:
“Because data is already in a SQL Server database that has a fairly simple structure, the first few steps of a typical warehouse project are already done for us. In reality, you don’t always get this lucky: The DW architect usually has to identify multiple data sources that will be used to populate the warehouse. The organization’s data could be stored in various relational database management systems (Oracle, SQL Server, DB2, and MS Access being the most common), spreadsheets, email systems, and even in paper format. Once you identify all data sources, you need to create data extraction routines to transfer data from its source to a SQL Server database. Furthermore, depending on sources you’re working with, you might not be able to manipulate the data until it is in SQL Server format.
The Northwind database has intuitive object names; for example, the orders table tracks customer orders, employees table for records data about employees, and order details table tracking details of each order. Again, in the real world this might not be the case—you might have to figure out what cryptic object names mean and exactly which data elements you’re after. The DW architect often needs to create a list of data mappings and clean the data as it is loaded into the warehouse. For example, customer names might not always be stored in the same format in various data sources. The Oracle database might record a product name as “Sleeveless Tee for Men,” whereas in Access you could have the same product referred to as “Men’s T-Shirt (sleeveless).” Similarly, the field used to record product names could be called “product” in one source, “product_name,” in another and “pdct” in the other.
Once you have determined which data you need, you can create and populate a staging database and then the dimensional data model. Depending on the project, you may or might not have to have a staging database. If you have multiple data sources and you need to correlate data from these sources prior to populating a dimensional data structure, then having a staging database is convenient. Furthermore, staging database will be a handy tool for testing. You can compare a number of records in the original data source with the number of records in the staging tables to ensure that your ETL routines work correctly. Northwind database already has all data I need in easily accessible format; therefore, I won’t create a staging database.”
The Northwind database is what is generally termed an “OLTP data store.” Remember that OLTP databases are structured so that they are capable of storing data quickly—but not optimally structured to retrieve data quickly. Therefore, you want to create a data warehouse from the Northwind OLTP database that you can use to query data for the report.
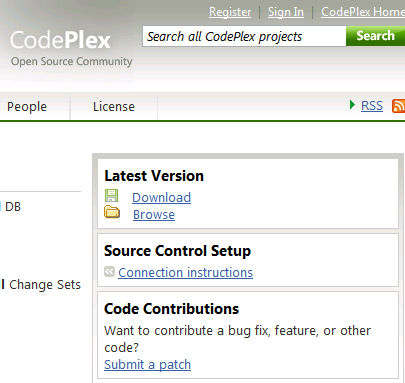
Go to the Northwind Community Edition, located at http://northwindcommunity.codeplex.com/SourceControl/list/changesets , on the CodePlex site hosted by Microsoft. CodePlex is a web storage site maintained as a service to the developer community.
Click the Download link.
Save the downloaded file to a computer that has SQL Server 2008 R2 installed.
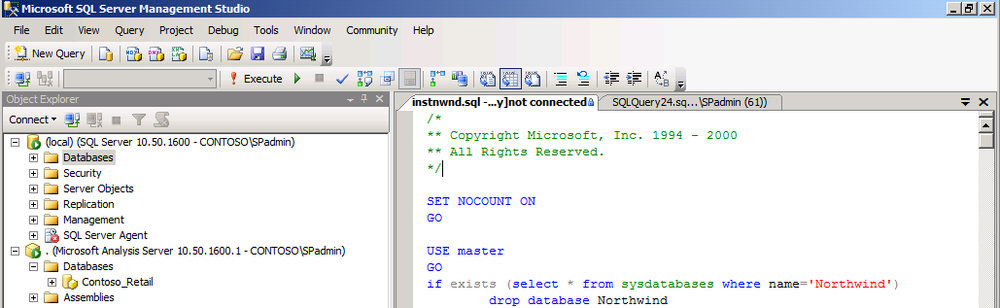
In the folder where you saved the file, double-click the instnwnd.sql file, which opens the script for creating Northwind database in SQL Server Management Studio. You must have permissions to run the script that creates the database.
Click Execute.
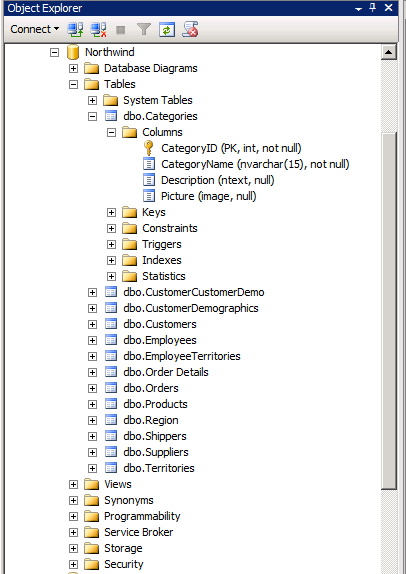
In the Object Explorer window, shown in the following illustration, navigate the database to view the tables and columns to ensure everything worked.
People have been creating data warehouses for more than twenty years now, so you can find numerous books and best practices that describe how to improve the return-on-investment (ROI) for your data warehouse. The article “Best Practices for Data Warehousing with SQL Server 2008,” at http://msdn.microsoft.com/en-us/library/cc719165.aspx , is a good place to start.
For this exercise, there really isn’t much complexity to the design. In fact, it is worth noting that this example doesn’t include a dimension for time, which is the most common dimension. The design for this exercise comes from the following illustration, which is a simplified snowflake schema. A snowflake schema relates to the dimension structure itself—the dimension is in multiple tables. There is still an overall star schema in that you have a fact and dimension structure, which is the core construct. The snowflake is considered a structure that extends dimensions, such as the product dimension.
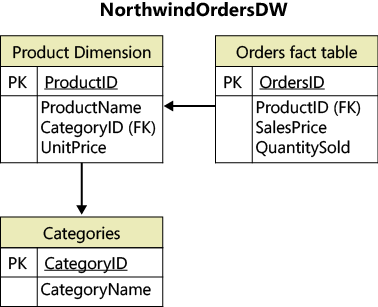
In this section, you will accomplish the following tasks:
Design the data warehouse (already done)
Create the fact and dimension tables for the data warehouse
Populate the fact and dimension tables
Set relationships between the tables
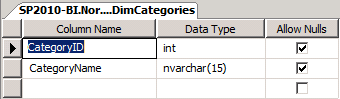
Expand the Databases folder, and then expand the NorthwindOrdersDW database folder. Right-click the Tables folder, and select New Table from the context menu. A Table Designer tab appears, as shown in the illustrations under Steps 2 and 4 of this exercise.
In your new table, populate the Column Name and Data Type columns with the information displayed in the following table.
Save your new table with the name DimProducts.
Note
To demonstrate the flexibility of SQL Server Analysis Services to create relationships defined in the snowflake design shown in the preceding section, you do not set those relationships in the NorthwindOrdersDW database. In other words, this is not a good database design. Typically, you’d define relationships in the data warehouse, which makes creating the cube much easier.
Repeat Steps 1–3, populating the Column Name and Data Type values as shown in the following tables. For our purposes, you can select all check boxes in the Allow Nulls column.
Save these two tables as FactOrders and DimCategories.


You have just created your fact and dimension tables! After right-clicking the NorthwindOrdersDW database and selecting Refresh, you can expand the columns. You should see the three new tables, as shown in the following illustration.

Your three-table data warehouse is now in place and ready to populate with data from the Northwind database.
You can choose from several methods for populating data, some more complex than others. In the following exercise, because the source data is already clean, you don’t have to deal with the complexity of cleansing the data before populating the data warehouse. This data comes from a single source (SQL Server Northwind database), the tables and columns are intuitively named, the data is clean, and you don’t need to put data into a staging database first.
You can use two very simple methods to populate data in this example:
SQL Server Import And Export Wizard . Takes data from Northwind and inserts it into the NorthwindOrdersDW DimProducts and HierarchyCategories tables.
An INSERT SQL statement . Takes data from Northwind, aggregates it, and inserts it into the NorthwindOrdersDW FactOrders table.
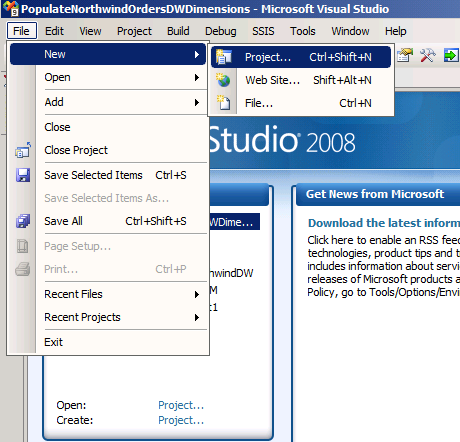
Open BIDS and create a new project, as shown in the following illustration.
Select the Integration Services Project type, and type PopulateNorthwindOrdersDWDimensions for the project name.
From the PopulateNorthwindOrdersDWDimensions menu, select Project | SSIS Import And Export Wizard, as shown in the following illustration.
This starts a wizard where you can select your source and destination databases, tables, and columns.
On the wizard’s starting page, click Next.
On the Choose A Data Source page, select Microsoft OLE DB for SQL Provider Server Data source, type (local) in the Server Name field (assuming your database is on your machine; otherwise, select the appropriate server), and select Northwind for the Database. Click Next.
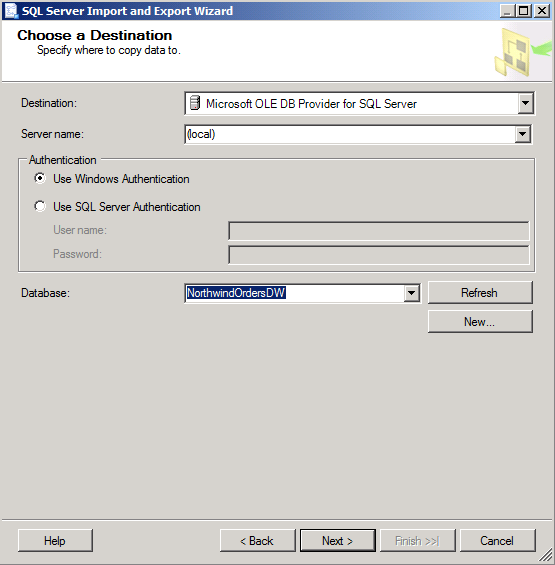
On the Choose A Destination page, select Microsoft OLE DB Provider For SQL Server, type (local) in the Server Name field (assuming your database is on your machine, otherwise, select the appropriate server), and select NorthwindOrdersDW for the Database. Click Next.
Make sure the option Copy Data From One Or More Tables Or Views is selected. Click Next.
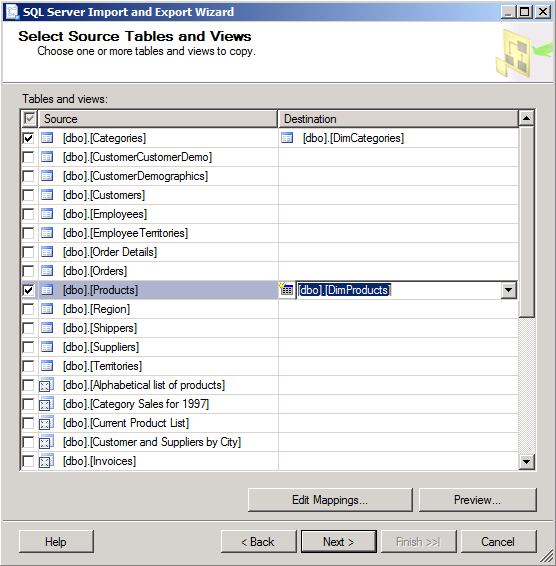
All the tables in the Northwind database are available for selection, as shown in the following illustration. Select Categories, and in the drop-down list in the Destination column next to Categories, select [dbo].[HierarchyCategories] as the destination table. Click Next.
Select Products, and in the drop-down list in the Destination column next to Products, select [dbo].[DimProducts] as the destination table.
Click Edit Mappings.
Notice that you can edit mappings between source and destination tables. The wizard automatically maps to the columns in the destination table that have the same names as those in the source table. Additionally, the wizard detects that the destination table is only a subset of the source table. It therefore sets <Ignore> on the unused columns, as shown in the following illustration so that those columns are not copied.
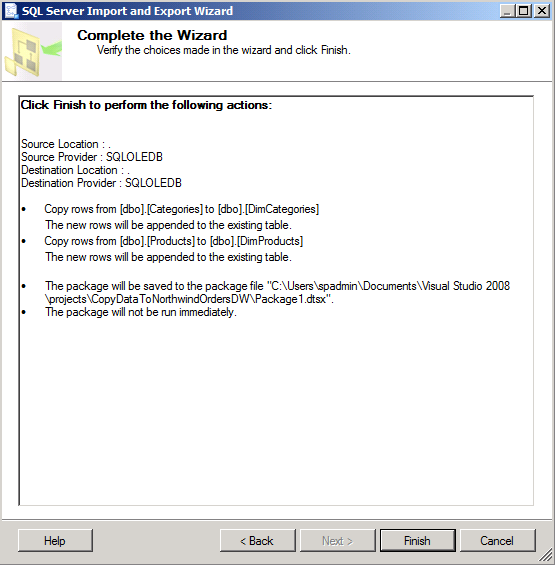
Click Next to see a summary of the SSIS project.
Click Finish for the project to validate the operations.
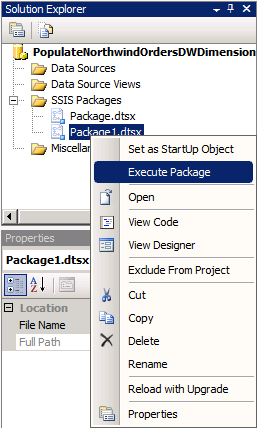
Click Close. The wizard closes, and you are taken back to the BIDS project. Right-click the package you just created with the SSIS Import And Export Wizard, and select Execute Package, as shown in the following illustration.
When you execute the package, you can view the progress of the tables moving by clicking the Progress tab.
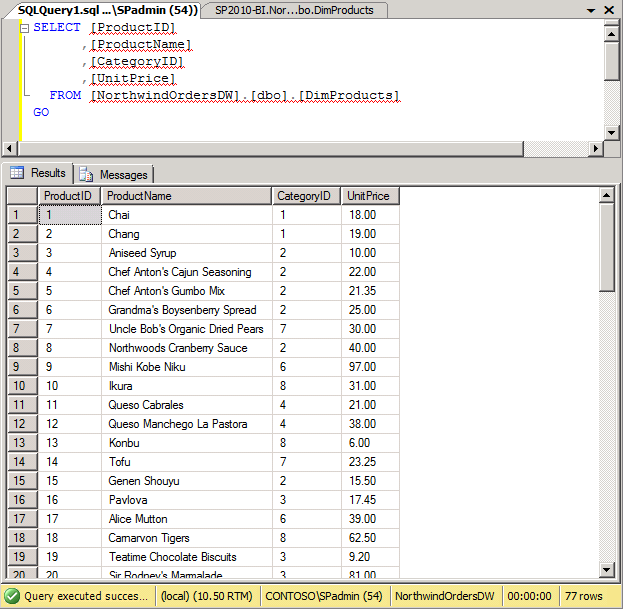
When the package completes, query your dimension tables in SQL Server Management Studio to ensure that they were populated with data. To do this, right-click the table and select Script Table As | Select To | New Query Editor Window. Then select Execute.
After executing the query, you should see the data in the results table, as shown in the following illustration.


You’ve populated the two dimension tables. Next you’ll populate the FactOrders table.
Type the following INSERT statement in a new Management Studio query window:
INSERT FactOrders (
OrderID
, ProductID
, ActualSalePrice
, Quantity
)
SELECT [OrderID]
, ProductID = max(ProductID)
, ActualPrice = Sum(UnitPrice)
, Count = sum(Quantity)
FROM [Northwind].[dbo].[Order Details]
GROUP BY
[OrderID]
HAVING MAX(ProductID) <1000
ORDER BY [OrderID]
GO
Make sure you are in the NorthwindOrdersDW database, and select Execute.
830 rows should be affected, as indicated in the Messages pane and as shown in the following illustration.
To ensure that the FactOrders table was populated, run the query shown in the following illustration.
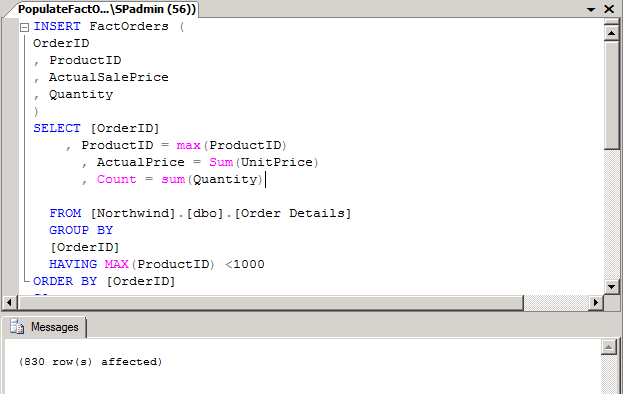

You should notice that the INSERT statement used a GROUP BY clause that aggregates data. In this example scenario, you need to see only product sales and quantity by order, and you don’t care about multiples of the same product on the same order. That level of detail is not necessary, thus the aggregation.
This is the exciting part. If your source data is in good format, the cube wizard for Analysis Services makes the process of creating a cube relatively simple.
Note
Before moving on, it’s worth explaining why we are creating a cube and not simply building a report from the data warehouse we built. It’s true that for this simple example, we could have built reports by querying either the transactional database or the data warehouse directly. Some companies do report off their transactional databases; depending on the situation, that might strain resources. But when transactions and queries across a more complex database structure compete for resources, IT departments might limit analytical queries to times when the transactional databases are not in heavy use.
Even with a data warehouse in place, complex queries to relational tables for reports might take all night or even all weekend to complete. For this reason, a company usually looks first at creating data warehouses or data marts and/or OLAP cubes. Another reason to build cubes is to limit information aggregation to one or more cubes.
Following is a summary of the process using Analysis Services wizards to build a cube based on the data warehouse you created in the previous exercise:
Create a data source, pointing to the physical data warehouse.
Create a Data Source View, which is a copy of the data in the data warehouse.
Create the product dimension and associate it with Categories as a hierarchy.
Create the cube.
Build the project.
Deploy the cube so that the cube database shows in Analysis Services.
Process the cube to populate it with data.
Randal Root, a technical consultant and author of BI Solutions with SQL Server 2011 (Apress), created a video that shows you how to create a cube built on the data warehouse you just created. You can view the video at https://docs.google.com/leaf?id=0B5U6tT4eiM6aNzQyNTg1YmUtMDRiMi00YTE1LTkxNzUtZTAwMzM1YjlkYTQ1&hl=en&authkey=CIOnzo8N .
Important
Notice a difference between the cube I built for this example and the video: I created relationships in the Data Source View rather than in the NorthwindOrdersDW data warehouse. You’ll build those relationships in the next exercise.
When you’re done creating a cube, you can use the browser to navigate through your data or use it to negotiate requirements with business users as if it were a prototype report.

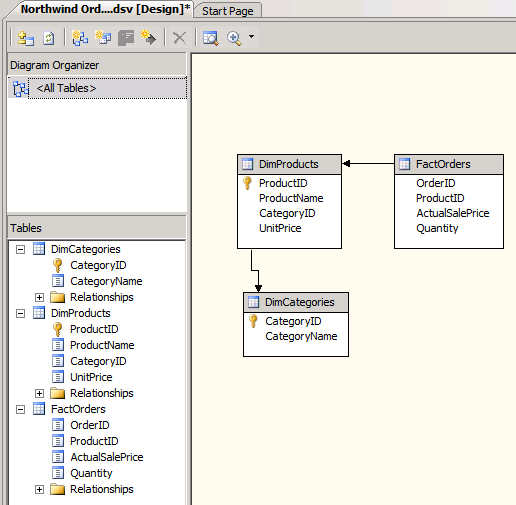
After running the wizard to create the data source and Data Source View, right-click the Relationships folder to see the FactOrders table, as shown in the following illustration.
In the Specify Relationship dialog box, make sure FactOrders appears in the Source (Foreign Key) Table field and that DimProducts appears in the Destination (Primary Key) Table field. Select ProductID under both Source Columns and Destination Columns, and then click OK to see a line between the FactOrders table and DimProducts table, as shown in the following illustration.
Right-click the Relationships folder under DimProducts.
In the Specify Relationship dialog box, make sure DimProducts appears in the Source (Foreign Key) Table field and that DimCategories appears in the Destination (Primary Key) Table field. Select CategoryID for under both Source Columns and Destination Columns. Click Ok.


You should now see the relationships shown in the following illustration. Typically, these relationships are defined in the data warehouse, but we wanted to show how you can enhance the Data Source View. Data source views are conceptually similar to relational views because they represent a view of the data from data sources in a project.
This chapter provides an overview of the major steps involved in getting to trusted data by using SQL Server 2008 R2. Keep in mind that ensuring data quality throughout an organization or even in a department is a process rather than a single event or initiative, and it must typically have backing from the very top of the organization. Creating a repeatable ETL process and getting data from disparate sources to a staging database and then to the data warehouse is a time-consuming process. At this point, you should understand that:
There is likely to be continuous maintenance on a data warehouse, because it’s an entity that grows as the need for more reports develops within an organization.
The data warehouse grows both in size and complexity as more reports are required.
Using Analysis Services in BIDS by designing, building, deploying, and processing a cube from the data that is established as trusted, ideally from a well-structured data warehouse, is the next step to presenting business users with a cube in useful and meaningful way. As you can see, many steps are involved in getting to trusted data that BI developers and analysts can use in the authoring tools.
Office 2010 is one of those authoring tools, familiar to many, many users, which you can count on for surfacing data prepared for business users to consume and from which they can confidently make decisions, analyze, and predict patterns and behavior in business. SharePoint 2010 is the platform that organizes and shares the results of having authored dashboards, reports, charts, graphs, heat maps, and other products of the Microsoft BI stack. Among other things, SharePoint 2010 provides the following:
Scalability, collaboration, backup and recovery, and disaster recovery capabilities to manage your BI assets created in PowerPivot, Excel, Visio, Report Builder, and PerformancePoint Dashboard designer.
To simplify security, user authentication is handled by SharePoint Server 2010. Authentication of Services users is validated by the SharePoint Server 2010 authentication provider. Trusted locations can also limit access to content types and files.
Publishing BI assets to SharePoint Server websites is a quick and secure way to share the right data, to the right people, at the right time, helping employees work faster and helping them make better decisions, faster.