
After completing this chapter, you will be able to
Understand the definition of business intelligence.
Understand why business intelligence is important.
Preview the business intelligence stack (Office + SQL Server + SharePoint Server).
See examples of business intelligence in SharePoint at work.
Create a collaborative decision-making environment in SharePoint 2010.
This book is a collaborative effort to show how Microsoft and Microsoft SharePoint business intelligence (BI) offerings can help businesses and technical personnel solve common business problems.
BI in SharePoint is less about a specific technology or product tailored to the needs of a small percentage of users, and more about a “buffet” of offerings that can aid customers who are trying to solve a specific problem. One common customer complaint is that much of the published documentation and content is too product-specific. That makes it difficult to get the big picture—and providing that big picture is one rationale for this book.
Even more importantly, customers need to know which Microsoft offerings they should choose from the buffet. Perhaps one day the seven tools that offer a method for creating key performance indicators (KPIs) will merge into a single product, but for now, customers are confused and need guidance as to when they should use SQL Server Reporting Services in SharePoint 2010 rather than PerformancePoint Services, or why they would use PowerPivot for Excel 2010 instead of Excel or Excel Services. Chapter 2, gives this guidance, looking at the tools from a few angles, including a BI maturity model.
This chapter introduces the definition for BI and explains why it is important to you, your team, and your organization. It also discusses the platforms and tools used to deliver pervasive BI for a wide variety of users. At the end of the chapter, we provide a peek at what you can do with BI in SharePoint.
So, exactly what does “business intelligence” mean? The authors could provide a simple, tool-centric definition, but we have decided to give you the context that can help you make the most sense of what BI is, why it’s important, and what forces are driving its popularity.
Observations from Steven R. Covey’s book, The Seven Habits of Highly Effective People, show that an airplane that travels from Boston to Los Angeles is off-course for 90 percent of the journey, but the airplane successfully reaches its destination because the pilot makes continuous course corrections based on instruments that monitor the flight and provide feedback.
Much like an airplane, if a company is not steered, it will inevitably be off course more than 90 percent of the time. Most companies have a goal or destination and, to gain necessary business insights, use instruments or measurement tools to help monitor and analyze past, current, and projected future performance. Those insights give managers the information they need to make changes, or “course corrections.” Insights come in the form of reports, scorecards, KPIs, dashboards, and other information vehicles, driven by a concept called “trusted data.”
These scorecards, dashboards, KPIs, reports, and other tools can help a company see the relationships between their business and its highest priorities and strategies. Decision-makers want the visual experience that dashboards offer so that they can feel as if they’re driving their company to its destination.

Fortunately, airplanes are predictably more successful at reaching their destinations than companies are in successfully reaching their goals. Is this success due to the science and precision of the measurement tools used in the aviation industry?
Over the years, weather conditions, patterns, and other variables that affect flight and direction—originally considered unmeasurable—have become increasingly measurable. New instruments were developed and produced to give pilots precise location coordinates. Now the same is occurring for businesses. Douglas W. Hubbard, in his book How to Measure Anything; Finding the Value of “Intangibles” in Business, lists a few real-life examples of variables that companies previously chose not to measure because they were presumed to be unmeasurable, including:
The flexibility to create new products
Management effectiveness
Productivity of research
Risk of bankruptcy
Quality
Accounting professionals and academics, including Robert S. Kaplan, Baker Foundation Professor at Harvard Business School, have developed methodologies for measuring many elements in business that were previously thought of as unmeasurable in the performance of companies. Kaplan and David Norton proposed the concept of a Balanced Scorecard (BSC) as a means of measuring the performance of a business strategy. The BSC encapsulates four main areas that capture performance metrics:
Financial . Measures of profitability and market value to satisfy owners and shareholders
Internal business processes . Measures of efficiency and effectiveness for producing a product or service
Customer satisfaction . Measures of perceived quality, low cost, and other related factors to show how well a company satisfies its customers
Innovation and learning . Measures of a company’s ability to develop and utilize human resources to meet strategic goals in the present and future
The preceding four areas can be simply referred to as Finance, Operations, Sales, and Human Resources or—to simplify even further—FOSH metrics.
Additional perspectives can include community and social impact, government relations, and others. These measures of success are sometimes called critical success factors. The BSC and other methodologies, such as Six Sigma,[1] help companies follow the pattern shown in the following illustration.

A company vision statement or mission statement is important for getting a company to focus on what makes it successful. Someone said, “You must stand up for something, or you will fall for everything.” The vision statement helps a company filter which voices it will listen to, because the vision defines its purpose and reason for existence. Typically, upper management communicates the vision or mission statement to the company.
A strategy is a set of policies, procedures, and approaches to business that is intended to produce long-term success. The strategy reflects the mission of the company.
The mission is also used to develop measurable objectives. When established, objectives help determine KPIs, which are quantifiable measurements that reflect critical success factors.
KPIs allow for monitoring of metrics that are aligned with principal objectives. Then managers or employees can analyze issues that surface from data that indicate conditions that need more attention (once called “exception reports”). Action can then be taken to “correct the course” so that the company reaches its destination.
For illustration purposes, the following example shows how an organization designs a KPI, turning data into actionable information:
Mission: . For Mtn. Bike Company to design, build, and market bikes to meet the needs of the mountain bike community
Strategy: . To improve Mtn. Bike customer’s satisfaction
Objective: . To increase repeat Mtn. Bike customer store sales by 20 percent
KPI: . The number of quarterly repeat sales for Mtn. Bike customers
To achieve the objectives, the decision-makers in the company ask the following questions about the business:
What has happened? (monitoring)
What is happening? (monitoring)
Why is it happening? (analyze)
What will happen? (forecast based on analyzing)
What do we want to have happen? (new hunches spurring new actions based on what you know)
Part of the problem when trying to arrive at the answers to these questions is that much of the data needed is in a raw format stored in line-of-business (LOB) systems and other disparate business areas. Chapter 3, explains how companies accomplish providing access to this data in a usable form.
Companies that develop a vision or mission statement (define who they are and what success is), make goals, and monitor those goals can then reevaluate and flourish. This approach is used by corporations, teams, departments, and not least, individuals (us). Unfortunately, what happens often is that organizations lose focus of the vision and are deterred or distracted.
This is illustrated in the experience of a tragic airplane accident[2] that occurred over 36 years ago. In the middle of the night, a Lockheed 1011 jumbo jet fatally crashed into the Florida Everglades. All vital parts and systems of the airplane were working perfectly, and the plane was only 20 miles away from its landing site.
During the approach, a green light failed to illuminate, and the pilots discontinued the approach. The aircraft was set to a circling holding pattern over the pitch-black Everglades while the crew focused on investigating the failed light. The pilots became so preoccupied with the light that they failed to notice that the plane was gradually descending toward the dark swamp. By the time someone noticed what was happening, it was too late to avoid the disaster.
The malfunctioning light bulb didn’t cause the accident; it happened because the crew placed its focus on something that seemed to matter at the moment while losing sight of what mattered most.
The tendency to focus on the insignificant at the expense of the profound happens not only to pilots but to companies, departments, teams, and individuals. Sometimes the things that distract are not necessarily bad, and often they seem right.
As you will see, BI helps bring to life the mantra, “what is measured gets managed.” We believe it is worth the time and effort to make sure you are measuring the right things. When you know what to measure, you can stay on course and not be distracted by the insignificant.
Simply put, BI comprises the tools that help companies execute performance management. And performance management can be defined as a series of organizational processes and applications designed to optimize the execution of business strategy.
In this book, we extend this definition of BI to include tools that that help individuals, teams, and organizations simplify information discovery and analysis, making it possible for decision-makers at all levels of an organization to more easily access, understand, analyze, collaborate, and act on information—anytime and anywhere.
In this way, to improve organizational effectiveness, Microsoft BI tools enable you to create and manage information through an integrated system that includes core business productivity features, such as collaboration tools, search capabilities, and content management.
This book provides high-level information about the available tools so that you can determine which tools can best help you reach your destination as an individual, team, or organization.
This following story[3] illustrates the importance of winnowing the data that’s truly important from massive amounts of raw data and explains how to incorporate that important data into a BI solution:
Two men formed a partnership. They built a small shed beside a busy road. They rented a truck and drove it to a farmer’s field, where they purchased a truckload of melons for a dollar per melon. They drove the loaded truck to their shed by the road, where they sold their melons for a dollar per melon. They drove back to the farmer’s field and bought another truckload of melons for a dollar per melon. Transporting them to the roadside, they again sold them for a dollar per melon.
As they drove back toward the farmer’s field to get another load, one partner said to the other, “We’re not making much money on this business, are we?”
“No, we’re not,” his partner replied. “Do you think we need a bigger truck?”
You’ll probably agree that we don’t need a bigger truckload of information. Like the partners in the story, our bigger need is a clearer focus on how to value and use the information we already have. Today’s workplace tends to inundate people with information instead of using the right amount of data to focus on the right problems.
The amount of data businesses accumulate will continue to grow—and Microsoft and other companies will continue to develop better methods for moving, storing, retrieving, and displaying that data in meaningful ways. Companies must continue to increase their capacity to discover useful data, which will likely come from various systems and will require planning and collaboration to utilize effectively. Best practices must be developed for getting that relevant information into different forms or visualizations that can help provide insights and change behavior.
In the words of Bill Baker, former general manager of BI applications for the Microsoft Office Business Platform, “There is no substitute for getting the design right, getting the data right, training your users and in general providing them the least amount of data and the most amount of guidance.”
T. S. Eliot, in his poem “Choruses from The Rock,” described the situation as an “endless cycle” in which “wisdom” is “lost in knowledge” and “knowledge” is “lost in information.”
Focusing on good BI addresses that exact problem. It simplifies information discovery and retrieval, making it possible for decision-makers at all levels of an organization to more easily access, understand, analyze, share, and act on information by helping them reach insights. Insights provide the impetus to improve the behavior of individuals, teams, and organizations. “Insights” is the word Microsoft uses to encapsulate what SharePoint 2010 provides to customers in the way of BI.
It is Microsoft’s goal to provide BI tools that give employees access to the data required for making informed decisions and that have the flexibility to work in familiar ways, using tools such as Excel and Visio.
The “analytical paradox” described by Joey Fitts ( http://vimeo.com/11756037 ), author of the book Drive Business Performance: Enabling a Culture of Intelligent Execution, states, “Those who make the most decisions have the least information. Those who make the fewest decisions in the middle of the organization have the most information.” Employees on the front line have the ability to take action on insights derived from analytical capabilities but rarely have the information required to reach those insights on their own. They must ask the IT department—and then get in line when requests for information from systems are backlogged. The following illustration summarizes the vision Microsoft has to deliver BI to more people to solve the analytical paradox (source: http://www.slideshare.net/nicsmith/business-intelligence-deck-final ).
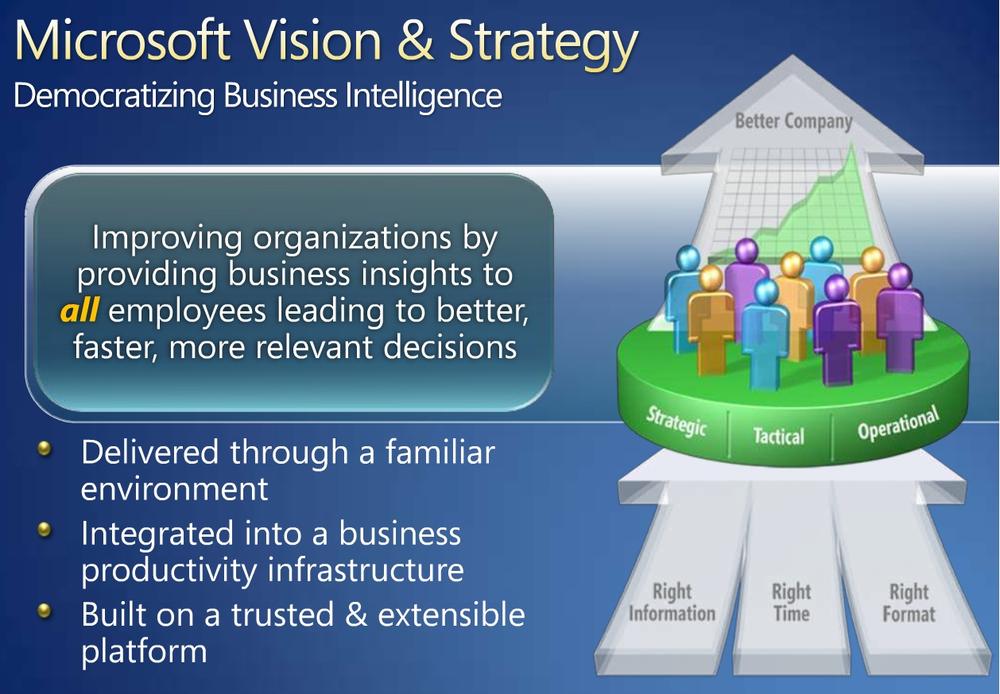
Modern computing power is making BI more and more available to the individuals in an organization so that they can make faster, more informed decisions. Microsoft has worked hard to deliver on the vision and strategy by building the tools that are highlighted in this chapter and in this book.
The preceding illustration shows the flow of right information being delivered at the right time and in the right format. Finding the right amount of information to deliver is critical so as not to overwhelm business users and, at the same time, to help them stay focused. The flow of information in the illustration touches three decision levels: Strategic, Tactical, and Operational:
Strategic: At the executive level, decisions are made that center around what a company is going to do at large, comprising choices such as product lines, manufacturing methods, marketing techniques, and channels.
Tactical: Decisions made at this level support the strategic decisions made at the executive level. At this level, analysts examine whether forecasts meet the financial targets set forth in the 1-to-5-year plan. If they do not, the elements of the forecasts must be changed. For example, a financial forecast is created in part for the purpose of measuring and monitoring against a firm’s own general targets as compared to investor expectations. Investor expectations are based on a number of variables, which include industry average, the economy, and so on.
At this level, pro forma statements are used to accomplish the following objectives:
Estimate the effect of proposed operating changes, enabling managers to conduct “what if” analysis.
Anticipate the firm’s future financing needs.
Forecast free cash flows under different operating plans, forecast capital requirements, and then choose the plan that maximizes shareholder value.
Operational: Operational decisions comprise those made daily by all employees to support tactical decisions. Their impact is immediate, short term, short range, and usually low cost. The consequences of a bad operational decision are usually minimal, although a series of bad or sloppy operational decisions can cause harm. But when taken together, operational decisions can have an impact on the vision of the company.
Is all of this just another attempt toward a “BI for everyone” utopia? We don’t believe it is. We think it is important for you to be aware of the work that may be necessary to prepare data so that insights can be made available to more people in positions to do something about problems. We believe it’s worth your time to review the BI maturity model discussed in Chapter 2, that gives you an idea of where your department or company is in terms of making trusted data available and of having a culture geared toward executing on intelligence. The BI maturity model leads to a well-supported, concerted effort to get data from systems in a state that can be trusted to help support agile decisions.
Many companies use Excel and access to SQL Server for gathering BI and yet still have an infinite number of “versions of the truth.” Also, companies often have some people who are louder than others or have more clout, so those are the folks who end up getting what they need from the IT department to create reports. Others know how to create more visual reports and, as a result, are more successful in getting their data in front of the decision-makers, even when their data is not validated.
We wouldn’t have written this book if we didn’t genuinely believe that you can make a difference in this space to help make the promises of BI become reality.
SharePoint Server 2010 can be used with SQL Server reporting and BI tools to surface BI data in meaningful ways. SQL Server provides the primary data infrastructure and BI platform for giving report authors and business users trusted, scalable, and secure data.
Many good reasons support the partnering of SQL Server and SharePoint product groups to integrate products such as PowerPivot and SQL Server Reporting Services, enabling you to share and organize BI assets in SharePoint lists and document libraries.
The following is a list of benefits that SharePoint Server products provide:
Users can capitalize on SharePoint Server scalability, collaboration, backup and recovery, and disaster recovery capabilities to manage BI assets created in PowerPivot, Excel, Visio, Report Builder, and PerformancePoint Dashboard designer.
Use of trusted locations protocols limits access to PerformancePoint Services content types, Excel Services, and Visio Services files.
When security and data source connections are established, publishing to a SharePoint Server website is a quick way to share BI assets that ultimately help employees make better decisions, faster.
In SharePoint Server, with Excel Services, Visio Services, and PerformancePoint Services functioning as service applications, Visio Web Drawing files, Excel workbooks, and PerformancePoint dashboards and dashboard items are stored and secured within SharePoint lists and libraries, providing a single security and repository framework.
The following architectural diagram, described in detail on the Microsoft TechNet site in “Architecture for Business Intelligence in SharePoint Server 2010,” at http://technet.microsoft.com/en-us/library/ff475895.aspx , provides another, more technical, visual aid for how each of the pieces work together.

Report authoring is discussed in the next section. Report viewing can occur in just about any browser, in Microsoft Office, on Windows 7 phones, and in SharePoint Search.
When it comes to SharePoint and BI, the essential objective is to have the ability to create insights in the authoring tools that are spread among Office, SharePoint, and SQL Server (see the following table) and then to share the results in charts, reports, dashboards, and KPIs. These insights can be shared with the organization, the team or community, or with the individual via a browser.
|
Product or platform |
Authoring tool |
Comments |
|---|---|---|
|
Microsoft Office 2010 desktop applications |
Excel 2010 and Visio 2010 (Professional or Premium) and PowerPivot for Excel 2010 |
Before publishing a worksheet to SharePoint Server by using Excel Services or Visio Services, you must have already authored and—if applicable—connected to a data source. |
|
SharePoint Server 2010 |
Dashboard Designer and Web Parts that offer KPIs |
You start Dashboard Designer from a SharePoint Server 2010 website. BI Web Parts are available to use individually to create simplified KPIs. Each client tool also provides Web Parts to extend your ability to render reports. |
|
SQL Server 2008 R2 |
SQL Server Reporting Services Report PowerPivot for SharePoint |
Report Builder was originally designed to help you create reports. PowerPivot for SharePoint is a SharePoint shared service that integrates PowerPivot into your SharePoint environment. |
The following sections look at ways you can take advantage of SharePoint 2010 features for developing and strengthening your BI capabilities.
The following example of BI shows how a solution using PerformancePoint Services in SharePoint 2010, integrated with SQL Server 2008 R2, provides KPIs that drive decisions in an IT department. The IT Operations scorecard shows how simple it is to see where database space, as a percentage, is not meeting its target. After the following illustration is a brief explanation that maps what is going on underneath the hood.

System Center Operations Manager collects monitor state and performance counter data from managed servers.
The Operations Manager database collects data from the managed servers. Data is pre-aggregated and stored in tables designed to support production reporting requirements.
A small subset of data in the Operations Manager data warehouse (OperationsManagerDW) is transformed and loaded into the BI framework database (Operations Manager BI). This database contains the star schemas for the Analysis Services OLAP cubes.
Analysis Services OLAP cubes are built and processed from data stored in the Operations Manager BI database.
Data from the OLAP cubes is used to populate PerformancePoint Server scorecards, dashboards, and analytic reports. These components are originally created using the Office PerformancePoint Services 2010 Dashboard Designer.
Scorecards, dashboards, and analytic reports are made available to the user community through SharePoint Server. After the scorecards, dashboards, and analytic reports are initially created and deployed, they should not need to be deployed again. These components are refreshed as new data becomes available in the OLAP cubes.
The IT Operations scorecard on the right side of the illustration reveals (flagged by the red diamonds) that free-space targets for the database are not being met.
Companies can combine social networking and BI to foster collaborative decision-making. In a way, this is a form of BI that empowers employees to vote on decisions for the organization. It promotes collaborative decision-making (CDM) as described in Wikipedia, “a recursive process where two or more people or organizations work together in an intersection of common goals—for example, an intellectual endeavor that is creative in nature—by sharing knowledge, learning and building consensus.”
Because of the “SharePoint effect”—a phrase used in the book SharePoint Deployment and Governance Using COBIT 4.1: A Practical Approach—sites, lists, and documents are being created and stored in ever-increasing quantities. Organizations can quickly be overwhelmed by lists and libraries. The problem requires some techniques to help filter all the information. For this reason, companies might consider using some of the social computing features available in SharePoint 2010, such as the Rating Setting or tagging documents, so that focus is on the most useful BI assets. Other social networking features in SharePoint can also prove useful. Consider how the following can be used for collaborative decision making:
Social networking . The ability to connect with others in the organization
Social content . Communication venues such as blogs and wikis for sharing content
Social feedback . The ability to tag documents and other content
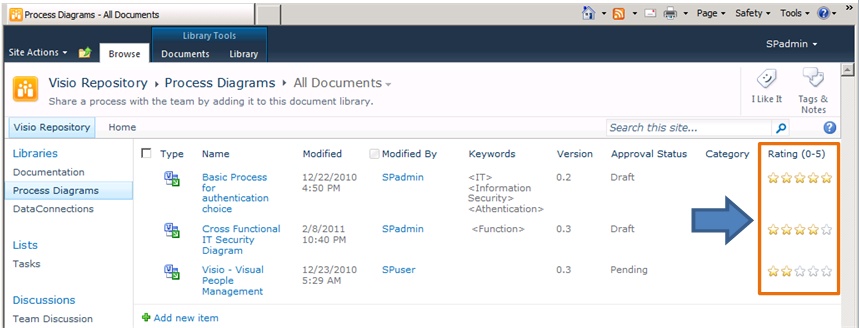
Following is an example of the Rating Setting for lists; to the right of the large arrow, you can see a list that has a rating system, generated by BI users. This example demonstrates “leadership that can be social” and puts decisions in the hands of those who review dashboards, scorecards, and reports, perhaps daily. This type of feature improves the level of trust in BI assets.
In the library where you have your BI assets listed, click the Library tab.
In the Settings group, click Library Settings.
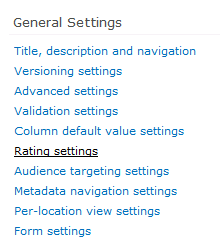
Under General Settings, click Rating Settings.
In the Rating Setting dialog box, select Yes and then click OK.
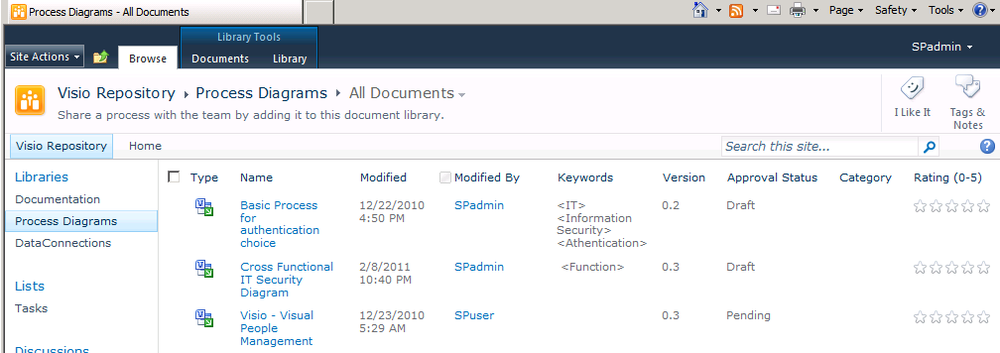
Navigate back to the Library to see that the rating setting is viewable.


In this chapter, we discuss the purpose and need for BI in language that is directed at the business user. We show that companies are much like aircraft in that they have a destination or goal and must constantly react to feedback provided by instruments that measure and monitor. Those instruments are the BI tools we implement so that we have a method for visualizing metrics that tell us what has happened, what is happening, why it is happening, and what will happen to our business.
We explain Microsoft’s vision for BI. We also explain what SharePoint does for BI and provide a couple of examples to show the benefits of using SharePoint 2010 in any BI implementation.
As you can see, there is a lot to cover in this book. We are excited to show what you can do with BI in SharePoint 2010.
[1] Originators of Six Sigma: http://web.archive.org/web/20051106025733/http://www.motorola.com/content/0,,3079,00.html .
[2] The Crash of Flight 401 (source: http://www.suite101.com/content/the-crash-of-flight-401-a97138 ).
[3] Do you think we need a bigger truck? (Source: http://www.hort.wisc.edu/cran/pubs_archive/newsletters/2002/news_2002_09_05.pdf ).