
2
The analogue television business today
The background to a digital future
It is frequently suggested that the ‘golden age’ of television was during the period 1950–60. It is true that television almost ruined Hollywood’s fortunes during this period; but if this was the golden age, then it was one of black and white, somewhat limited creativity, poor reception, lack of competition (except in the USA) and, by and large, public service broadcasting.
In 1950 television was at its most mature in the USA where, during the first six months of that year, some three million sets were sold. Four networks competed for viewer loyalty (NBC, CBS, ABC and DuMont), although NBC and CBS dominated. The DuMont network went out of business in 1956 and ABC struggled through television’s first ten years before finding its feet in the 1960s.
In war-ravaged Europe, progress was significantly slower. France established Radiodiffusion-Télévision Française (RTF) immediately after the liberation in 1945 but did not initiate full weekday television until 1947. Its millionth television receiver was not sold until 1958, despite the development in 1956 of its Sequential Coleur à Memoire (SECAM, Sequential Colour with Memory) colour system.
Germany had managed to maintain a pattern of propaganda television broadcasting to public places until 1944, but it was not until 1949 and the establishment of the Federal Republic that ‘modern’ television could even begin to blossom. Control of television was ceded to the various regional Lander, although the whole system was hamstrung by the notorious Proporz method, whereby political parties allocated senior television posts in direct proportion to their parliamentary powers; the programming chief coming from Party A, news chief from Party B, etc. ARD, West Germany’s first public network (although supported by advertising), was joined by ZDF in 1962, again with commercial time sold in specific time slots, but not within programmes.
Television broadcasting in the UK recommenced in 1946, under the firm hand of John Reith. With a new Conservative government elected in 1951, approval was given for a second, commercial service to be established with a franchised system of regional operators, licensed by the (then) Independent Television Authority. if sales of television sets are any guide, then the coronation of Queen Elizabeth II in 1953 marked the beginning of the UK’s television age.
Japan’s television engineers had pioneered many developments pre-war, but television was initiated by public broadcaster NHK on 1 February 1953, and a commercial service (Nippon TV) on 28 August. Services were limited to Tokyo, and not surprisingly receivers were limited – just 866 at year-end. Imported from the USA, a set would typically cost 250 000 yen, equivalent to the annual salary of a middle-class white-collar worker. Another royal event, the wedding of Crown Prince Akihito to Michiko Shoda (10 April 1959), was again the catalyst in selling an estimated two million sets.
Fifty years of progress
if we take 1950 as a generic ‘starting point’ for modern television broadcasting, then the medium is only now, in the year 2000, celebrating its fiftieth birthday. It has come a long way. While it would be simple to categorize television’s development over this fifty-year period, this book has ‘digital’ in its title, and to get from analogue to digital is not simply a technical quantum leap, it also represents the development and maturity of the analogue system. Without multi-channel analogue television, the mass-market penetration of television sets and general economic prosperity we would not have the necessary base ingredients to make the great leap forward.
A history reminder: In 1957 the Soviet Union launched
Sputnik, the world’s first artificial satellite.
Analogue television today contains all the necessary components to make a seamless switch to digital – and beyond – fairly easy to achieve. Indeed, for the US people the bulk of their digital signals are simply re-transmissions of their existing analogue TV broadcasts. Wholly new digital services, from satellite operators such as DirecTV and EchoStar, are generally extensions of existing channel offerings, plus a few extra movie services and sports channels (frequently structured into thematic services/events), Pay Per View (PPV) or Near Video-on-Demand (NVOD) movie channels and some extra channels to boost the basic tier.
Virtually all these services exist to a greater or lesser degree on US and Canadian cable systems, in analogue. Besides a clear improvement in transmission quality, digital broadcasting, whether via existing cable or by Direct-To-Home (DTH) satellite transmission, is currently essentially a means of adding channels and viewer choice to the typical 45–60 channel line-up available to US cable viewers.
This situation is changing rapidly. Globally there are exciting changes afoot as cable companies upgrade their analogue networks to cater for digital services (of which more later). Let us refresh our memories as to how the industry arrived at the position today.
‘The American way’
Event one: Open house for cable
Until the 1970s, television was a closed business. The established network players, whether in the USA or Europe, had things pretty much their own way. In the USA, however, three quite separate events radically changed the way broadcasting developed.
In 1972 the US television licensing authority, the Federal Communications Commission (FCC), permitted cable operators to enter the top 100 broadcast markets in the USA. At that time, cable companies were specifically limited in the way they could conduct business in cities where the broadcast monopoly was in the hands of expensively licensed over-the-air stations; they thus made their cash by delivering signals to outlying suburbs.
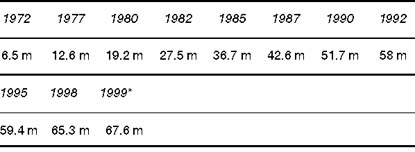
In 1972 just 6.5 million homes subscribed to cable. By 1982 that figure had jumped to 27 million. By 1992 connections were close to 60 million. By May 1999 the number had grown to 67.6 million subscribers out of 95.6 million homes passed (where a cable passes a home, but is not necessarily connected to that home).
Since 1995 the growth of cable has slowed, not surprisingly, considering the high penetration levels; but it is also a result of digital dish sales beginning to eat into this established market. Nevertheless, cable growth, according to Robert Nelson, director of Standard & Poor’s Communications and Cable group rate (as at July 1997) shows a buoyant 2-3 per cent annual growth despite competition from digital Direct Broadcasting by Satellite (DBS). Later we will analyse this competition in more detail, but for the sake of comparison, US cable grew by an average 3–4 per cent
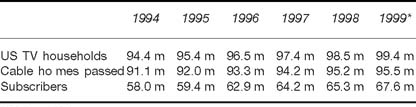
*To May 1999
Note: The FCC’s declared number of TV households for regulatory calculation is 96.9 million, as at 1998. The television industry estimates a higher number of TV households.
Data: Industry sources; Cable World, 1999
Table 2.1 US cable connections 1994–99*
Data: Neilsen Media Research, September 1999. Data on 1 Jan each year
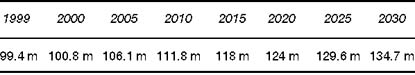
Table 2.2 US TV Households – the next thirty years
*May 1999
Data: Industry sources; Cable World, 1999
Table 2.3 Twenty-five years of growth: US cable subscriptions
through the early-to-mid-1990s, and the 2+ per cent figure is better than most analysts were predicting as recently as 1995.
Event two: Channels galore
This second event was a product of the first. With increasing access to major towns and cities via cable, new broadcasters could enter markets previously closed to them. The first to do this was Home Box Office (HBO), a division of Time Inc., which started ‘broadcasting’ its ‘movies-to-exclusive-entertainment service’ on 8 November 1972, celebrating its twenty-fifth anniversary in November 1997. Late in 1975 HBO borrowed US$9 million from its parent to secure a long-term transponder lease on what was then a very rare commodity: an orbiting satellite owned by RCA.
Without HBO there would be no modern cable industry. Through the 70s and early 80s the reasons people subscribed to cable were HBO, CNN and ESPN, but the fundamental driver was HBO. It was something Americans had never been able to get on their TV sets before: 24 hours of uncut, commercial-free movies and R-rated movies to boot.
Larry Gerbrandt: VP, Paul Kagan Associates
(personal interview, 1994)
HBO intended beaming its programming signal nation-wide, improving its then limited distribution, to cable head-ends (the point from which cable signals are distributed) for redistribution. At the time, according to Scientific Atlanta, there were only two ground-stations capable of picking up the transmissions.
A history reminder: In 1962 the USA launched TELSTAR, the world’s first communications satellite used for TV programming.
Within weeks, Ted Turner (who had recently bought the Atlanta Braves baseball team and was keen to ‘export’ their televised games across the USA) was also after a transponder, a process that took him head-to-head with government. But HBO and Turner’s plans galvanized the struggling cable industry. Teleprompter Corporation, then the nation’s largest Multiple System Operator (MSO) but reportedly close to bankruptcy, ordered satellite earth stations for each of its systems. Other MSOs quickly followed suit.
Turner received a transmission licence on 27 December 1976. With typical Turner overstatement, he called his modest Atlanta Channel 17 WTCG service: ‘The Superstation that Serves the Nation’. The actual ‘nation’ able to receive Turner’s (or HBO’s) satellite transmissions numbered no more than 10 000 homes, comprising the few cable operators that had by then installed earth stations. Turner later changed the station’s name to TBS, and today the channel is consistently amongst the top three services in cable’s basic tier.
Between them, HBO and Turner gave the cable industry a much-needed shot in the arm, providing two channels with counter-scheduling compared with the big three networks NBC, CBS and ABC. Other channels followed, although the next leap forward had to wait until Ted Turner launched his 24-hour Cable News Network (CNN) on 1 June 1980.
Event three: a recording studio in every home
The third development, again hand-in-hand with the growth of cable, was the rapid adoption by viewers (in the USA, Europe and Japan) of video cassette recorders (VCRs). After a slow start, not helped by competing recording standards, VCR sales briskly grew during the early 1980s, from 2.3 m by late 1981, 25 m by 1985 and 65 m by 1990. While viewers were still keen to watch network television, the arrival of a simple method to time-shift cable (or network) programming, gave an added impetus to installing cable.
The American way – today
Analogue broadcasting in the USA is (generally) profitable, diverse and vibrant. At the top of the tree are the ‘big three’ networks:
Table 2.4 The world’s top media companies
| 1996 | 1997 | 1998 | 1999 | ||
| 1 | Walt Disney | 18.7 | 22.4 | 22.97 | - |
| 2 | Time Warner | 10.0 | 13.2 | 14.5 | - |
| 3 | Sony | - | 10.5 | 14.4 | 14.5 |
| 4 | Time Warner | 10.8 | 11.3 | 12.2 | - |
| 5 | Viacom | 9.6 | 10.6 | 12.0 | - |
| 6 | News Corp | 8.2 | 9.0 | 11.9 | |
| 7 | Fox Entertainment | - | - | - | 8.0 |
| 8 | TCI | 8.0 | 7.5 | 7.3 | - |
| 9 | CBS | 4.1 | 5.3 | 6.8 | - |
| 10 | Hughes Electronics | 4.0 | 5.1 | 5.9 | - |
| 11 | Polygram | 5.4 | 5.4 | 5.4 | - |
| 12 | NBC | 5.2 | 5.1 | 5.2 | - |
| 13 | Seagram/Universal 5.1 | 5.5 | 5.0 | - | |
| 14 | BBC | - | - | 4.4 | 4.7 |
| 15 | Nintendo 2.8 | 3.3 | 4.3 | - | |
| 16 | CLT-Ufa | - | 2.5 | 3.1 | 3.4 |
| 17 | Fuji TV | 2.9 | 3.2 | 3.3 | - |
| 18 | Cablevision Systems | 1.3 | 1.9 | 3.2 | - |
| 19 | Carlton Communications | 2.7 | 2.9 | 3.0 | - |
| 20 | Canal+ | 1.9 | 2.3 | 2.7 | - |
Notes: (US$billion)
Sony data excludes electronics/insurance businesses.
1999 data shows results where announced prior to press time.
All local currencies shown in US dollars at constant 1998 rates.
Data shows companies by latest annual turnover, consequently does not show those companies (Viacom/CBS, NBC/Paxman) involved in late 1999 merger activity.
Source: Screen Digest, July 1999
The so-called ‘Peacock Web’ of NBC (owned by General Electric), the ‘Eye Network’ of CBS (since September 1999 owned by Viacom) and the ‘Alphabet Web’ of ABC (owned by Disney).
From a viewer’s perspective, the three networks are much the same. Each network owns and operates (the ‘O&Os’) a limited number of stations. The formula for permitted station ownership is complex: networks can themselves own either twelve stations or reach a maximum of 35 per cent of the US population; but high-dial positioned UHF stations are considered only 50 per cent of the ‘value’ of low-dial VHF stations, helping distort the actual penetration figures. Suffice to say the major players are operating in the most lucrative ‘big city’ markets.
However, extended might and power comes from ‘affiliate’ stations, who carry network-provided programming to a near 100 per cent national penetration in return for a portion of the advertising revenue gained. The income structure for an affiliate station is also highly complex, but the end result sees the ‘winning’ network reward its affiliates with more favourable advertising rates.
All three networks have spent ample time in the financial doldrums. As at mid-summer 1997, ABC, as a core network, was only just profitable and struggling in the ratings. ABC is now part of the much larger Disney empire, a move that may simply be calculated to make the network a shop-window for Disney output and merchandise. But Disney provides a perfect example of the risks facing any of these new network owners. In the four years following Disney’s acquisition of ABC (for US$19 billion, in 1995), ABC has seen profits plummet from around US$400 m a year to a loss of $100 m.
In September 1999 Viacom ‘merged’ with CBS in a deal valued at US$36 billion, creating another USA-based broadcasting powerhouse with annual revenues of more than US$20 billion. For its last complete year (1998) NBC saw profits evaporate by one third, while CBS barely broke even. It will be interesting to see how CBS, under Viacom’s control, fares over the next year or so.
Since 1995 the prime-time ratings winner has tended to be NBC, thanks to seven out of the top ten shows (including Seinfeld, Friends, Frasier). In 1997 its profits were around US$500 million.
However success is conventionally measured, these three networks must be considered as dinosaurs. It matters little who is the current ‘top dog’, only that they are collectively losing audience share at a frightening rate. The facts are that in 1977, the three networks dominated prime-time television capturing 93 per cent of viewing. This figure was down to 89 per cent by 1980, to 74 per cent by 1985, 71 per cent in 1987 and 65 per cent in 1990. During the winter 1996–97 season, their share had dropped to 49 per cent of prime-time viewing according to Nielson Media Research, the first time their collective share dropped below the 50 per cent mark.
Even worse, any network might have an individual high-spot but it comes at the expense of the other two, tending not to eat into basic cable’s audience share at all. In other words the ‘big three’ networks are eating each other alive.
Part of [the problem] is that there are more entertainment options out there, and not just on the television dial.
Giles Lundberg, Fox TV’s head of
research and marketing.
Variety magazine, May 1997
Network television’s decline
The reasons for this decline are two-fold. First, as its penetration increased, cable viewing eroded the network share of viewing. while some cable channels slightly increased their own viewing share, it was the growing number of channels available through the late 1980s and 1990s, plus the 65+ per cent penetration of cable, that has worn down the network’s domination.
In mid-1999 there were more than 200 analogue niche channels already transmitting to US viewers, many of them achieving less than 0.1 per cent audience share, and with dozens waiting for extra capacity to be created. Fewer than 50 of those broadcasting found nation-wide carriage owing to the previously mentioned capacity limitations, suffered by virtually all cable operators. An increasing number of channels are finding carriage on new digital networks, and on digital satellite, of which more later.
Secondly, the three networks were challenged by new entrants to non-cable network television, that is, conventional over-the-air broadcasting. In 1970 there were only 65 independent (non-affiliated) television stations; by 1980 the number had grown to 115. Lower cost transmission equipment and the attractive advertising market made owning a television station desirable, particularly to publishing groups. In the 1990 television census, there were 339 independent stations. We will look at the prospects for emerging ‘micro-TV’ stations in a later chapter.
Rupert Murdoch started building his Fox Network in 1986, buying the Metromedia group of stations and then, through further purchases and affiliate relationships, launching Fox as a rated network in time for the winter season 1990–91. Initially Fox was very much a part-time network, ignoring some weeknights completely, and leaving breakfast and day-time alone. In mid-1997 Fox started to offer a near-complete schedule. Their winter season (1996–97) achieved a 13 per cent share of prime-time across all viewing.
A typical week on Fox TV (late August, 1999) saw The Simpsons gather a 13 per cent share of all viewing, helping to drive the network to an average 12–14 per cent (dependent on which week one examines). This is behind the ‘big three’ of ABC, CBS and NBC, but Fox is less interested in ‘all viewing’, preferring to target the more lucrative ‘teens and twenties’ age group. It has largely succeeded in its goals.
Fox TV consistently wins the weekend morning slots, with a typical 20 per cent share, with only the Disney-backed ABC Network’s 10 per cent share coming close to Fox. Fox owns 23 stations, reaching 34.8 per cent of FCC-calculated television households. At mid-August 1999 Fox was the biggest American television group, bigger than CBS, NBC or ABC when measured by audience reach.
In addition to Fox, the ‘big three’ have had to cope with challenges from two other mini-networks (usually referred to as ‘baby-nets’). United Paramount (UPN) broadcasts on five evenings a week (Monday to Friday) gaining a typical 4–5 per cent audience share, while the Warner Brothers Network (WB) transmits programming on Sunday to Thursday achieving around 4 per cent share.
Table 2.5 The top 20 USA TV groups*
| Rank Group | No. of stations | FCC audience coverage (%) | |
| 1 | Fox TV Stations Inc. | 23 | 34.8 |
| 2 | CBS Stations Inc. | 14 | 30.9 |
| 3 | Paxson Communications Group | 44 | 26.8 |
| 4 | Tribune Broadcasting | 17 | 25.9 |
| 5 | NBC Inc. | 11 | 24.6 |
| 6 | Walt Disney/ABC Inc. | 10 | 24.0 |
| 7 | Gannett Broadcasting | 18 | 18.0 |
| 8 | Chris Craft/BHC/Utd | 8 | 17.6 |
| 9 | HSN Inc/Silver King | 17 | 16.4 |
| 10 | Telemundo | 8 | 10.7 |
| 11 | A H Belo | 16 | 10.5 |
| 12 | Paramount Stations | 13 | 9.1 |
| 13 | Univision TV Group | 12 | 9.9 |
| 14 | Cox Broadcasting | 12 | 9.5 |
| 15 | Hearst-Argyle TV | 16 | 9.2 |
| 16 | Young Broadcasting | 15 | 9.0 |
| 17 | E W Scripps Co. | 10 | 8.7 |
| 18 | Sinclair Broadcasting | 28 | 8.2 |
| 19 | Post-Newsweek Stations | 6 | 7.1 |
| 20 | Meredith Corporation | 11 | 6.2 |
* Data: Broadcasting & Cable, 1999
Table 2.6 USA network rankings*
| 1 | NBC |
| 2 | CBS |
| 3 | ABC |
| 4 | Fox |
| 5 | UPN |
| 6 | WB |
* All-adults, prime-time average 1997–8 winter season
Data: Industry sources
In addition to these newcomers, analogue over-the-air transmissions have other challenges, again eroding network share for the majors. Two Spanish-language broadcasters are achieving notable success in highly-regional markets: Univision (carried to 92 per cent of Spanish-speaking households) and Telemundo (carried to 80 per cent of Spanish-speaking households). In 1998 Univision regularly attracted 80 per cent of Spanish speakers, putting the broadcaster ahead of all the major networks in Hispanic neighbourhoods. With a diet of telenovellas and game shows Univision’s network even outperformed UPN and WB nationally. About half its programming is original, mostly produced in Miami, the rest bought in from Venezuela, Argentina and other Latin American markets. Telemundo, the second largest Hispanic network has production facilities in Hialeah near Miami, Los Angeles and Puerto Rico, although its daily output is less than Univision.
There are other network groupings, of which the most significant is Barry Diller’s Home Shopping Network/Universal. Other groups predominantly transmit religious programming.
It has frequently been said that Fox, UPN and WB are just cable channels that have a mainstream distribution chain. Certainly the programming on offer, themed and stripped across schedules, has far more in common with cable than with the ‘conventional’ networks, who attempt to satisfy the interests and tastes of a much wider audience.
The growth of cable
Cable distribution in the United States was recently described as the ‘57 Million Club’, whereby the top 25 multiple system operators (MSOs) controlled some 88 per cent or 57 million of the USA’s 67 million cabled homes. Any examination of US cable can only ever be a snapshot in time, as the industry is highly volatile with frequent buying, selling, swapping and merging of systems.
Cable companies offer a mix of local programming; the FCC ‘must carry’ regulations obliging them to supply all local network channels. As described earlier, specific channels like HBO, CNN and ESPN were designed exclusively for carriage by cable (and
Table 2.7 The top 25 US cable companies
| Rank Company | Subscriptions (m) | Penetration (%) | Pay/ Basic* (%) | |
| 1 | Tele-Communications Inc | 14.3 | 60 | 108 |
| 2 | Time Warner Cable | 12.3 | 68 | 65 |
| 3 | US West Media Group | 5.2 | 63 | 83 |
| 4 | Comcast | 4.3 | 62 | 92 |
| 5 | Cox Communications | 3.2 | 65 | 61 |
| 6 | Cablevision Systems | 2.8 | 65 | 150 |
| 7 | Adelphia Cable Communications | 1.8 | 71 | 50 |
| 8 | Jones Intercable | 1.4 | 62 | 80 |
| 9 | Century Communications | 1.2 | 59 | n/a |
| 10 | Marcus Cable | 1.19 | 64 | 56 |
| 11 | Suburban Cable | 1.15 | 76 | 65 |
| 12 | Charter Communications | 1.07 | 56 | 54 |
| 13 | Falcon Cable | 1.05 | 80 | 29 |
| 14 | Prime Cable | 0.85 | 53 | 87 |
| 15 | InterMedia Partners | 0.82 | 63 | 66 |
| 16 | TCA Cable Television | 0.7 | 76 | 65 |
| 17 | Cable ONE | 0.63 | 74 | 64 |
| 18 | Fanch Communications | 0.50 | 69 | 38 |
| 19 | Multimedia Cablevision | 0.47 | 61 | 69 |
| 20 | Triax Communications | 0.45 | 69 | 63 |
| 21 | C-TEC Cable Systems | 0.37 | 65 | n/a |
| 22 | Rifkin & Associates | 0.31 | 71 | 54 |
| 23 | Service Electric Cable | 0.29 | 72 | 37 |
| 24 | Tele-Media Corp | 0.28 | 77 | 31 |
| 25 | SBC Media Ventures | 0.27 | 66 | 100 |
* Pay/Basic, the number of customers who take a premium channel
Source: Broadcasting & Cable, June 1997
Author’s note: This 1997 listing remains interesting, if only to show the wide disparity between different companies on both the all-important cable penetration rates and pay-basic ratios.
more recently the growing number of digital Direct Broadcasting Satellites, DBS). Cable operators throughout the world use the US model, in which MSOs split channels into two quite distinct types: a basic tier usually priced to include anything between 20 and 40 channels, and premium services charged on an individual or à la carte basis.
Table 2.8 The top US cable operators*
| 1 | TCI/AT&T | $5.0 bn |
| 2 | Time Warner | $3.7 bn |
| 3 | Cablevision | $2.4 bn |
| 4 | Cox Communications | $2.0 bn |
| 5 | Comcast | $1.25 bn |
* By turnover (US$)
Data: Screen Digest, July 1999
Squeezed out
Far from the much talked-about ‘500 channel universe’, even the USA, the most mature television market in the world, cannot find adequate space for more than a third of the channels currently available.
We’ve got four not-fully-distributed networks out there in Cartoon Network, Turner Classic Movies, CNN/Sports Illustrated and CNNfn, so I don’t know at this point that it makes any sense to try and put any more out there.
Brad Seigel, president TNT/TCM,
personal interview March 1997
In 1995 there were four proposed networks wishing to cover the ‘family/parenting’ sector. Only one remains. Speaking in March 1997, James Zeilinger, president of Parent Television, said that more Americans subscribe to parenting magazines than food or health titles, but his network still couldn’t find carriage space. ‘We came close many times to signing a deal,’ he said. ‘[but] it’s a chicken and egg situation … we can’t afford to bleed that much [cash] until there are more than a few million [digital boxes].’
The US cable market is beginning to address this capacity shortage by overlaying and converting its current analogue copper co-axial systems to glass fibre and hybrid-fibre/co-axial ready for digital. (Chapter 3 describes how cable companies are converting to digital.)
In North America there is other broadcast activity besides cable. We need to mention the direct-to-home satellite market that grew up in the whole of North America. During the 1960s and 1970s, the radiated power from an orbiting satellite was weak, needing very large receiving dishes on the ground. Nevertheless, some enthusiasts started eavesdropping on this signal in much the same way radio amateurs have always sought out weak and distant signals.
By the early 1980s satellite power outputs were increasing, and dishes commensurately reduced in size, enabling a wider audience to invest in what were then called TVRO systems (Television Receive Only Earth Stations). Now we would simply call them dishes. HBO, for example, were forbidden to distribute their signals via cable in Canada, and many Canadians bought two and three-metre dishes to receive signals, even though viewing such signals was technically illegal in Canada.
For many years reception of such signals (in the USA as well as Canada) was ignored by the broadcaster. The market was small in comparison to that of cable, but by the early 1990s this had grown to some 4 million ‘backyard’ dish systems. Scrambling, already common to cable viewers, was becoming increasingly normal on all satellite transmissions thus forcing viewers to subscribe, usually to a programme packager.
By mid-1999 this analogue market was in steep decline in the USA and Canada, as digital broadcasting became more commonplace, and viewers saw the benefits of digital transmission over analogue. During the first half of 1999 this market declined, losing another 94 000 subscribers to a new low of 2.18 million ‘backyard’ dish homes. It is expected to fall back to a level where viewing with large, steerable dishes is again limited to enthusiasts. This is already happening and by mid-2000 numbers had dropped below 2 million.
The European way – today
Describing analogue television in Europe represents something of a challenge when compared with the US model. Besides the obvious linguistic and cultural differences, there are significant contrasts among the European countries in how broadcasting has evolved since the Second World War.
A history reminder: News International buys struggling Satellite TV, and renames it Sky TV, 1983. In 1988 News Corp launched a four-channel Sky service.
According to the advertising industry, in television terms Europe comprises 33 countries and 35 sales markets (the difference being the linguistic splits in Belgium and Switzerland). Some pan-European satellite channels have attempted to break through these national and linguistic barriers (notably the original Sky channel in 1982, ‘SuperChannel’ which launched in February 1987 and MTV which launched in August 1987). However, Europe remains a fragmented television market.
Even though the official line from the European Community is to support and encourage the concept of ‘television without frontiers’, the reality is that European harmonization of television services simply has not happened. There is some limited cross-border traffic in complete channels (French channels in Wallonia, Dutch channels in Flanders, BBC services in Ireland and The Netherlands), but these are the exception and generally restricted to linguistic groupings.
Europe shares at least one common trait with the USA, however: an ability to create super-large TV groups, frequently headed by a so-called media mogul. While the US giants (Time Warner, Viacom) are significantly larger than their European counterparts, in many respects the European ‘mogul’ has a high visibility outside the media sector, notably Leo Kirch, Silvio Berlusconi and of course, Rupert Murdoch (an ‘honorary’ European in this case because of his significant European media interests). Though the USA has important names like Ted Turner and Bill Gates, one suspects that few ordinary members of the viewing public could name the various conglomerate chief executives now running NBC or ABC, or even important media figures like Gerald Levin (Time Warner) or Sumner Redstone (Viacom). Most people in the USA would almost certainly recognize Rupert Murdoch, however.
It is also worth bearing in mind that, as already mentioned, television in Europe is a relatively modern phenomenon. Whereas the USA had an estimated 36m television households by February 1955, the whole of Europe possessed only some 4.8 m television sets (Smith, 1995).
There is one other important similarity with viewers in North America. Europeans are turning away from the established public ‘free-to-air’ networks (both publicly supported and commercial). I the ‘big five’ European markets, for example, only France held on to market share in the period 1990–1995.
Table 2.9 Public broadcasters’ viewing shares
| 1990 (%) | 1995 (%) | |
| UK | 57 | 54 |
| Germany | 58 | 35 |
| France | 33 | 42 |
| Spain | 74 | 37 |
| Italy | 50 | 49 |
Source: Zenith Media, Feb 1997
Since 1995, the decline of public broadcast viewing has been more rapid, as multi-channel television gained wider acceptance in virtually all key markets and in the UK especially.
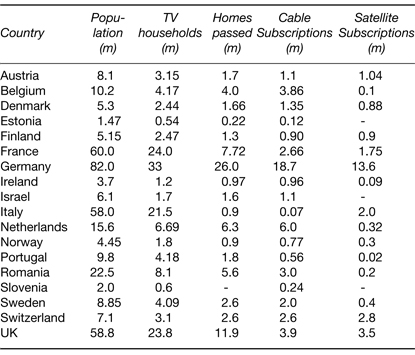
Analogue cable
An analysis of European cable (and satellite) connections shows how far more widespread multi-channel viewing has become since 1990. Indeed, prior to 1990 cable distribution was far from widespread. Only in Belgium was cable available nation-wide (1988, passing some 97 per cent of homes with 87 per cent connections), followed by The Netherlands (1988, 76 per cent of homes passed, 72 per cent connections). By comparison, in West Germany in 1988, while cable passed well over three-quarters of homes, actual subscribers measured less than 19 million television households.
A history reminder: The first Astra (1A) satellite was launched aboard an Arianespace rocket from Kourou in French Guiana in December 1988.
Just as HBO, Turner and the other broadcasters in the USA had sought to reach their viewers exclusively by cable, so various broadcasting groups attempted a similar approach in Europe. The early operators tried to imitate the US broadcasting model; intending their signals to reach cable distributors and deliberately making their channels near-copies of commercial television services, although heavily (indeed, almost exclusively) dependent on inexpensive, imported programming.
Along with Sky Channel, TEN (The Entertainment Network) was launched in March 1984. It failed a year later, to be re-launched as Mirrorvision, owned by Robert Maxwell. Mirrorvision merged with UK-based Premiere in April 1986. Premiere closed in 1989 and Sky Channel, despite News Corporation’s involvement, struggled, as did SuperChannel.
These pan-European services, lured by the concept of broadcasting a common entertainment channel to a growing number of well-heeled viewers, found some enthusiastic support from younger viewers but the numbers were never enough to attract adequate advertising support. The early satellite broadcasts were made from low-power orbiting, effectively ruling out their reception ‘direct to home’.
The universe of homes is not big enough to support thematic channels.
R. Hooper, managing director, SuperChannel
Cable & Satellite Europe, September 1987
Table 2.10 European cable penetration
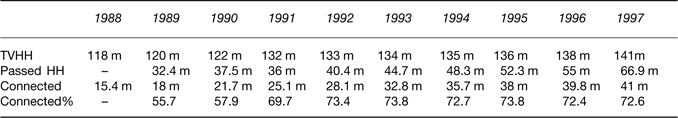
Notes: Percentage connection is of homes passed.
In 1991 the former East Germany was included in data.
Source: European Audiovisual Observatory/European Cable Communications Association, 1998.
Table 2.11 European cable/satellite: 1999*
*Data: European Cable Communications Association, 1999
Sky Channel was Europe’s first satellite television channel, launched in April 1982. In 1983 News International bought 65 per cent of its shares, and by 1988 it owned 82 per cent. In 1987 Sky increased its capitalization by raising £22.63 million, but its losses up till then (and subsequently) were substantial, amounting by the end of its 1987–88 financial year to almost £39 million.
Table 2.12 Sky Channel losses
| 15 months to June 1984 | −£5.7 m* |
| 12 months to June 1985 | −£8.6 m |
| 12 months to June 1986 | −£5.6 m |
| 12 months to June 1987 | −£10.2 m |
| 12 months to June 1988 | −£8.4 m |
* All pre-tax.
Source: Company Reports
Even early launches of popular thematic channels like MTV had tough times, and many forget that Viacom’s first partner in Europe for MTV was Robert Maxwell (who owned a 51 per cent share of MTV Europe, with another 24 per cent owned by British Telecom). Cabled homes (less than fifteen million over the whole of Europe in 1988) were still insufficient to provide a viable market for international services.
Analogue satellite
Analogue satellite broadcasting in Europe had developed in a very haphazard way prior to 1988. During the 1980s there were eight active satellites over Europe, ranging from some with a single channel up to EUTELSAT’s busy EUTELSAT 1-F4 with fifteen channels by early 1989.
In 1988 Sky Channel estimated its maximum potential audience as some twelve million households.
The market needed something else to spur it to action, and that happened on 11 December 1988 when Astra 1A blasted off from Kourou in French Guiana. Astra was owned and financed privately by a Luxembourg consortium, Societé Europeenne des Satellites (SES), incorporated in the Grand Duchy of Luxembourg in 1985.
Luxembourg holds a special place in the hearts of most Europeans of a certain age, as the home of Europe’s first free-enterprise broadcasting, namely Radio Luxembourg, which established itself during the 1930s on an output of popular programmes supported by advertising and sponsorship. The original company (Compagnie Luxembourgeoise de Radiodiffusion) went on to become CLT, of which more later.
In 1983 a percipient Luxembourg government took the decision to enter the so-called satellite age, a decision that was considered brave by many commentators at the time. SES/Astra’s early publicity proclaimed the Brussels-backed message of ‘Television Without Frontiers – Entertainment from the Stars’. Its first satellite (Astra 1A) was launched successfully on 11 December 1988, from which broadcasters supplied a mix of English and German analogue programming designed for reception on small (typically 60 cm) roof-mounted dish antennas.
Table 2.13 Some of the early analogue channels
| Name | Original ownership/notes | Launched |
| Sky Channel | Brian Haynes (backed by Guinness Mahon, etc.) | Apr 1982 |
| Screensport | W.H. Smith, ABC (ESPN) | 1983 |
| Children’s Channel | BT, Thames Television, D.C. | 1984 |
| Thompson, Central Television, EMI | ||
| Teleclub | Rediffusion AG 60%, Beta Taurus | 1984 |
| (Kirch) 40% | ||
| TV5 | A ‘best of French broadcasting’ channel | 1984 |
| Premiere | EMI, Goldcrest, Fox, Columbia, HBO | Sept 1984 |
| Sat Eins | PKS 40%, Axel Springer 15%, APF 15% | 1985 |
| CNN | Turner Broadcasting | Sept 1985 |
| Lifestyle | W.H. Smith, TVS and Yorkshire | Oct 1985 |
| Television | ||
| SuperChannel* | Granada, Virgin, Yorkshire Television | Feb 1987 |
| Satellite Info. Serv | Ladbroke, Mecca, Coral, Grand Met, | May 1987 |
| (SIS) | Wm Hill | |
| MTV | 51% Maxwell, 25% Viacom, 24% BT | Aug 1987 |
| TV3 ScanSat | Kinnevik 96%, Nora (Norway) 4% | Dec 1987 |
| The Movie Channel | British Satellite Broadcasting (BSB) | Mar 1990 |
| NOW | BSB | Mar 1990 |
| Galaxy | BSB | Mar 1990 |
| Power Station | BSB/Virgin | Mar 1990 |
* SuperChannel had started out life as Music Box.
The potential market for direct-to-home satellite reception was minuscule, with no more than 113 880 installations across Europe, according to Cable & Satellite Europe magazine (see Table 2.13). The market was ready to expand, however, a fact noted by many potential broadcasters across Europe.
The emergence of BSkyB
The UK had been allocated five direct broadcasting by satellite frequencies as early as 1977, but it took until December 1986 for
Table 2.14 European satellite dish installations - 1988
| Austria | 6000 |
| Denmark | 8000 |
| Finland | 3600 |
| France | 10 000 |
| Greece | 1500 |
| Ireland | 2000 |
| Italy | 2000 |
| Luxembourg | 80 |
| Netherlands | 2000 |
| Norway | 3700 |
| Portugal | 2000 |
| Spain | 19 000 |
| Sweden | 17 500 |
| Switzerland | 1000 |
| W. Germany | 19 500 |
| UK | 18 000 |
| Total | 113 880 |
Source: Cable & Satellite Europe, October 1988
the then Independent Broadcasting Authority to select British Satellite Broadcasting as the operator. BSB, which achieved fame and then notoriety with its ‘squarial’ dishes, had a troubled time of it. Promised starting dates were broken; technical problems beset the project; and financing cash was spent at a spectacular rate, with accusations of profligacy at board level. BSB eventually commenced transmissions in April 1990, more than a year after Rupert Murdoch had launched his Sky service.
On 8 June 1988, what has been described as the ‘rumpled’ figure of Rupert Murdoch announced to a press gathering that News International would launch four ‘Sky’ channels broadcasting from an Astra craft by February the following year, less than 9 months away. ‘We are seeing the dawn of a new age of freedom for the viewer,’ said Murdoch.
What followed was probably the bloodiest period in British broadcasting, or perhaps broadcasting anywhere. Two companies, Sky, backed by News International, and British Satellite Broadcasting, backed by more than £1 billion of private finance, were locked in a battle for the eyes, subscription cash and loyalty of British viewers. BSB used a new broadcasting standard, the D-MAC system; this needed specially-developed receiver/decoder boxes, although, using fairly high-power satellites, the receiving dishes could be small, no more than about 40 cm across.
Astra 1A went ‘live’ on 5 February 1989. Although designed as a telecommunications craft, rather than a broadcasting satellite, it was the vehicle that enabled many more viewers to access satellite television with low-cost, rudimentary receiver boxes and small satellite dishes. Up to this point viewers had needed dishes of at least 90 cm diameter (and ideally 1.2 m) to obtain a decent screen image.
Murdoch was first to market, with a low-cost receiver box developed by Alan Sugar’s Amstrad company. His launch in February 1989 was itself not without problems, with a promised Disney channel just one of the stumbling blocks; but well within a year of launch Sky was reporting operating losses of £95 million on top of start-up costs of £121 million (News International Annual Report and Accounts, June 1990). These were bad, but BSB’s losses were worse. By October 1990 the two companies had started merger talks, which were completed in November. According to published estimates, by the time BSB and Sky had merged (to become British Sky Broadcasting) they had spent a total of £1.25 billion creating a direct-to-home market in the UK.
Murdoch and his low-cost service, transmitting its channels on the Astra telecommunications satellite, had won the day, even though losses would continue. Indeed, two reports circulated in 1988 were not that encouraging of satellite’s prospects as a broadcasting medium. Logica estimated a UK dish population by 1994 of 600 000. Even more depressing was a CIT document predicting Europe-wide dish ownership of just 1 million by 1996 (see Collins, 1992). There were many similar doom-sayers.
Table 2.15 The Astra constellation - 2001
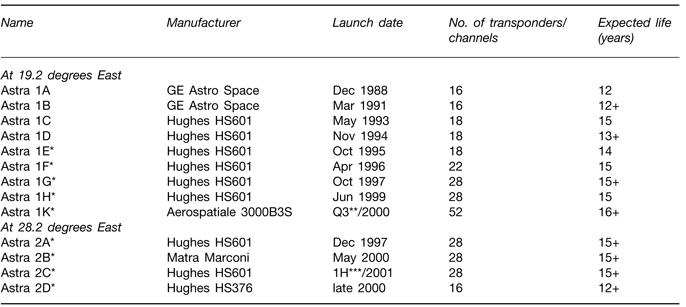
Notes * These craft are intended for digital broadcasting.
Some craft (notably Astra 1G/1H/2A/2B) have extra transponders, generally 4 per craft, providing on-board redundancy and thereby guaranteeing the satellite ends its working life with at least the designated number of transponders.
Astra also have an option to purchase an additional Matra-Marconi craft.
** Q3 = quarter 3 of the business year.
*** 1H = first half year of the business year.
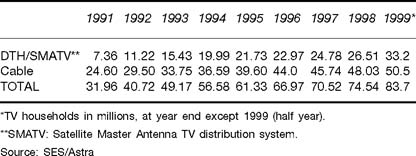
Table 2.16 Astra’s growth and penetration of TV homes*
Analogue satellite television - a European success story
if the 1988 predictions of barely one million dish installations across Europe by 1996 were compared to today’s real position, then by any measure the enthusiastic adoption of satellite broadcasting has been a huge success.
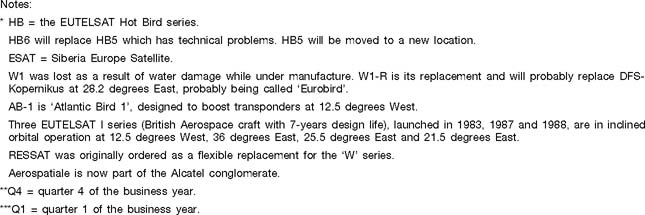
Astra’s own 1987 predictions of its 1996 position have also been exceeded, as revealed recently by Marcus Bicknell, Astra’s first marketing manager. He admitted that some people thought his forecasts optimistic, but they were based on the ownership of VCRs in any given market. On that basis, Astra predicted that in 1996 there would be 20.2 m DTH and SMATV viewers across Europe (some 17 per cent of European TV homes, claimed Astra). The actual 1996 figure was 22.97 m, as Bicknell stated, not only ahead of Astra’s own estimate but reasonably accurate as to the actual market position at the time. At mid-1999 the figure stood at more than 33 m homes.
However, Bicknell’s forecast of European cable connections has proved to be significantly underestimated. In 1987 Astra suggested total cable viewing of 23 m homes in 1996. The reality was near double, at 44 m homes in 1996 and 50.5 m at mid-year 1999. Astra’s predicted combined total (DTH and Cable) for 1996 was 43.2 m homes, but the actual numbers were 66.97 m and midyear 1999 stood at 83.7 m homes. Bicknell recently suggested that
Table 2.17 The EUTELSAT constellation 1999–2001
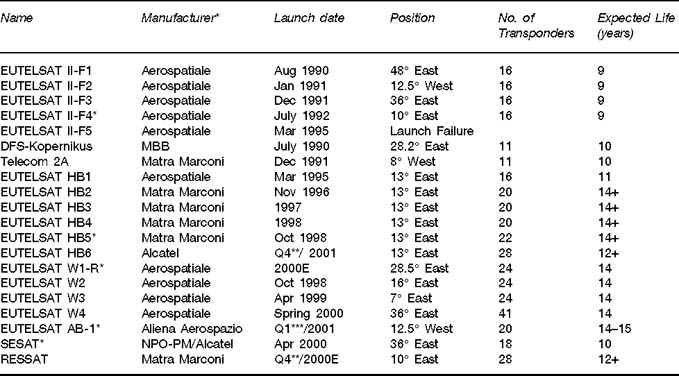
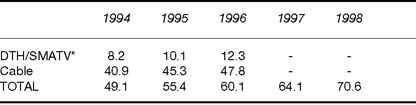
Notes: In millions of TV households
From ‘Hot Bird’ 13 degrees East position
*SMATV = Satellite Master Antenna TV distribution system
Source: Eutelsat Analysis, 1999
EUTELSAT’s household coverage: end 1998
instead of basing his forecast calculations on VCR ownership, a better guide might have been total television ownership.
EUTELSAT claim much higher penetration rates, largely as a result of their wider coverage and relative strengths in Eastern Europe. They claim an enlarged Europe has some 269 m TV homes, of which 80.7 m receive satellite signals by means of satellite, cable delivery or SMATV distribution.
Table 2.19 Europe’s highest penetration cable channels*
| CNNI | 44.421 m |
| Eurosport | 40.599 m |
| NBC Europe | 36.83 m |
| MTV | 35.73 m |
| TV5 | 34.552 m |
| Arte | 29.634 m |
| Viva | 22.72 m |
| TNT/Cartoon | 21.945 m |
| RTL TV | 21.263 m |
| EuroNews | 20.997 m |
| ARD | 20.917 m |
| VH-1 | 20.07 m |
| Sat 1 | 19.40 m |
* Data: Q1 = January–March 1997
Source: Cable & Satellite Europe, June 1997, from data supplied by channels
UK analogue cable and satellite viewing in mid-2000 consistently takes a 40 per cent share (in multi-channel homes), with terrestrial viewing (originally of four networks, BBC1 and BBC2, ITV, Channel 4, and since March 1997, Channel 5) down from 70+ per cent, to 41 per cent in June 1997. When taken as a percentage of viewing in all TV households (not just multi-channel homes) satellite and cable is taking an 11.7 per cent share of all viewing (April–June 1997, Broadcasters’ Audience Research Board (BARB) data). The trends are clear, and the UK’s terrestrial broadcasters (including the BBC and all of the ITV regional companies) have launched niche channels to secure some degree of presence in the sector.
The UK’s Broadcasters’ Audience Research Board (BARB) data shows that within this 11.7 per cent share of all viewing, the UK’s analogue niche channels are very popular amongst the young and better-off, and less welcome in homes of the elderly (55+) and in socio-economic groups C2DE.
The importance of the period April-May-June 1997 in the UK for cable and satellite channels cannot be understated. At the end of March, Channel 5 launched, to around 80 per cent of the UK audience, and BARB data shows that C5 gained a typical 3 per cent of all viewing. The BARB data shows this 3 per cent was won at the expense of the other four ‘network’ channels, and not at the expense of cable and satellite broadcasters, whose audience share remains steady – and gently increasing.
Elsewhere in Europe, multi-channel viewing of the non-publicly* supported channels is considered more commonplace. In Germany the audience for cable and satellite-supplied private channels is typically 60 per cent of all viewing. Comprehensive audience measurement from Eurodata confirms, in their words, ‘cable and satellite cover has been increasing in every country.’ If satellite and cable distribution is flourishing, together with a concurrent growth in viewer choice, it follows that viewing of the once dominant national (public) networks must be shrinking.
Table 2.20 UK niche channels, percentage share by demographic (All individuals, 13 weeks ending 29 June 1997)
| 24 hours | Peak time | |
| All individuals | 11.7 | 9.3 |
| All adults | 10.5 | 8.5 |
| 16–34 | 15.9 | 13.0 |
| 35–54 | 13.1 | 10.6 |
| 55+ | 5.2 | 4.4 |
| ABC1 | 9.3 | 7.6 |
| C2DE | 11.3 | 9.2 |
| 16–34 ABC1 | 14.5 | 12.0 |
| 35–54 ABC1 | 11.0 | 8.8 |
| 55+ ABC1 | 4.2 | 3.3 |
| 16–34 C2DE | 17.0 | 13.8 |
| 35–54 C2DE | 14.9 | 12.2 |
| 55+ C2DE | 5.8 | 5.0 |
| Children | 21.1 | 16.9 |
Data: BARB/Incorporated Practitioners in Advertising (IPA) July 1997
Asia-Pacific analogue trends
The American and European viewing patterns are echoed in the Asia-Pacific region, with some notable local differences. Daily viewing of television in Japan (205 minutes) is higher than in many European countries (UK 215 minutes, Germany 183 minutes, The Netherlands 157 minutes), although still lower than the USA (239 minutes).
Many Asian homes have multiple television sets. For instance in Taiwan, two out of three households own two or more sets, but this does not lead to high television viewing. However, in Thailand there are still broadcasters who do not air a complete 24-hour schedule. Politically-controlled and state-run channels existed until very recently in some countries (for example, Malaysia). There are other viewing oddities, quite alien to ‘western’ viewers. In Taiwan the television weather report runs more than ten minutes (and frequently gets into the ‘Top 10’ programmes) and the main evening news is a one-hour show.
Table 2.21 1996 Daily viewing time per individual*
| Poland | 242 |
| United States | 239 |
| Turkey | 216 |
| Italy | 216 |
| United Kingdom | 215 |
| Spain | 214 |
| Hungary | 213 |
| Japan | 205 |
| Greece | 202 |
| Canada | 192 |
| Argentina | 191 |
| Belgium, South | 191 |
| Australia, Sydney | 189 |
| Ireland | 189 |
| Germany | 183 |
| France | 179 |
| Portugal | 169 |
| Finland | 161 |
| Denmark | 159 |
| Netherlands | 157 |
| Belgium, North | 153 |
| Norway | 150 |
| Brazil, Rio de Janeiro | 146 |
| Sweden | 140 |
* Note: All times in minutes.
Source: Eurodata TV, 1996
Table 2.22 1996 Asian viewing*
| Japan | 4.0 |
| India | 4.0 |
| Indonesia | 3.7 |
| Philippines | 3.5 |
| Singapore | 2.4 |
| Malaysia | 2.2 |
| South Korea | 2.2 |
| Taiwan | 2.0 |
Note * All times in hours per household.
Source: Survey Research Group, Singapore, 1997
Despite these regional differences, the trends are quite clear. Cable and satellite viewing is fast-developing, rapidly changing the way television is watched in most countries. In Taiwan, cable and satellite reach three TV homes out of four (and some four million subscribe to STAR TV, a DTH multi-channel bouquet). while subscriptions to new satellite channels are increasing in some key markets, it may be that the notoriously hard-working Asian communities have yet to adopt western ‘couch-potato’ habits.
Table 2.23 1996 Asian multi-channel penetration
| China | 49.0 m |
| Hong Kong | 0.4 m |
| India | 22.0 m |
| Japan | 10.8 m |
| Philippines | 0.6 m |
| Singapore | 0.07 m |
| Taiwan | 3.5 m |
| Malaysia | 0.2 m |
Data: Cable World, 1997; Industry sources
Japan’s analogue national networks have been protected and cosseted from external competition. Despite the growing number of analogue satellite channels, penetration from the new breed of multi-channels amounted to only 1.1 per cent viewing share in 1996 (Eurodata) and to no more than 3 per cent by the end of 1997, predicted to rise to 11 per cent by 2010. Satellite/cable television achieved penetration of 32.2 per cent at December 1996 and digital satellite/cable is expected to reach 85 per cent penetration by 2010.
Five network channels (all Tokyo-based) take 89 per cent share of Japan’s television advertising revenue, leading to high profitability for the NHK, NTV and Fuji TV systems. However, Japan’s Ministry of Posts and Telecommunications (which is also Japan’s TV licensing authority) predicts that by 2010 the established networks will see their viewing share decline to 67 per cent. Even more damaging, the ministry predicts that terrestrial network’s share of a more than doubled advertising cake will only grow 1.6 times in the period to 2010. In contrast, the ministry believes digital cable television revenues could expand more than six-fold, and satellite more than seven-fold, by 2010.
* Note: ‘Public’ here means free-to-air network channels, including licence fee-supported national channels as well as nationally-available private channels.