
We noticed that in App1 and App2, there are two build targets in each project—namely debug and release. In this section we'll learn more about it.
Code::Blocks defines two default build targets—debug and release at the time of a project creation.
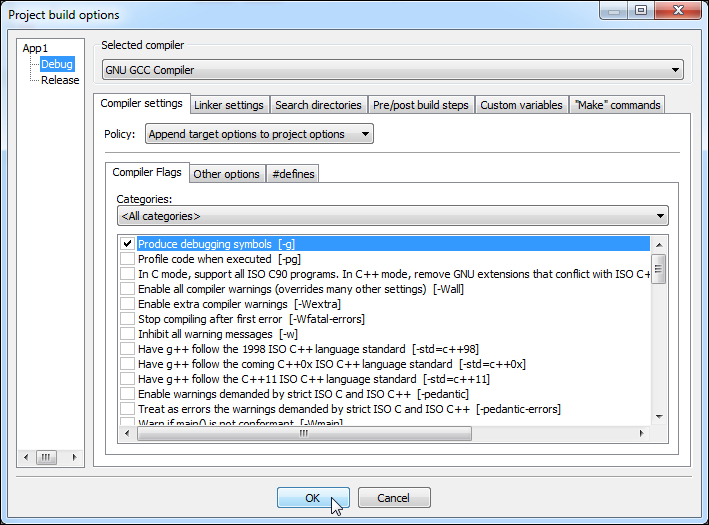
As the name suggests a debug target is suitable for app debugging. Appropriate compiler options are added to generate debugging symbols in the compiled app. It also disables all program optimizations.
We can find in the following screenshot (navigate to Project | Build options… menu option) a Debug target has a compiler option Produce debugging symbols. This instructs compiler to generate debugging symbols, which allows app debugging:
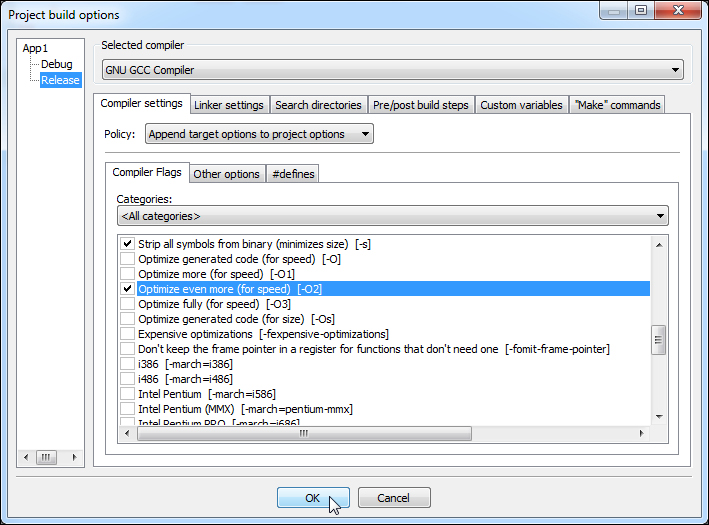
A Release target disables generation of debugging symbols. It also defines appropriate compiler options to optimize the program. Thus this is suitable for code to be used in production. The following screenshot shows typical compiler flags in a release target.
These two targets are quite important as it is difficult to debug a program that has been compiled with compiler optimization flags enabled. It is highly recommended that the program is compiled without optimization in debug target.
To understand this problem we'll use the following code snippet, then compile and debug it. Note that we will use command-line tools to avoid abstraction of any error message by Code::Blocks UI:
#include <iostream>

int add (int a, int b) {
    return (a + b);
}

int main() {
    std::cout << "2 + 3 = " << add(2, 3) << std::endl;
    return 0;
}
Let's now compile it in debug mode:
g++ -o app4.exe –g main.cpp
We'll use GNU debugger gdb to debug and understand the flow of execution. Launch gdb and follow the steps:
gdb --quiet app4.exe
Reading symbols from Z:app4.exe...done.
(gdb) b main.cpp:4
Breakpoint 1 at 0x401945: file main.cpp, line 4.
(gdb) b main.cpp:9
Breakpoint 2 at 0x4019ae: file main.cpp, line 9.
(gdb) r
Starting program: Z:app4.exe
[New Thread 6036.0x6ac]

Breakpoint 1, add (a=2, b=3) at main.cpp:4
4      return (a + b);
(gdb) c
Continuing.
2 + 3 = 5

Breakpoint 2, _fu0___ZSt4cout () at main.cpp:9
9      return 0;
(gdb) c
Continuing.
[Inferior 1 (process 6036) exited normally]
We asked gdb to load app4.exe in memory. Then we asked gdb to set two breakpoints by issuing command b and specifying the line number. We asked gdb to run the program. As instructed by breakpoints the execution is paused at each breakpoint. Subsequently the program completes without any error.
Let's see what happens when we turn optimizations on. We'll compile it as:
g++ -o app4.exe –g –O2 main.cpp
Now debug this app again following earlier steps:
gdb --quiet app4.exe
Reading symbols from Z:app4.exe...done.
(gdb) b main.cpp:4
Breakpoint 1 at 0x401574: file main.cpp, line 4.
(gdb) b main.cpp:9
Breakpoint 2 at 0x402883: main.cpp:9. (2 locations)
(gdb) r
Starting program: Z:app4.exe
[New Thread 6084.0x1270]

Breakpoint 2, _GLOBAL__sub_I__Z3addii () at main.cpp:10
10   }
(gdb) c
Continuing.
2 + 3 = 5

Breakpoint 2, _fu0___ZSt4cout () at main.cpp:10
10   }
(gdb) c
Continuing.
[Inferior 1 (process 6084) exited normally]
It is evident from the preceding output that compiler has optimized our source code and made a number of changes to the code. The function add() seems to have been expanded inline. As a result breakpoint on line return (a + b) of main.cpp file is never hit during execution.
This is one of the side effects of optimization on debugging process. Code::Blocks creates two default targets to avoid similar situation. It is highly recommended that this is followed in project development.