
7 Information technology
The building management system provides an important source of information, which may be exported to other applications. Building performance and energy consumption are analysed by energy monitoring and targeting software, to assist in effective energy management. Information from the BMS is employed as part of facilities management, including the administration of planned maintenance.
7.1 Energy monitoring
A major justification for the installation of a BMS is the prevention of energy waste. Correct and efficient control of HVAC plant will itself contribute to efficient use of energy but in addition it is necessary that the energy manager receive accurate and up-to-date information on energy use in the buildings for which he is responsible. The approach generally adopted in the UK is termed energy monitoring and targeting (M&T), which is vigorously promoted by the DETR. The term monitoring and targeting does not in itself imply the use of a BMS or indeed any hardware for data collection and analysis. M&T requires that data on energy consumption be regularly collected, summarised and compared with target consumption figures. Computerised collection and analysis of data makes M&T a powerful tool for the control and reduction of energy consumption(1).
7.1.1 Monitoring and targeting
M&T has two major functions:
— the control of current energy use, by monitoring consumption and comparing it against historical data and benchmarks for similar buildings
— improvements in the efficiency of energy use by the setting of future targets.
In large buildings or complexes, effective energy management requires that areas of accountability be established, termed energy account centres (EAC). Accountability implies both responsibility for the energy consumed and the authority to control the consumption. The energy consumption of an EAC should be
— measurable
— manageable
— reconcilable against a measured activity.
An EAC could be a department, an energy intensive production process, a sublet part of a building or an individual building on a site. A standard energy performance is initially established for each EAC, which relates energy consumption to appropriate variables, such as degree-days or production output. The standard performance provides a benchmark against which energy consumption may be compared, prior to the setting of targets for future improvements. The targets must be realistic and achievable and agreed with the managers responsible for each EAC. BRECSU have published a number of Energy Consumption Guides, e.g. Guide 19(2), and consumption data for a wide range of non-domestic buildings is summarised by Jones and Cheshire(3). Additional information is to be found in CIBSE Applications Manual AM5(4).
The monitoring part of the M&T process involves four stages:
(1) Data collection. Energy consumption data is collected. A comprehensive system will include electricity, gas and water meters located in each EAC, capable of sending data to a central collection point. The availability of other relevant data must be taken into account, e.g. degree-day data or production figures.
(2) Data analysis. The data received by the computer is checked for errors and then stored in a form suitable for further analysis. Data analysis is carried out according to the needs of the system; this is likely to include weekly and monthly totals. Any results which indicate a problem or malfunction should generate an immediate warning.
(3) Reporting. Management reports produced by the system which show the energy consumption of each EAC compared with targets.
(4) Action. It is essential that a management structure exists to make effective use of the reports generated by the M&T system.
For an M&T system to be effective, all four stages must be implemented. The collection of data, however accurate, which is not looked at and which prompts no action serves no purpose. Effective M&T requires full management support. As a rule-of-thumb, M&T may be expected to reduce energy bill by about 5%; larger savings are possible where equipment malfunction or gross control failures are identified as the result of metering information. This figure allows an appropriate level of M&T to be chosen in relation to the total energy bill. Energy management systems share many of the characteristics of a BMS. In a building the system installed for energy monitoring and targeting may share hardware with the BMS and may be operated from the same terminal by the same staff. However, the they are not the same. The BMS provides real-time control of the building services, while the M&T system is concerned with data collection and historical analysis.
7.1.2 Planning an M&T system
Energy M&T may be instituted at a simple level, using invoices or manual meter readings and simple manual or spreadsheet analysis. The major factors to be taken into account at an early stage are summarised below. The most important is the total energy bill to be monitored, since it is the potential savings on this bill that fund the M&T system. M&T systems may be classified according to their level of coverage and sophistication.
7.1.2.1 Level of coverage
— Single site, utility based. The site is treated as a single EAC and monitored using only utility meters and invoices. Here, a site implies a building or group of buildings served by a single utility meter. It may be possible to aggregate physically separate buildings into a single site for supply and metering purposes.
— Single site with submeters. Energy is monitored for each of the EACs within a single site by means of submetering.
— Multi-site, utility based. A number of sites are monitored using the main utility meters. Each site is treated as a single EAC.
— Multi-site with submeters. Several sites, each of which is subdivided into EACs and submetered.
7.1.2.2 Level of sophistication
— Manual system. Meters are read manually and tabulated on paper.
— Keyboard input system. Meters are read individually, and readings recorded by hand or by a data capture unit. Readings are then entered into a computer for analysis.
— Automatic input system. The meters are connected via data loggers or other system to the computer and energy consumption is collected and monitored automatically.
— Advanced system. Implies more sophisticated data handling, combining energy data with data from other systems or sites. May include automatic control or provide warning messages. Sophisticated bureau services are available using neural network analysis of consumption data to detect energy waste, coupled with an expert system to identify causes.
7.1.2.3 Choice of system
It is important not to choose an oversophisticated system. Not only will such a system cost more to install, but it will demand staff time to maintain it in an operational state and to take action on the results. If the requisite support is not available the system will not fulfil any purpose. The following points should be considered at an early stage in the planning:
— Cost effectiveness. Any proposed system will be required to meet the organisation's criteria for return on investment. The cost of a system is sensitive to the number of meters installed. Not only does this affect the installed cost, but the analysis, reporting and storage of the increased amount of data will add to the running costs. The rule-of-thumb that M&T should save 5% of energy costs may be used to provide indication of a viable level of investment.
— Number of meters. Each EAC requires its own meters. Electricity meters will always be required, together with gas meters where appropriate. Water meters are recommended, particularly if there are any water intensive processes. Further submetering may be desirable for particular processes or equipment. The consumption of some areas may be calculated using the concept of a virtual meter, i.e. the difference between a main and submeter.
— Monitoring period. This is the period between meter readings. For a fully automated system this should be half-hourly. The use of time-of-day electricity pricing is spreading from large customers to smaller or even domestic customers and half-hourly information will be necessary when considering the optimum policy for electricity tariffs. The additional information given by half-hourly metering is useful for diagnostic purposes, helping to identify reasons for anomalous consumption.
— Reporting. The M&T system should produce regular standardised reports, showing performance against target. Weekly and monthly periods are commonplace. There is no point in producing reports more frequently than they will be read. It is important that the information is usable by the intended audience of the report. Ideally management reports should highlight any avoidable waste and define responsibility for improvement.
— Management organisation. Figure 7.1(5) shows how M&T operates within the management structure. Each EAC requires a manager responsible for energy performance within the centre, and who will receive routine reports. It is essential that sufficient staff are trained in the operation of the system and a minimum of two staff should be able to operate it. If this is not practicable, the use of a bureau service should be considered. Metered data is read remotely via modem or the Internet and the bureau produces the required analysis, reporting and billing as required.
Figure 7.1 Monitoring and targeting management structure

7.1.2.4 Electricity Tariff
The choice of electricity tariff has its own relevance to the design of a M&T system. Since 1994, customers with a total demand of over 100 kW have been able to negotiate a supply from any electricity supplier; the freedom has since been extended to all customers. The type of tariff negotiated will have a bearing on the design of submetering and the energy management system. The major factors to be considered are:
— aggregation of sites
— choice of tariff.
It may be advantageous to group separate buildings or sites together so that they are supplied as a single unit through one main meter. The Office of Gas and Electricity Markets (OFGEM) has set out requirements for the main meter. It must comply with the Pooling Settlement Agreement document known as Code of Practice 5 and it must be maintained by an approved meter operator. The meter must record all units used each half hour and transmit the stored readings once per day to the UK Data Collection Service, which then passes the information on to the interested parties. The readings will normally be made available to the building operator. Users with a demand of less than 100 kW may continue to use a conventional meter.
The customer may install further meters downstream of the main meter; this is known as secondary metering or submetering. Secondary metering is installed for:
— tenant billing
— cost centre accounting
— energy management.
Secondary metering is not constrained by the same level of regulation as primary metering, though any meter used for tenant billing has to be OFFER approved.
With the growth in the number of competing electricity suppliers, there are several types of tariff available. The major classifications are:
— Two-rate. Separate rates are charged for day and night.
— Six-rate STOD. The unit rate varies by season and time of day.
— Disaggregated. This identifies the components of electricity use which contribute to the total charge, e.g. energy used, maximum demand, power factor.
— Pool pricing. The unit charge is based on the half-hourly spot price of electricity.
— Tariffs requiring the measurement of reactive power. These are mostly found in industry.
It is outside the scope of this guide to deal with the choice of tariffs. The price of electricity in the pool can vary substantially from half hour to half hour and pool pricing is only suitable for large users where the necessary active management of load can be supported. A disaggregated tariff will be suitable for sites where demand can be managed to reduce costs; this is likely to be true where there are energy intensive processes that can be controlled to contain the maximum demand. The tariff chosen will affect the level of submetering and type of energy management. Half-hourly metering is almost always worthwhile as detailed demand patterns can assist in the identification of problems or identification of excessive electricity consumption. Management of a disaggregated tariff requires information on maximum demand available in real time with some form of warning to enable action to be taken.
7.1.3 Metering equipment
Energy metering hardware in an energy management system consists of some or all of the following components:
— meter module, which measures the desired quantity and converts the value to an electrical output, typically pulses
— display module, which displays the present value of the rate of energy consumption, plus other derived quantities
— data logger, which accepts pulses from the meter, processes and stores data on energy consumption and transmits data on demand to the central computer containing the M&T software
— data transmission system, connecting one or more data loggers to the central computer
— computer, containing the analysis software.
Meter module
An electric meter module (Figure 7.2) requires simultaneous inputs of current and voltage. In a whole current meter, the entire current is wired to pass though the meter. They are suitable for single-phase applications, up to a current of about 80 A. Otherwise, a current transformer (CT) is used which is fitted around each phase conductor. Standard ring type CTs require the cable to be isolated and disconnected for installation, while split core CTs can be installed without disturbance. Clamp-on CTs are used for temporary connections with portable equipment. The secondary current output of the CT is measured by a low impedance meter; the resistance of the connection between CT and meter must be kept low or an appreciable error may be introduced. Simultaneous measurement of voltage and current is required to give an accurate measurement of power consumption, and is essential for the calculation of kW, kVA, kVAr and power factor. The harmonic content and reactive component of many modern electrical loads can give rise to substantial measurement errors if current only metering is used. However, on sites where the power factor is high and the voltage stable it may be sufficient to employ only a current connection to the meter. Where the aim of energy management is the partition of energy consumption between EACs and the detection of excess consumption, this will normally be sufficient.
Most meters provide a pulsed output in the form of voltage-free contact closures. This is true for gas, water and other meters as well as electricity meters. A defined pulse, typically about 100 ms in duration, is provided each time the meter records an equal increment of energy consumption. The scaling is chosen to give a pulse frequency of around 1 Hz at maximum power. It is possible to fit optical meter readers to existing utility meters without any disturbance to their connections. The reader employs a photoelectric device to detect the rotation of the meter disc or dial needle and provides an output pulse which may be handled in the same way as a conventional pulse output.
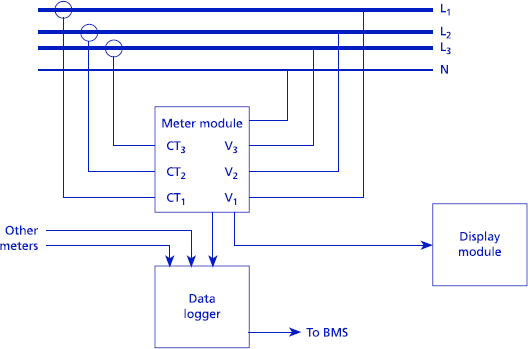
Figure 7.2 Components of an automatic electricity meter
For most purposes it is sufficient to measure kWh alone. Where more detail is required, a dual meter module measuring kVA and kVAr may be employed. From these quantities kWh, power factor and maximum demand may be derived. It is unlikely that automatic logging of any other electrical parameters will be required unless there are concerns over the quality of supply. If necessary, a portable power analyser may be used to give detailed measurements of power quality. The measurement and display on instantaneous power (kW) can be useful for diagnostic purposes, such as identifying loads in the building and tracking down any ‘hidden loads’.
Display module
The meter may incorporate a display or be connected to a local display module. At its simplest, this shows a real-time display of the rate of energy consumption, e.g. kW. More complex displays can select kVA, kVAr and have sufficient memory to show maximum demand and cumulative energy consumption.
Data logger
The output pulses from the meter are summed in a data logger module. This will typically have several input channels for different meters. The data logger may be part of a separate energy management system. Alternatively, where the energy management system is an integral part of the main BMS, intelligent BMS outstations are able to accept pulsed inputs for energy measurement purposes (Figure 7.3). The pulses are counted, scaled and stored to give values of energy consumption per half hour for each channel. There must be a real-time connection between the meter and the data logger. Hardwiring is the most common, being simple and reliable. Where the meters are dispersed over a large site, it is possible to use a radio link between the meters and logger. Where the energy management system is separate from the BMS, it may be advisable for the EMS data logger to accept temperature inputs. This makes possible analysis of energy consumption as a function of temperature without any additional data from sources outside the system. Meters are available with built-in communications systems such as RS 485, typically using the MODBUS communications protocol. This is preferred to pulsed output where it is required to measure variables other than simple kW h.

Figure 7.3 Incorporation of metering into a BMS
Computer
The central computer receives and processes the metered data. The computer may be a separate machine dedicated to M&T or the software may reside in the main BMS supervisor. Where a bureau service is used, the computer is situated off site and communicates via modem or Internet. The software can carry out some or all of the following functions:
— retrieval, checking and collation of metered data
— acceptance of data from other sources
— instant access on demand to data from individual meters
— review of data in flexible format, allowing comparison between different time periods and meter locations
— display of additional electrical data such as power factor, frequency, reactive power
— comprehensive input of tariff definitions
— automatic production of sub-billing
— automatic production of routine reports
— immediate warning of exceptions, such as parameters exceeding preset limits
— historical analysis of energy consumptions, e.g. regression or cusum.
7.1.4 Data analysis and reporting
For a simple system it may be sufficient to use a spreadsheet for data analysis. However, once there are several meters with half-hourly energy readings, it will almost certainly be better to employ a commercial software package for analysis.
7.1.4.1 Data input
The analysis software can only operate properly given a complete set of accurate data. During commissioning of the system, it is important to check that each meter channel is correctly identified and that all scaling factors have been correctly set. During routine operation, the software can be set to carry out routine checks on the incoming data:
— Is the data within preset limits?
— Is any data missing?
— Is the new reading higher than the previous reading?
Invalid readings should be flagged for the operator's attention. If the analysis proceeds with dubious input data, the subsequent reports should be so annotated. Subsequent energy analysis may involve data from other sources, such as degree-days or production figures. This data has to be provided reliably and in a form which is compatible with the metered data, e.g. the periods over which production output and energy consumption are measured must coincide. At some stage the measured energy consumptions should be compared with the fuel invoices. Where an M&T system is installed in an existing building, it is desirable to input historical consumption data to provide a basis for comparison. It may be difficult to provide data in a suitable format to match the new EAC organisation.
7.1.4.2 Routine analysis
The analysis package will be programmed to produce routine analysis every reporting period. The type of analysis will be tailored to individual needs:
— attribution of energy costs to each EAC, including tenant billing
— comparison of energy consumption with target figures.
In addition, further analysis can be undertaken which will be used in reviewing performance and setting future targets. Energy consumption often shows a simple linear relationship with an independent variable such as degree-days or production. A linear regression analysis establishes the slope of the line and intercept on the consumption axis. This can be used to estimate base consumption such as hot water loads, which do not vary with external temperature (see Figure 7.4). Once a historical regression has been established, any new point which falls off the regression line demands attention. A degree-day regression is subject to a scatter of around 10%; the analysis may be improved by refining the choice of base temperature used in compiling the degree-day figures.

Figure 7.4 Linear regression of energy consumption against monthly degree days, showing the summer base load(4)
CUSUM
The CUSUM technique(6) compares actual performance with target performance for each measurement period and displays cumulative savings. It is necessary to be able to calculate a target consumption for each analysis period; this may be a function of other variables, such as outside temperature. By calculating the cumulative sum of the differences from the target, a trend line can be plotted that gives a clear indication of performance and changes in performance. The value of the cusum gives total saving to date and the slope gives the performance trend. A change in performance of the building system will be shown by a change in slope (see Figure 7.5).

Figure 7.5 Example of a CUSUM plot showing cumulative energy savings(7)
7.2 Fault reports and maintenance scheduling
The BMS can be used to provide information on the total run time and condition of HVAC components, which can be integrated into maintenance operations. Ideally, a maintenance policy should be decided for each component of the HVAC system, taking into account risk, technical and cost issues. Five maintenance categories may be classified:
— run to fail
— install redundant units
— preventive maintenance program
— condition-based maintenance
— redesign to reduce maintenance.
The appropriate maintenance policy for each component can be chosen on the basis of the decision tree shown in Figure 7.6.
Preventive maintenance tasks are carried out either at regular calendar intervals or at intervals based on equipment run time. Preventive maintenance ranges from simple lubrication to complete tear down and rebuild of equipment. Selection of the maintenance period is of great economic significance and is usually based on manufacturers’ recommendations. Planned maintenance software is available which is used to:
— catalogue maintenance tasks for various plant items
— generate and manage work orders
— manage inventory for spare parts
— store maintenance history
— generate management reports.

Figure 7.6 Selection of maintenance strategy
The BMS is used to provide information on equipment runtime, which is fed directly to the planned maintenance program.
Condition-based maintenance
In some situations it is possible to monitor the condition of an item of plant. This provides valuable information on system performance and reliability and can detect early signs of trouble in an item of plant, allowing maintenance to be carried out before the plant progresses to failure or when it begins to operate with reduced efficiency. This technique will normally provide greater intervals between maintenance than preventive maintenance carried out at fixed intervals. The economic justification is based on the relation between the increased cost of CBM balanced against the saving from increased maintenance periods.
CBM encompasses a set of techniques used to monitor plant condition. Some may be carried out automatically via the BMS; others require a physical inspection or measurement. Examples of direct monitoring include:
— Pressure drop across filters. This indicates when they need to be changed. The analysis algorithm will depend on whether the system is constant or variable flow.
— Efficiency of heat exchangers. This may be monitored by measuring temperatures and flows, and so detect degradation of performance caused by fouling.
— Operating variables. A selection of plant variables, such as temperature and pressure, is logged. A long term change in operating conditions may indicate degradation in the equipment.
Other monitoring techniques are not yet suitable for integration into the BMS, though this may become possible in special situations:
— Vibration analysis. Used to detect wear in rotating machinery.
— Infra-red thermography. Can detect high resistance connections in electrical equipment, high friction in rotating machinery and failing thermal insulation.
— Analysis of lubricants. Used to detect wear of gears and other mechanical parts.
— Motor current analysis. Used in large electrical motors (> 20 kW).
7.3 Summary
The building management system can be used to support energy management and targeting by measuring components of energy consumption and exporting the data to a EM&T applications package. The use of EM&T can save 5% of energy costs; this yardstick may be used to support decisions on the level of investment in metering. Secondary meters may be used for tenant billing as well as energy management. Monitoring via the BMS may be used to support maintenance management. Information on plant run times and condition monitoring is fed into a planned maintenance program which produces maintenance schedules.
References
1 ETSU Computer-aided monitoring and targeting for industry Good Practice Guide 31 (Harwell: ETSU) (1991)
2 BRECSU Energy use in offices Energy Consumption Guide 19. (Watford: Building Research Energy Conservation Support Unit) (1998)
3 Jones P G and Cheshire D Bulk data for benchmarking non-domestic building energy consumption CIBSE/ASHRAE Joint National Conference, Harrogate: 29 Sep–1 Oct 1996 1. 203-213 (London: Chartered Institution of Building Services Engineers) (1996)
4 CIBSE Energy audits and surveys Applications manual AM5 (London: Chartered Institution of Building Services Engineers) (1991)
5 Energy efficiency in buildings CIBSE Guide F (London: Chartered Institution of Building Services Engineers) (1998)
6 Harris P Energy monitoring and target setting using CUSUM (Cheriton: Technology Publications) (1989)
7 Degree days Fuel Efficiency Booklet No. 7 (London: Department of the Environment, Transport and Regions) (1993)