
3
From Cellular Mechanisms to Physiological Responses: Functional Signal Integration Across Multiple Biological Levels
Robert H. Newman
Department of Biology, North Carolina A&T State University, Greensboro, NC, USA
3.1 Introduction
The environmental and nutritional landscapes encountered by organisms are in constant flux. To survive in such an environment, organisms must continuously sense changes in their surroundings and mount a coordinated functional response that spans several levels of biological organization, including the cellular level, the tissue level, and the organismal level. Failure to properly integrate functional responses at any of these levels – due to mutation and/or disruption of endogenous signaling processes by pharmacological/toxicological agents – underlies pathological disorders such as diabetes, cancer, and cardiovascular disease. In the previous chapter, we examined the molecular properties of key signaling molecules, including receptors, signaling enzymes, and small molecule second messengers. We then discussed some of the ways in which select signaling molecules can be organized into discrete signaling modules inside the cell. In this chapter, we will build on this discussion by exploring specific mechanisms by which cellular signaling modules – and, ultimately, the larger signaling networks of which they are a part – convert environmental cues into integrated functional responses. While our discussion will focus primarily on signal integration at the cellular level, we will also touch on some of the ways in which signaling processes can be further coordinated at both the tissue and the organismal levels. Our discussion will be centered on three fundamental questions: (i) how do individual cells sense and respond to changes in their environment (i.e. cellular information processing); (ii) how are individual signaling modules and, by extension, cellular signaling networks regulated in cellular time and space; and (iii) why do different cell types respond differently to the same signal? To help illustrate these concepts, we will examine the mechanisms by which various types of cells respond to elevations in blood glucose and how these responses are integrated across multiple tissues and organs to elicit a coordinated, systemic response. In this context, we will also discuss how dysregulation of these mechanisms contributes to the etiology of type 2 diabetes mellitus (T2D) and its complications.
3.2 Cellular Information Flow: Mechanisms of Cellular Signal Integration and Regulation
As discussed in Chapter 2, cells contain a diverse set of signaling molecules that collectively regulate nearly all aspects of cellular physiology. Therefore, to better understand how cells sense and respond to different environmental cues, we must first understand how the activities of these signaling molecules are modulated under various cellular conditions. Moreover, we must understand how changes in these activities lead to a specific functional response. Traditionally, researchers have taken a reductionist approach to the study of cellular signal transduction. These studies, which often focus on the behavior of a purified signaling enzyme (or a set of signaling enzymes and/or their cofactors) in vitro, have offered important insights into the molecular mechanisms underlying the regulation of key players within many cellular signaling pathways. For example, focused biochemical and structural analyses of the cyclic adenosine monophosphate (AMP)‐dependent protein kinase, PKA, and other kinase family members have uncovered exquisite details about the molecular architecture of the kinase domain and its dynamic reorganization following activation [1]. Similarly, careful kinetic analyses have helped characterize each step in the activation cycle of small G‐proteins and how these steps are regulated by their respective guanine nucleotide exchange factors (GEFs) and GTPase‐accelerating proteins (GAPs) [2, 3]. However, despite the great strides that have been made in understanding the biochemical regulation of cellular signaling enzymes, it is clear that biochemical regulation alone cannot explain the diverse set of signaling activities and the exquisite specificity characteristic of cellular signal transduction. This is because, in addition to biochemical regulation, there exists another level of “contextual” control that plays an important role in cellular information flow. This level of control is dependent on many factors, including the relative levels of various signaling enzymes, their subcellular distribution, and their activity profiles which, in turn, are a function of the activity of their endogenous regulatory factors [4]. Therefore, to understand how information is processed within the cell, it is important not only to consider how individual signaling enzymes function in isolation but also to understand how they are regulated in the context of their endogenous signaling pathways. Indeed, in many cases, it is the complex, systems‐level behaviors of many signaling molecules acting in concert that lead to a given functional response. To illustrate this notion, we will begin with a relatively simple model describing the linear, unidirectional flow of information from the extracellular environment to the nucleus via a canonical signaling pathway. Specifically, we will examine how changes in extracellular insulin levels are sensed by the insulin receptor (InsR) in hepatocytes and how this information is transmitted through atypical PKC (aPKC) family members and other intracellular signaling molecules to drive changes in nuclear factor kappa B (NF‐κB)‐dependent gene expression. To better understand how signaling processes are coordinated inside the cell, we will then layer in additional levels of regulation that more accurately represent the cellular context in which these signaling processes actually occur. However, even as the number of interactions grows and the complexity of the system increases, it is important to remember that each additional node still involves a series of simple steps (e.g. protein–protein interactions, posttranslational modification, translocation, transcriptional activation, etc.) that together lead to the emergence of the observed systems‐level properties.
3.2.1 The InsR‐aPKC‐NF‐κB Signaling Axis
In the fed state, increases in blood glucose levels stimulate the release of the hormone insulin from pancreatic beta cells into the bloodstream. Circulating insulin is distributed throughout the body to various tissues, including hepatocytes, where it binds dimeric InsR molecules located on the surface of target cells (Figure 3.1). Association of insulin with the extracellular ectodomain of the InsR induces conformational changes in the receptor that lead to activation of its intracellular tyrosine kinase (TK) domain (Figure 3.2, step 1) [5, 6]. Receptor activation promotes autophosphorylation of Tyr residues within the TK domain, which in turn facilitate the binding of adaptor proteins, such as the insulin receptor substrate (IRS) isoforms, IRS‐1 and IRS‐2, via their phosphotyrosine binding (PTB) domains (step 2). In hepatocytes, both IRS isoforms are expressed at appreciable levels, but, as we will see, each isoform is involved in regulating distinct aspects of the insulin response [7]. Here, we will first focus on IRS‐2 since it is the predominant isoform involved in the regulation of signaling by aPKC family members (which include PKCι, PKCλ, and PKCζ in hepatocytes [7, 8].

Figure 3.1Insulin‐responsive cells. In response to elevated blood glucose levels, insulin is secreted from pancreatic β‐cells and distributed to various insulin‐sensitive cells, including pancreatic α‐cells, skeletal muscle cells (myocytes), liver (hepatocytes), and adipose tissue (adipocytes). Insulin‐responsive cells express the insulin receptor on their cell surface.

Figure 3.2The InsR‐aPKC‐NF‐κB signaling axis in hepatocytes. In the liver, binding of insulin to dimeric insulin receptors (InsR) on the cell surface initiates several intracellular signaling pathways, including insulin receptor substrate 2 (IRS‐2)/atypical protein kinase C (aPKC)‐mediated activation of the transcription factor, nuclear factor kappa b (NF‐κB), and subsequent expression of NF‐κB‐dependent genes, such as inhibitor of kappa B (IκB), and the pro‐inflammatory cytokines, interleukin 1 beta (IL‐1β) and tumor necrosis factor alpha (TNF‐α). See text for details. trans‐phosphorylation (P) reactions are depicted as starbursts. Abbreviations: TK, tyrosine kinase; PI3K, phosphoinositide 3‐kinase; PDK1, phosphoinositide‐dependent kinase 1; PH, pleckstrin homology domain; IκB, inhibitor of NF‐κB; IKK, IκB kinase; NLS, nuclear localization signal; p52, NF‐κB p52 subunit; RelA, v‐rel avian reticuloendotheliosis viral oncogene homolog A; TAD, transactivation domain; Ub, ubiquitin; SCFβ‐TrCP, Skip‐Cullin‐F‐box Ub E3 ligase with the β‐TrCP substrate binding subunit; E1, Ub ligase enzyme 1; E2, Ub ligase enzyme 2; NPC, nuclear pore complex; TFII, general transcription factor II complex; RNAP, RNA polymerase.
Once bound to the phosphorylated InsR, IRS‐2 is then phosphorylated on conserved tyrosine residues by the receptor’s kinase domain, creating binding sites for Src homology domain 2 (SH2)‐containing effector proteins, such as phosphoinositide‐3‐kinase (PI3K) (step 3). PI3K catalyzes the conversion of the membrane phospholipid, phosphoinositide (4,5)‐bisphosphate (PIP2), to phosphoinositide (3,4,5)‐trisphosphate (PIP3), leading to the recruitment of pleckstrin homology (PH) domain‐containing proteins, such as phosphoinositide‐dependent protein kinase 1 (PDK1) and Akt, to the membrane (step 4). PDK1, which phosphorylates several members of the PKA‐PKG‐PKC (AGC) family of serine/threonine kinases on a conserved threonine residue on the activation loop located within the kinase active site, functions as a central regulator of AGC kinase activity in the cell. As we will see later, PDK1 also phosphorylates several other important AGC family members involved in insulin‐dependent signaling (including Akt). For simplicity, we will initially focus only on the impact of PDK1‐mediated phosphorylation of aPKC as it relates to NF‐κB‐dependent transcriptional regulation (step 5).
Once activated by PDK1, aPKC catalyzes the phosphorylation of the beta subunit of the inhibitor of NF‐κB kinase (IKKβ) on Ser177 and Ser181 (step 6) [9]. IKKβ, which is part of a heterotrimeric complex composed of IKKα, IKKβ, and a regulatory subunit known as NF‐κB essential modulator (NEMO), then phosphorylates the alpha isoform of the inhibitor of NF‐κB (IκBα) on Ser32 and Ser36 (step 7) [10]. These residues are part of a phosphorylation‐dependent destruction motif (i.e. a phosphodegron) that is recognized by a member of the Skip1‐Cullin‐F‐box (SCF) family of ubiquitin E3 ligase complexes. In the case of phosphorylated IκBα, the SCF complex is recruited to the site of ubiquitination via interactions between pSer32 and pSer36 on IκBα and the WW phosphoamino acid binding domain (PAABD) of the SCF complex's β‐TrCP substrate binding subunit (step 8) [11, 12]. The formation of K48‐linked polyubiquitin chains by SCFβ‐TrCP marks IκBα for degradation by the proteasome (steps 9–10). This is important because, prior to its degradation, interactions between IκBα and NF‐κB mask NF‐κB's nuclear localization sequence (NLS), thereby sequestering NF‐κB in the cytoplasm away from its target sites in the nucleus. Once released from IκB, NF‐κB translocates into the nucleus where it binds NF‐κB response elements and drives expression of target genes, such as the cytokines interleukin 1B (IL‐1B) and tumor necrosis factor alpha (TNF‐α) (step 11) [13].
3.2.2 Modes of Regulation in InsR‐PKC‐NF‐κB Signaling Axis
The signaling pathway described above illustrates some of the ways in which cellular signaling molecules must work together to convert information about changes in the extracellular environment (i.e. an increase in circulating insulin) into a functional intracellular response (i.e. changes in gene expression). However, such linear models of cellular information flow do not adequately capture many important aspects of cellular signal transduction, including negative or positive feedback regulation. For instance, the model described above does not account for potential differences in the expression levels of different NF‐κB‐regulated genes. Likewise, it does not describe how attenuation of the signal occurs when insulin levels decrease, let alone how graded or oscillatory responses can be achieved. Therefore, to better understand how these events occur and how they modulate information flow inside the cell, we must examine how various steps in the pathway are regulated. For illustrative purposes, we will begin at the transcriptional level and work our way “back up” the signaling pathway to InsR regulation. However, it is important to remember that, at any given time, many (if not all) of the regulatory steps that we discuss could be occurring to varying extents within the cellular environment to produce a dynamic, integrated response.
3.2.3 Transcriptional Regulation
When considering the extent to which the expression of a particular target gene is regulated by its cognate transcription factor (TF), several parameters must be taken into account. For example, we must consider (i) the rate of induction, (ii) the duration of functional promoter‐bound complexes, and (iii) the relative stability of the mRNA products [13, 14]. The first of these, the rate of induction, is a function of several parameters intrinsic to chromosomal structure, including (i) promoter architecture (e.g. the number of response elements and their distribution relative to each other and to the transcriptional start site), (ii) the accessibility of the promoter (e.g. due to the chromatin state), and (iii) the presence or absence of co‐regulatory TFs and/or DNA‐binding proteins at nearby sites. For example, over 400 NF‐κB target genes have been identified in humans [15]. These can be divided into three groups based on their expression profiles, with “early” genes showing maximal expression approximately one hour after NF‐κB activation followed by “middle” genes (approximately three hours) and “late” genes (approximately six hours) [14]. Bioinformatics analysis of the promoter regions demonstrated that genes in the early group contained a substantially higher density of NF‐κB binding sites than those in the middle and late groups. Both the number of sites and their proximity to one another are greater in the early group (Figure 3.3a) [16]. This suggests that clustering TF binding sites near the transcriptional start site of genes in the early group enhances the recruitment of activated NF‐κB to their promoters compared with genes in the late group. These contain fewer NF‐κB binding sites arranged in a more dispersed manner [16]. Indeed, clustering of TF binding sites appears to be a general mechanism of regulation employed by eukaryotic TFs, which typically exhibit weaker affinity for their sites than prokaryotic TFs [17].

Figure 3.3Genetic elements affecting gene expression profiles. (a) Genes that are expressed in the early group (i.e. maximal expression approximately one hour after stimulation) tend to be located in euchromatic regions and contain a relatively high density of (1) NF‐κB binding sites in their promoters and (2) AU‐rich elements (AREs) in their 3′‐untranslated regions (3′‐UTR). In contrast, genes in the late group (i.e. maximal expression approximately six hours after stimulation) tend to be located in heterochromatic regions and contain a relatively low density of NF‐κB binding sites and AREs. Finally, genes in the middle group combine some elements characteristic of the late group (e.g. similar promoter architecture) with elements of early genes (e.g. a large number of AREs in the 3′‐UTR), leading to an intermediate half‐life (t1/2). (b) Expression profiles of genes in the early (solid line), middle (long dashes), and late (short dashes) groups.
In addition to promoter architecture, posttranslational modifications, either to the TF itself or to auxiliary proteins involved in transcriptional activation at a particular locus, can also dramatically influence the rate of induction. For example, a subset of NF‐κB‐regulated genes in the middle and late groups requires that the chromatin structure near their start sites is actively remodeled for transcription to proceed efficiently. To accomplish this, NF‐κB recruits the CREB binding protein (CBP)/p300 transcriptional coactivator to these loci. CBP/p300, which exhibits histone acetyltransferase (HAT) activity, then acetylates lysine residues on nearby histone tails, promoting their transition from a transcriptionally silent heterochromatic state to a transcriptionally competent euchromatic state. Interactions between NF‐κB and CBP/p300 are dependent on phosphorylation of NF‐κB on Ser276 of the p65 (RelA) subunit [18, 19]. Interestingly, phosphorylation at this site is believed to be mediated by IκB‐NF‐κB‐associated PKA catalytic subunits (PKAc) that are activated in a cyclic AMP (cAMP)‐independent manner [19]. Initially, PKAc bound to the IκB‐NF‐κB complex in the cytoplasm is held in an inactive state by the complex. Upon IκBα degradation, PKAc is released from the complex, relieving the inhibition and allowing it to phosphorylate the RelA subunit of the NF‐κB heterodimer [19]. In this way, the signal triggering the movement of NF‐κB into the nucleus (i.e. IκB degradation) is linked to the signal to recruit the CBP/p300 coactivator important for its function (i.e. PKAc‐mediated phosphorylation of RelA[S276]).
Posttranslational modification of RelA can also differentially affect the duration of NF‐κB‐mediated transcription once it has begun. For instance, in addition to the IL‐1β and TNF‐α cytokines mentioned above, NF‐κB also strongly upregulates the expression of its negative regulator, IκBα. Once synthesized, IκBα proteins translocate into the nucleus, where they associate with DNA‐bound NF‐κB molecules [13]. The newly formed NF‐κB–IκBα complexes are then exported back to the cytoplasm via IκBα's nuclear export signal (NES), where they are sequestered until the next round of induction. In this way, IκBα and NF‐κB form an integrated circuit that first enables activation and then a coordinated attenuation of NF‐κB‐regulated gene expression. However, at select NF‐κB target gene loci, this circuit can be disrupted via posttranslational modification of NF‐κB. For example, acetylation of RelA by CBP/p300 present at certain genomic loci decreases the affinity of IκBα for NF‐κB [20]. As a consequence, NF‐κB remains bound to these promoters for a longer period of time, allowing transcription to persist longer.
The IκB–NF‐κB circuit can also be modulated in other interesting ways. For example, as we saw previously, NF‐κB activation increases the expression of TNF‐α. In hepatocytes, secreted TNF‐α protein can feed back on the NF‐κB pathway through autocrine signaling mechanisms involving the TNF receptor 1 (TNFR1) (Figure 3.4). Accordingly, secreted TNF‐α binds a preassembled TNFR1 homo‐trimer on the cell surface. Reorganization of the TNFR1 intracellular domain promotes the association of the adapter protein, TNF receptor‐associated protein with a death domain (TRADD), and the Ser/Thr kinase, receptor‐interacting protein 1 (RIP1) [21]. TRADD then recruits the adapter protein, TNFR‐associated factor 2 (TRAF2), to the complex which, in turn, recruits the cellular inhibitor of apoptosis proteins, cIAP‐1 and cIAP‐2. cIAP‐1 and cIAP‐2, which function as E3 ubiquitin ligases, then catalyze the formation of K63‐linked polyubiquitin chains on RIP1, TRAF2, and themselves [21]. Unlike the K48‐linked polyubiquitin chains involved in proteasomal degradation, K63‐linked chains do not lead to degradation. Rather, they serve as binding sites for regulatory proteins, such as the linear ubiquitin chain assembly complex (LUBAC) E3 ligase complex. Once bound, the LUBAC complex promotes the K63‐linked polyubiquitinylation of the NEMO subunit of the IKK complex, bringing it into close proximity to activated TNF‐associated kinase 1 (TAK1) and its binding partner, TAB2. TAK1 phosphorylates IKKβ, leading to its activation. Finally, as we discussed above, activated IKKβ phosphorylates IκBα within its phosphodegron, marking it for SCFβ‐TrCP‐mediated ubiquitinylation and subsequent degradation [11, 12]. Thus, NF‐κB regulates genes involved in both its inhibition (IκBα) and its activation (TNF‐α). Together, these components form an oscillatory circuit whose amplitude and frequency are modulated by the relative levels of IκBα and TNF‐α (Figure 3.5).

Figure 3.4Regulation of the IRS‐2/PI3K/aPKC signaling axis in hepatocytes by positive and negative feedback. The IRS‐2/PI3K/aPKC signaling axis is regulated by both positive and negative feedback loops involving TNF‐α (pink triangles) and IκB (green cradle), respectively. See text for details. Abbreviations are the same as those in Figure 3.2 and, additionally, TNFR1, TNF‐α‐receptor 1; TRAF2, TNFR‐associated factor 2; cIAP, cellular inhibitor of apoptosis proteins 1 and 2; RIP1, receptor‐interacting protein 1; TAK1, TNF‐associated kinase; TAB2, TAK1‐binding protein 2; TRADD, TNF receptor‐associated protein with a death domain.
Figure 3.5Opposing actions of TNF‐α and IκB can lead to oscillations in NF‐κB‐dependent gene expression. Though the expression of both TNF‐α and IκB is regulated by NF‐κB, subsequent NF‐κB‐dependent gene expression is enhanced by TNF‐α and inhibited by IκB. As a consequence, these factors can form an integrated circuit that drives oscillatory patterns of NF‐κB gene expression.
Finally, the expression patterns of TF‐regulated genes can be further refined based on the decay rates of their mRNA products. For instance, aside from containing a large number of NF‐κB binding sites in close proximity to the transcriptional start site, many of the NF‐κB‐regulated genes in the early group have an abundance of AU‐rich elements (AREs) within their 3′‐untranslated regions (3′‐UTR) (Figure 3.3a) [16, 22]. AREs within the 3′‐UTR are recognized by a family of proteins known as ARE‐specific binding proteins (AUBPs) that alter the stability and localization of their mRNA targets [23]. As a consequence, early genes rich in AREs tend to decay more rapidly than those in the late group, which contain markedly fewer AREs in their 3′‐UTRs [16, 22]. Interestingly, recent evidence suggests that posttranslational modification of AUBPs (e.g. via phosphorylation, acetylation, methylation, ubiquitination, and proline isomerization) plays an important role in modulating their interactions with ARE‐containing elements within their target transcripts [23].
Thus, by considering both the rate of induction and the rate of decay of a given transcript, it becomes clear how differential expression patterns can be achieved between NF‐κB‐dependent genes in the early, middle, and late groups (Figure 3.3b). For instance, though genes in the early group are expected to undergo rapid induction due to a high density of NF‐κB binding sites within their promoter regions, they are also expected to decay quickly due to the large number of AREs in their 3′‐UTRs. Meanwhile, genes in the late group may be activated more slowly due to a relatively sparse distribution of NF‐κB binding sites and/or the presence of heterochromatin at their promoters but their gene products are likely to persist longer due to the lower abundance of AREs within their 3′‐UTRs. Finally, genes in the middle group would combine some elements characteristic of late genes (e.g. similar promoter architecture) with elements of early genes (e.g. a large number of AREs in the 3′‐UTR), leading to an intermediate half‐life (t1/2). Interestingly, genes within each group are often related to one another with respect to their cellular function [13]. For example, cytokines tend to be expressed in the early group, while cell surface adhesion proteins and adaptor molecules are generally expressed in the late group [16].
3.2.4 Regulating the Regulators: Phosphatase‐Mediated Regulation of Signaling Molecules
In addition to NF‐κB, aPKC family members also regulate the activity of other TFs important for the cellular insulin response. In some cases, the products of the genes regulated by these TFs can feed back on the InsR‐aPKC signaling pathway to attenuate the signal. For instance, aPKC‐mediated phosphorylation of the TF, Sp1, leads to an increase in the expression of the PTPN1 gene [24]. This gene codes for protein tyrosine phosphatase, non‐receptor type 1 (PTPN1), which is the founding member of the protein tyrosine phosphatase family of enzymes. Once expressed, PTPN1 (also known as PTP1B) dephosphorylates pTyr residues on the InsR that are required for IRS‐2 docking interactions (Figure 3.6). As a consequence, PI3K fails to associate with IRS‐2 at the membrane, thereby preventing further production of PIP3. Meanwhile, existing PIP3 molecules are actively converted back to PIP2 via dephosphorylation by the lipid phosphatases, SH2 domain‐containing inositol‐5‐phosphatase 1 (SHIP1) and phosphatase and tensin homolog (PTEN). Therefore, the equilibrium between PIP3 and PIP2 is shifted toward the latter, preventing activation of additional PDK1 and, by extension, phosphorylation and activation of additional aPKC molecules. This is important because activated aPKCs are believed to be dephosphorylated by the constitutively active Ser/Thr protein phosphatase, protein phosphatase 2A (PP2A) (Figure 3.6). Thus, attenuation of PDK1 activity shifts aPKC family members back toward the inactive state.
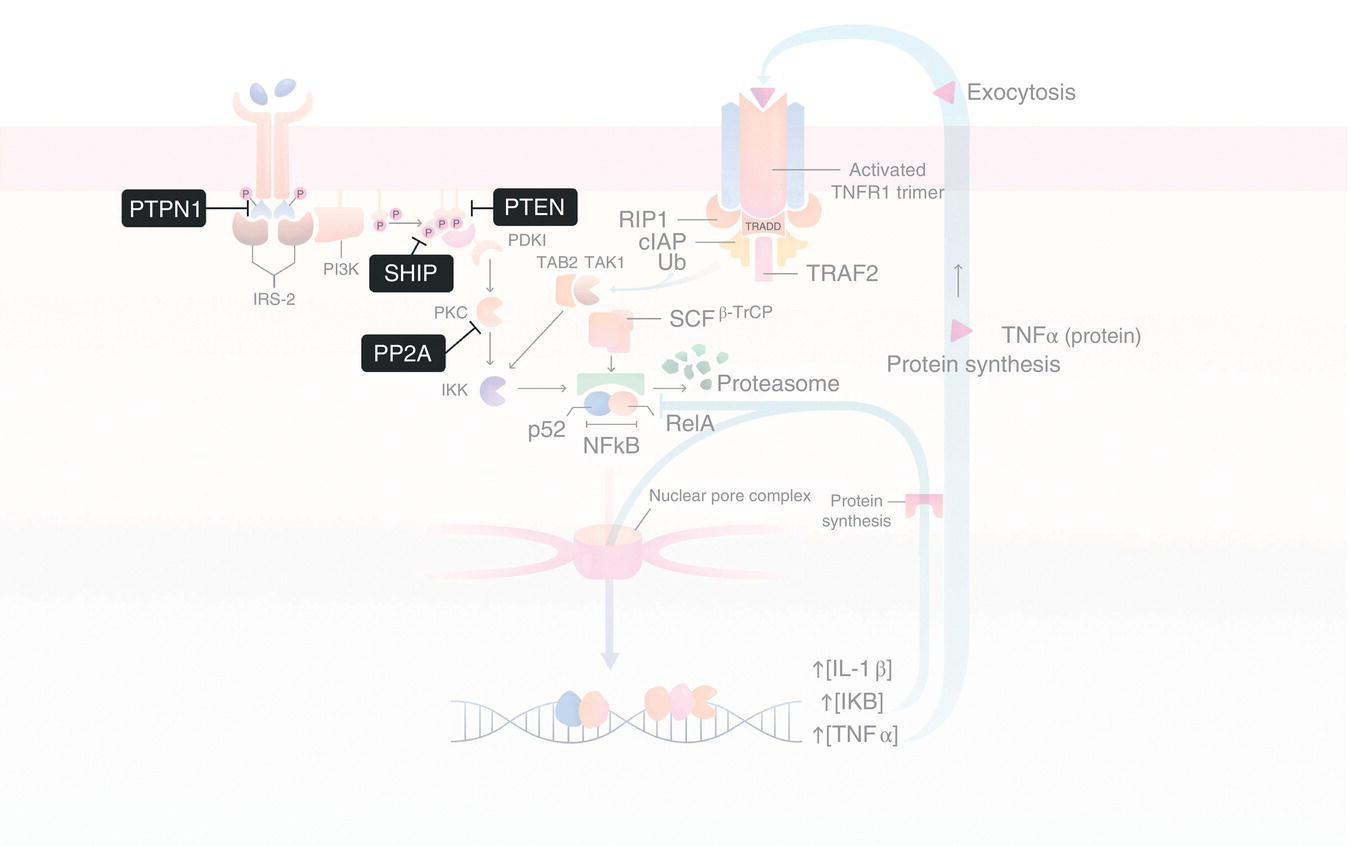
Figure 3.6Phosphatase‐mediated regulation of the IRS‐2/PI3K/aPKC signaling axis. Insulin‐dependent signaling through the IRS‐2/PI3K/aPKC signaling axis is negatively regulated by both protein (i.e. PTPN1 and PP2B) and lipid (i.e. SHIP1 and PTEN) phosphatases that catalyze the dephosphorylation of key signaling molecules, such as IRS‐2 (via PTPN1), aPKC (via PP2B), and PIP3 (via SHIP1 and PTEN). Abbreviations are the same as in Figure 3.4.
3.3 Crosstalk and Functional Signal Integration in Response to Insulin in Hepatocytes
As the primary site of gluconeogenesis (i.e. synthesis of new glucose molecules from noncarbohydrate precursors), glycogen synthesis (i.e. synthesis of branched polysaccharides used for long‐term glucose storage), and lipogenesis (i.e. synthesis of fatty acids and lipids from glucose precursors), the liver plays a central role in glucose homeostasis in vertebrates. To accomplish this, the liver must respond to changes in blood glucose by orchestrating an appropriate functional response that simultaneously activates some metabolic pathways and inactivates others. For instance, in the fed state, elevations in blood glucose lead to increased expression/activity of metabolic enzymes involved in glycogen synthesis and lipogenesis while reducing the expression of those enzymes involved in gluconeogenesis. Amazingly, each of these pathways is directly regulated by InsR signaling. For example, as we saw earlier, insulin triggers autophosphorylation of the InsR, which ultimately leads to aPKC activation via an IRS‐2/PI3K‐dependent pathway (Figure 3.2, steps 1–5). In parallel, hepatic Akt2 is activated via a similar mechanism involving IRS‐1 (and to a lesser extent, IRS‐2) and PI3K (Figure 3.7). Like aPKCs, association of Akt2 with PIP3 at the membrane facilitates PDK1‐mediated phosphorylation on Thr308 in its activation loop. This is followed by phosphorylation of Ser473 by the mammalian target of rapamycin complex 2 (mTORC2), leading to the fully activated Akt2 enzyme. Once activated, Akt2 phosphorylates several downstream effectors, many of which are involved in the metabolic pathways alluded to above. For instance, Akt2‐mediated phosphorylation inhibits glycogen synthase kinase 3‐beta (GSK3‐β) activity by promoting the formation of an intramolecular pseudosubstrate that blocks the GSK3‐β active site, thereby preventing substrate binding. As a consequence, GSK3‐β is unable to catalyze the phosphorylation of its downstream target, glycogen synthase. Since GSK3‐β‐mediated phosphorylation normally inhibits glycogen synthase activity, Akt2‐induced inhibition of GSK3‐β activity has the overall effect of activating glycogen synthase, leading to increased glycogen synthesis.
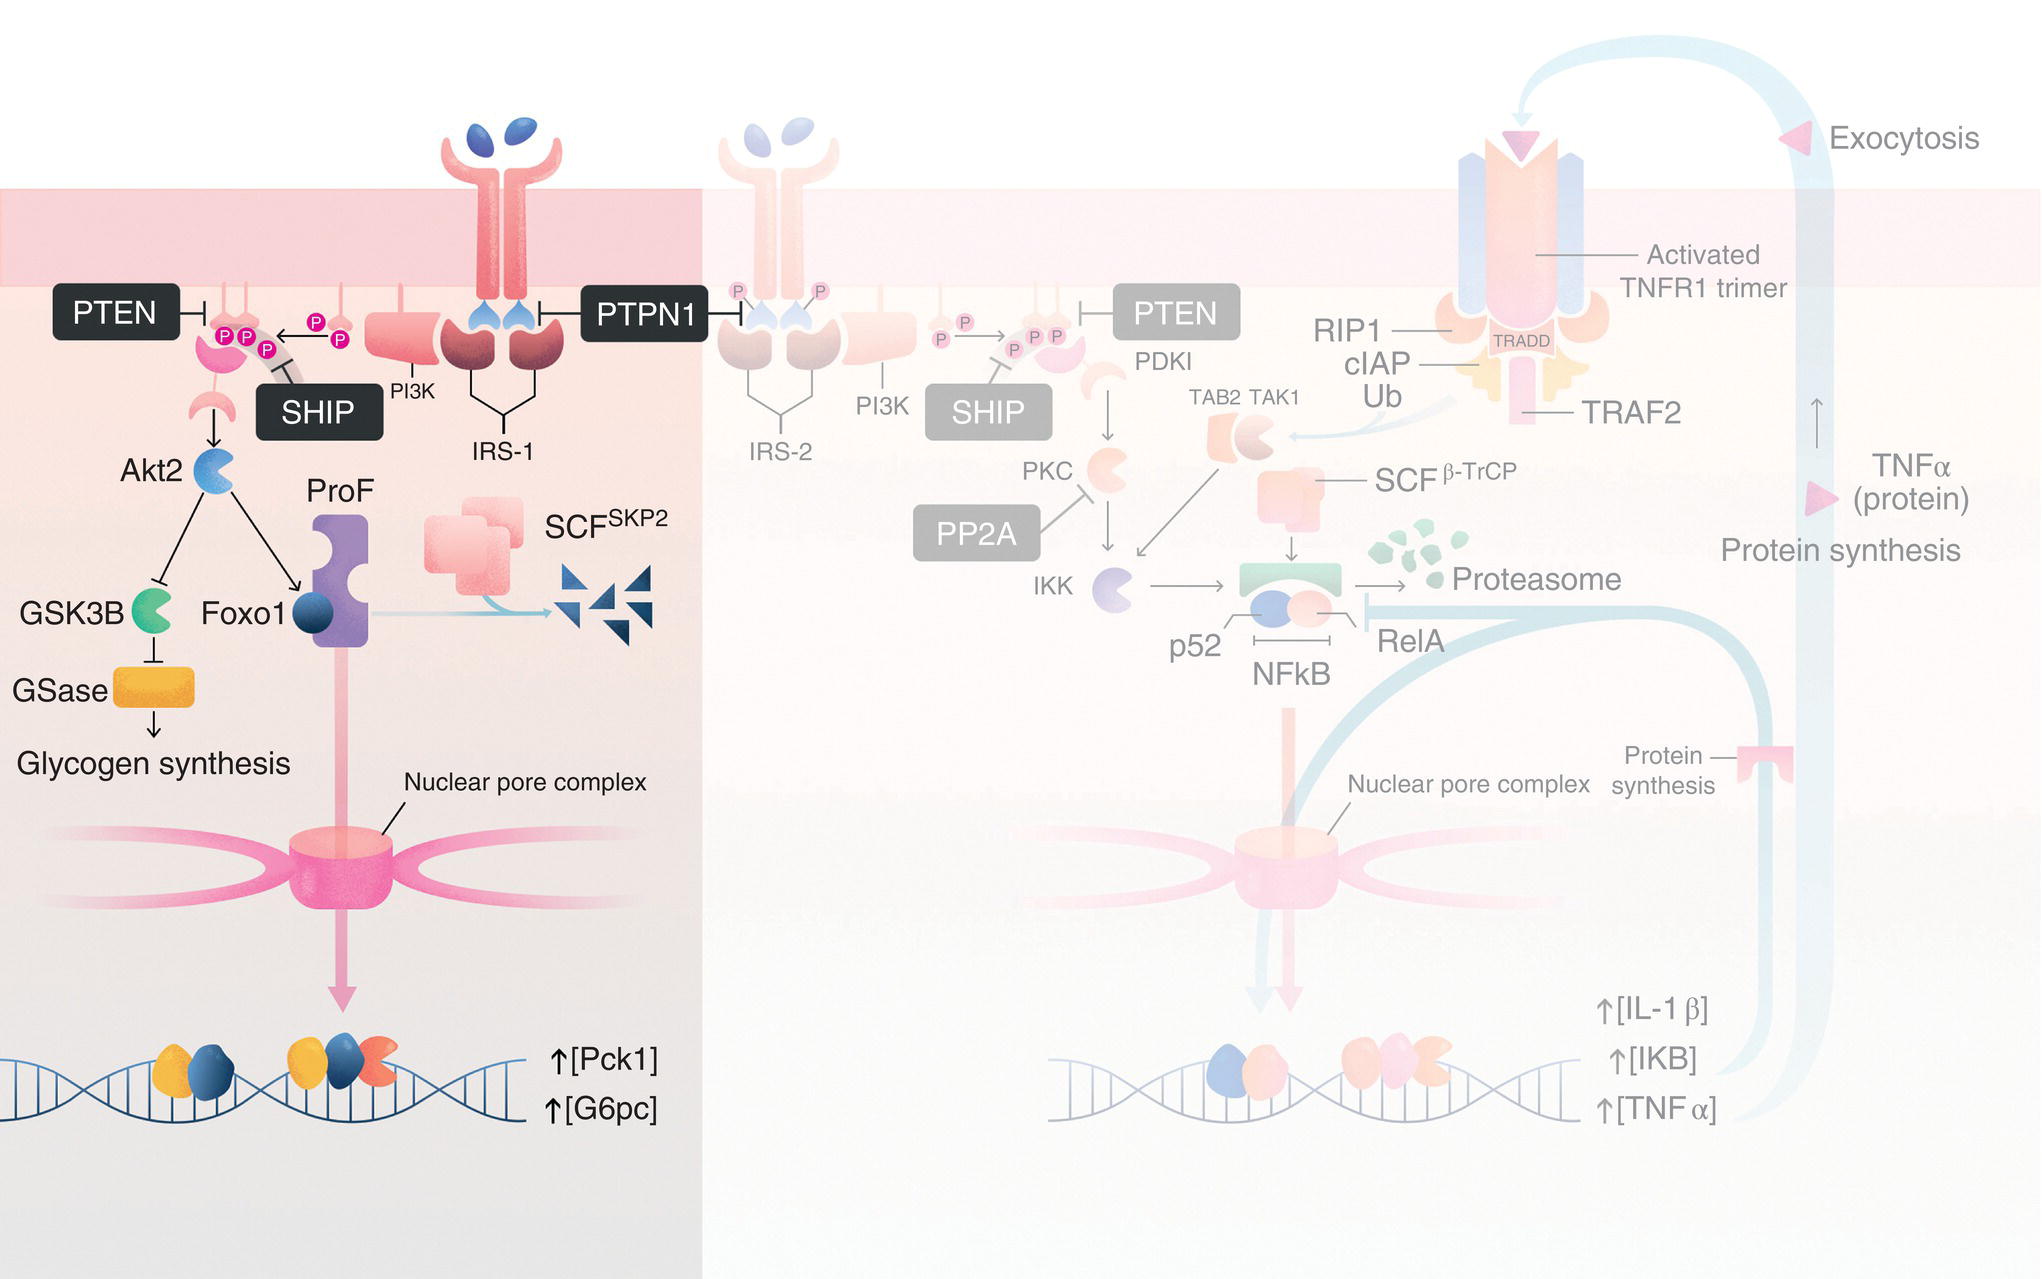
Figure 3.7Regulation of gluconeogenesis and glycogen synthesis via the IRS‐1/PI3K/Akt2 signaling axis in hepatocytes. In hepatocytes, in addition to the IRS‐2/PI3K/aPKC signaling axis (background), insulin also stimulates the IRS‐1/PI3K/Akt2 pathway, which regulates (1) gluconeogenesis via Akt2‐mediated phosphorylation/inhibition of Foxo1 and (2) glycogen synthesis by Akt2‐mediated phosphorylation/inhibition of glycogen synthase kinase 3‐beta (GSK3‐β). Abbreviations are the same as those in Figure 3.6 and, additionally, GSase, glycogen synthase; ProF, ProF/WW scaffold protein; SCFSKP2, Skip‐Cullin‐F‐box ubiquitin E3 ligase with the SKP2 substrate binding subunit; Foxo1, forkhead box O1; Pck1, phosphoenolpyruvate carboxykinase; and G6pc, glucose‐6‐phosphatase. See text for details.
At the same time, insulin‐dependent activation of Akt2 also promotes downregulation of genes involved in gluconeogenesis, such as Pck1 (encoding phosphoenolpyruvate carboxykinase [PEPCK], which increases hepatic glucose production) and G6pc (encoding glucose‐6‐phosphatase [G6Pase], which facilitates the transport of newly synthesized glucose out of the liver). Akt2 accomplishes this via phosphorylation of the TF, forkhead box O1 (Foxo1). In the fasted state, Foxo1 typically shuttles between the cytoplasm and the nucleus. Inside the nucleus, it binds regions of DNA containing the insulin response element (IRE: 5′‐CAAAACAA‐3′), including the Pck1 and G6pc promoters, driving transcription at these sites. In contrast, during the fed state, InsR‐dependent activation of Akt2 promotes phosphorylation of Foxo1 on three residues (T24, S256, and S319). The most important of these sites with respect to the regulation of Foxo1 function is pS256. Indeed, Akt2‐mediated phosphorylation of S256 promotes interactions between Foxo1 and SKP2, a subunit of the SCF ubiquitin E3 ligase complex. Similar to IκB in the NF‐κB pathway discussed earlier, the SCF complex catalyzes the conjugation of K48‐linked ubiquitin chains to Foxo1, leading to its sequestration in the cytoplasm and eventual degradation by the 26S proteasome. This, in turn, reduces expression of PEPCK and G6Pase enzymes and slows the rate of gluconeogenesis.
Interestingly, Akt2–Foxo1 interactions appear to be modulated by crosstalk between the IRS‐1/PI3K/Akt2 and IRS‐2/PI3K/aPKC pathways. For instance, Akt2 and Foxo1 are brought into close proximity with one another in the cytoplasm via interactions with the scaffold protein, ProF [25]. ProF, which contains seven WD40 repeats and a Fab1/YOTB/Vac1/EEA1 (FYVE) zinc finger domain, also interacts with aPKC. As we will discuss in more detail below, during periods of hyperinsulinemia, activated aPKC disrupts interactions between Akt2 and ProF [26, 27]. As a result, Akt2 fails to phosphorylate Foxo1, leading to continued expression of gluconeogenic enzymes and subsequent glucose synthesis despite the presence of activated Akt2. Though it is not currently known whether aPKC displaces Akt2 from ProF by phosphorylation of the ProF scaffold or by direct phosphorylation of Akt2, itself, it is known that pharmacological inhibition of aPKC restores Akt2/ProF interactions and promotes phosphorylation of Foxo1 and attenuation of gluconeogenesis [27].
Likewise, crosstalk between the IRS‐1/PI3K/Akt2 and IRS‐2/PI3K/aPKC signaling pathways also appears to be important for the regulation of genes involved in lipogenesis. For instance, sterol response element binding protein 1c (SREBP‐1c) is a basic helix–loop–helix (bHLH) TF that controls the expression of key lipogenic enzymes, including fatty acid synthase (FAS) and acetyl‐CoA carboxylase (ACC) [28]. In the fasted state, the SREBP‐1c precursor protein is anchored in the ER membrane via two transmembrane domains. In the ER, the SREBP‐1c precursor associates with the SREBP cleavage activating protein (SCAP) via its C‐terminal regulatory domain (Figure 3.8). The SREBP‐1c/SCAP complex, which must be shuttled to the Golgi apparatus for proteolytic processing of SREBP‐1c prior to its activation, is retained in the ER via interactions with insulin‐induced gene 2 (INSIG2). However, in the presence of insulin, Akt2 activation disrupts interactions between INSIG2 and the SREBP‐1c/SCAP complex, presumably through an mTORC1‐ and p70S6K‐dependent mechanism [29–32]. Likewise, Akt2‐mediated phosphorylation of SREBP‐1c promotes association of the SREBP‐1c/SCAP complex with COPII‐coated vesicles involved in anterograde transport to the Golgi [33]. At the Golgi, the luminal region of the SREBP‐1c precursor protein is cleaved in a site‐specific manner by the Ser protease, site‐1 protease (S1P). Cleavage by S1P uncouples the N‐terminal region of SREBP‐1c (which contains the bHLH domain) from the C‐terminal region (which remains associated with SCAP). This is followed by a second cleavage event mediated by the matrix metalloprotease, site‐2 protease (S2P). S2P cleavage releases the mature N‐terminal SREBP‐1c TF from the membrane, allowing it to translocate into the nucleus and associate with DNA regions containing the sterol response element (SRE; 5′‐TCACNCCAC‐3′). Interestingly, GSK3‐mediated phosphorylation of SREBP‐1c has been shown to negatively regulate its activity. Therefore, like glycogen synthase discussed above, Akt‐dependent inactivation of GSK3 serves to increase SREBP‐1c transcriptional activity [34].

Figure 3.8Akt2‐mediated activation of SREBP1 and lipogenesis. The sterol response element binding protein (SREBP) precursor protein, containing an N‐terminal basic helix–loop–helix (bHLH) DNA‐binding domain and a C‐terminal regulatory domain flanking two transmembrane regions, is initially retained in the endoplasmic reticulum through interactions with SREBP cleavage‐associated protein (SCAP) and insulin‐induced gene 2 (INSIG2). Insulin‐dependent activation of the IRS‐1/PI3K/Akt2 signaling axis. Akt2‐mediated phosphorylation of INSIG2 disrupts SCAP–INSIG2 interactions, facilitating anterograde transport of the SCAP/SREBP precursor protein ternary complex to the Golgi apparatus via coat protein II (COPII)‐coated vesicles (step 1). At the Golgi, the site‐1 protease (S1P) cleaves the linker region in the lumen, releasing the N‐terminal region of the SREBP precursor protein from SCAP (step 2). This is followed by a second cleavage event mediated by the matrix metalloprotease, site‐2 protease (S2P), releasing the mature SREBP into the cytosol (step 3). The mature SREBP protein then translocates into the nucleus through the nuclear pore complex (NPC), where it drives expression of lipogenic genes containing sterol response elements (SRE) in their promoter regions, such as fatty acid synthase (FAS) and acetyl‐CoA carboxylase (ACC). See text for further details.
However, despite the presence of active SREBP‐1c, many SRE‐regulated genes, including those encoding FAS and ACC, are not expressed efficiently without a second signal. This is because these genes are located in transcriptionally silent heterochromatic regions of the genome. To facilitate expression of these genes, the chromatin in these regions must be actively remodeled through the action of the mammalian SWItch/Sucrose Non‐Fermentable (SWI/SNF) complex. Mammalian SWI/SNF complexes are composed of several Brg1/Brm‐associated factor (BAF) family members, including the core ATPase, BAF190, and BAF60, which is believed to recruit the SWI/SNF complex to its site of action though interactions with TFs. During insulin signaling, cytoplasmic BAF60 is specifically phosphorylated by aPKC on S247, leading to its redistribution from the cytoplasm to the nucleus. Once inside the nucleus, BAF60 associates with upstream stimulatory factor 1 (USF1) which, interestingly, also plays a role in recruiting SREBP‐1c to SREs in a DNA‐dependent protein kinase (DNA‐PK)‐dependent manner [33]. Subsequent interactions between BAF60 and the SWI/SNF complex then promote remodeling of the chromatin in these regions, converting them to transcriptionally active euchromatic regions.
3.4 Systemic Signal Integration
To this point, we have focused primarily on signaling pathways involved in the hepatic response to insulin. However, it is important to note that insulin also simultaneously stimulates other cells and tissues that are critical for an appropriate physiological response to glucose during feeding (i.e. the efficient uptake and utilization of glucose and its derivatives). Here, we will briefly discuss how different tissues respond to elevations in glucose and how the specific responses from each of these tissues are coordinated throughout the system. During this discussion, we will highlight three cell types whose activities are tightly linked to those that we examined previously in the liver. Specifically, we will focus on the mechanisms by which insulin‐ and InsR‐dependent signaling processes regulate glucose metabolism in skeletal muscle cells, adipocytes, and pancreatic β‐cells.
3.4.1 Pancreatic β‐Cells
The systemic insulin response begins in pancreatic β‐cells, where the insulin precursor protein, preproinsulin, is initially synthesized from the INS gene. Preproinsulin is then processed to the mature insulin protein by a series of proteolytic processing steps, first in the rough ER and then in the Golgi apparatus, before being packaged into vesicles for eventual secretion [35, 36]. Insulin secretion, which is primarily regulated by elevations in blood glucose but can also be triggered by other stimuli, including various carbohydrates, amino acids, and vagal nerve stimulation, is initiated by depolarization of electrically sensitive β‐cells [37, 38]. Accordingly, in the fed state, blood glucose is transported across the β‐cell’s plasma membrane via the low‐affinity glucose transporter, GLUT2 [39]. Intracellular glucose is then shuttled into the glycolytic pathway, leading to the production of ATP. As ATP levels increase, so too does the intracellular ATP/ADP ratio, causing closure of ATP‐sensitive sulfonylurea receptor 1 (SUR1)/Kir6.2 inward rectifying potassium channels [40]. This, in turn, leads to membrane depolarization, which activates voltage‐gated Ca2+ channels, resulting in an influx of extracellular Ca2+ and an increase in the intracellular Ca2+ concentration, both from the aforementioned influx of extracellular Ca2+ and the subsequent release of internal Ca2+ stores from the ER via stimulation of Ca2+‐sensitive ryanodine receptors, trigger vesicle fusion with the membrane – potentially via a signaling mechanism involving the classical and/or novel PKC family members, PKCα and PKCε, respectively – and subsequent secretion of insulin into the hepatic portal vein. Interestingly, β‐cells express the InsR at appreciable levels. Moreover, exogenous addition of insulin leads to a decrease in INS gene expression [41]. As a consequence, insulin secretion has long been thought to feed back on β‐cells to regulate its own expression through an autocrine signaling pathway involving the IRS‐2/Akt/Foxo1 signaling axis [42]. However, the relevance of this autocrine signaling pathway under normal physiological conditions has recently been called into question [43].
3.4.2 Skeletal Muscles
After insulin is secreted from β‐cells, it first encounters neighboring α‐ and β‐cells in the local islet milieu (modulating the synthesis/secretion of glucagon and somatostatin, respectively, in an InsR‐dependent manner) before feeding into the hepatic portal vein. In the liver, insulin‐mediated activation of InsR regulates a series of metabolic pathways, including gluconeogenesis, glycogen synthesis, and lipogenesis, as discussed in detail in Section 3.2. Interestingly, due to the high concentration of InsR on the surface of hepatic cells, roughly half of the insulin secreted from β‐cells is removed from circulation via receptor‐mediated endocytosis [39]. The remaining insulin is retained in the systemic circulatory system, where it is distributed to various tissues throughout the body. One of its primary targets is skeletal muscles. In myocytes, InsR activation stimulates glucose uptake via the high affinity glucose transporter, GLUT4, and subsequent glycogen synthesis. Interestingly, these processes are regulated by both aPKC and Akt in an exclusively IRS‐1/PI3K‐dependent manner. Indeed, unlike the liver – where the IRS‐1/PI3K and IRS‐2/PI3K signaling axes are predominately associated with Akt‐ and aPKC‐mediated signaling, respectively – in myocytes, the IRS‐1/PI3K pathway directly activates both Akt and aPKC (although IRS‐2 is expressed in myocytes, the function of the IRS‐2/PI3K pathway in muscle is currently unknown) [8]. For instance, insulin‐dependent activation of aPKC promotes the phosphorylation of vesicle‐associated membrane protein 2 (VAMP2) on the surface of GLUT4 vesicles. Phosphorylation of VAMP2, which is a key component of the soluble N‐ethylmaleimide‐sensitive attachment receptor (SNARE) complex, promotes interactions with syntaxin 4 on the inner surface of the plasma membrane, facilitating vesicle fusion to the membrane. Moreover, PKC‐mediated phosphorylation of the syntaxin 4‐associated protein, Munc18c, promotes its dissociation from syntaxin 4 [44]. This is important because Munc18c normally inhibits interactions between VAMP2 and proteins required for vesicle docking and subsequent fusion of GLUT4 to the membrane. Integration of GLUT4 into the membrane results in highly efficient transport of glucose into the cell via facilitated diffusion. In fact, due to the high affinity of GLUT4 for glucose and the relatively large biomass of skeletal muscle, myocytes in skeletal muscle account for the clearance of nearly 70% of postprandial glucose [39, 45]. Once inside the cell, glucose monomers are integrated into glycogen for storage. Much like we saw in hepatocytes, the rate of glycogen synthesis is regulated in an insulin‐dependent manner through Akt‐mediated inhibition of GSK3, leading to an increase in glycogen synthase activity (e.g. see Figure 3.7).
3.4.3 Adipose Tissue
In addition to the liver and muscle, adipose is another major insulin‐responsive tissue. Adipocytes, which play an essential role in metabolic regulation through fat storage and the secretion of adipokines such as leptin, adiponectin, and resistin, express the InsR at fairly high levels. Like skeletal muscles, InsR activation promotes the integration of high‐affinity GLUT4 glucose transporters into the plasma membrane via SNARE‐mediated vesicle fusion. This process, which is also governed by an IRS‐1/PI3K/aPKC‐dependent signaling mechanism [13, 46], leads to the efficient transport of glucose into the cytoplasm of adipocytes. As a consequence, adipocytes account for between 5 and 15% of total glucose clearance after a meal [39, 47]. Once inside the cell, glucose is rapidly converted to acetyl‐CoA, which is then incorporated into fatty acids through the action of FAS. In adipocytes, these fatty acids are ultimately conjugated to glycerol to form triglycerides for long‐term energy storage. Similar to the liver, expression of FAS and other enzymes involved in lipogenesis is regulated in an insulin‐dependent manner through Akt‐mediated activation of SREBP‐1c (Figure 3.8). In parallel, InsR activation represses lipolysis in adipocytes. This process is also believed to be mediated by Akt, which phosphorylates and activates the phosphodiesterase, PDE3B. PDE3B degrades the second messenger, cAMP, inhibiting PKA activity and, by extension, PKA‐mediated activation of hormone‐sensitive lipase (HSL). Therefore, through the action of the IRS‐1/PI3K/Akt signaling axis, insulin simultaneously stimulates the metabolic pathways involved in fatty acid synthesis (i.e. lipogenesis) and inhibits those involved in breaking down fatty acids (i.e. lipolysis).
3.5 Dysregulation of Insulin Signaling in the Etiology of Type 2 Diabetes
Given the central importance of insulin‐dependent signaling to glucose clearance and metabolic regulation, perhaps it is not surprising that dysregulation of this system underlies several of the disorders associated with the metabolic syndrome, including obesity, cardiovascular disease, and T2D. The latter, which is characterized by elevated blood glucose levels stemming from decreased insulin sensitivity, has reached pandemic levels in many “Westernized” societies. For instance, nearly 30 million people in the United States were affected by T2D in 2017 [48]. Moreover, recent estimates suggest that the prevalence of T2D will increase by more than 50% (to almost 55 million Americans) by 2030, making T2D a major health burden in the United States [49].
Though the etiology of T2D is complex, one of the primary causative factors appears to be prolonged periods of caloric excess [8]. Under these conditions, hyper‐activation of InsR signaling can lead to insulin insensitivity and diminished glucose clearance and utilization. For instance, as we saw earlier, hyperinsulinemia leads to disruption of the Akt2–ProF complex in hepatocytes via an IRS‐2/PI3K/aPKC‐dependent signaling mechanism. As a result, Akt2 is unable to phosphorylate/inhibit Foxo1, leading to sustained gluconeogenesis in spite of elevated systemic blood glucose levels. The de novo synthesis of glucose leads to further increases in blood glucose, stimulating further insulin secretion from pancreatic β‐cells and continued hyperinsulinemia. Under normal conditions, a significant proportion of the excess glucose produced during gluconeogenesis would be cleared by skeletal muscles and, to a lesser extent, adipose tissue. However, during hyperinsulinemia, several factors related to over‐activation of hepatic aPKC and Akt lead to diminished systemic glucose clearance. For instance, concomitant increases in hepatic lipogenesis (mediated by Akt2/SREBP1) produce fatty acids and other lipids that reduce InsR signaling mediated through the IRS‐1/PI3K pathway in myocytes. Since both aPKC and Akt are activated by this pathway in myocytes, aPKC‐mediated redistribution of GLUT4 to the membrane is severely diminished, resulting in impaired glucose transport. Moreover, recall that in hepatocytes, IRS‐2/PI3K/aPKC also leads to increased expression of pro‐inflammatory cytokines, such as IL‐1B and TNF‐α, in an NF‐κB‐dependent manner (Figure 3.2). Not only does TNF‐α feed back on hepatocytes to activate aPKC via TNFR1 and TAK (Figure 3.4), but, together with IL‐1B, it also induces system‐wide inflammation that further diminishes InsR signaling in myocytes and adipocytes [50]. To make matters worse, the inflammatory response is reinforced and intensified by fat expansion in adipocytes driven by hyperlipidemia. Specifically, increases in circulating lipids caused by hepatic lipogenesis lead to adipocytic secretion of the pro‐inflammatory cytokines TNF‐α, IL‐6, and leptin while simultaneously reducing secretion of the anti‐inflammatory hormone, adiponectin. Together, the resulting inflammatory response leads to systemic insulin resistance that results in elevated blood glucose levels characteristic of T2D. Interestingly, recent evidence suggests that ubiquitous environmental contaminants, such as the plasticizer, bisphenol A (BPA), may further contribute to dysregulation of the systemic insulin response. Indeed, environmentally relevant doses of BPA, which is an endocrine‐disrupting chemical (EDC) present in reusable plastic bottles and the internal coatings of many food and beverage cans, have been shown to inhibit adiponectin secretion and to promote the release of TNF‐α and IL‐6 from adipocytes, even in the absence of overnutrition [51, 52]. Likewise, similar concentrations of BPA (approximately 1 nM) were shown to dramatically decrease the activity of SUR1/Kir6.2 potassium channels in pancreatic β‐cells, thereby potentiating glucose‐induced insulin secretion and hyperinsulinemia [53]. Similar effects have also been reported for other EDCs, including dioxins and diethylstilbestrol (DES) [54]. Thus, dysregulation of insulin‐dependent signaling mechanisms, either by caloric excess or environmental agents (or a combination thereof), can reduce insulin sensitivity and increase blood glucose levels, leading to the development of T2D and its complications.
References
- 1 Taylor, S.S. and Kornev, A.P. (2011). Protein kinases: evolution of dynamic regulatory proteins. Trends Biochem. Sci. 36 (2): 65–77.
- 2 Iversen, L., Tu, H.L., Lin, W.C. et al. (2014). Molecular kinetics. Ras activation by SOS: allosteric regulation by altered fluctuation dynamics. Science 345 (6192): 50–54.
- 3 Zeeh, J.C., Antonny, B., Cherfils, J., and Zeghouf, M. (2008). In vitro assays to characterize inhibitors of the activation of small G proteins by their guanine nucleotide exchange factors. Methods Enzymol. 438: 41–56.
- 4 Newman, R.H., Fosbrink, M.D., and Zhang, J. (2011). Genetically encodable fluorescent biosensors for tracking signaling dynamics in living cells. Chem. Rev. 111 (5): 3614–3666.
- 5 Hubbard, S.R. (2013). The insulin receptor: both a prototypical and atypical receptor tyrosine kinase. Cold Spring Harb. Perspect. Biol. 5 (3): a008946.
- 6 Tatulian, S.A. (2015). Structural dynamics of insulin receptor and transmembrane signaling. Biochemistry 54 (36): 5523–5532.
- 7 Farese, R.V. and Sajan, M.P. (2010). Metabolic functions of atypical protein kinase C: “good” and “bad” as defined by nutritional status. Am. J. Physiol. Endocrinol. Metab. 298 (3): E385–E394.
- 8 Farese, R.V., Lee, M.C., and Sajan, M.P. (2014). Hepatic atypical protein kinase C: an inherited survival‐longevity gene that now fuels insulin‐resistant syndromes of obesity, the metabolic syndrome and type 2 diabetes mellitus. J. Clin. Med. 3 (3): 724–740.
- 9 Lallena, M.J., Diaz‐Meco, M.T., Bren, G. et al. (1999). Activation of IkappaB kinase beta by protein kinase C isoforms. Mol. Cell Biol. 19 (3): 2180–2188.
- 10 Clifton, D.R., Rydkina, E., Freeman, R.S., and Sahni, S.K. (2005). NF‐kappaB activation during rickettsia rickettsii infection of endothelial cells involves the activation of catalytic IkappaB kinases IKKalpha and IKKbeta and phosphorylation‐proteolysis of the inhibitor protein IkappaBalpha. Infect. Immun. 73 (1): 155–165.
- 11 Kanarek, N. and Ben‐Neriah, Y. (2012). Regulation of NF‐kappaB by ubiquitination and degradation of the IkappaBs. Immunol. Rev. 246 (1): 77–94.
- 12 Suzuki, H., Chiba, T., Kobayashi, M. et al. (1999). IkappaBalpha ubiquitination is catalyzed by an SCF‐like complex containing Skp1, cullin‐1, and two F‐box/WD40‐repeat proteins, betaTrCP1 and betaTrCP2. Biochem. Biophys. Res. Commun. 256 (1): 127–132.
- 13 Sen, R. and Smale, S.T. (2010). Selectivity of the NF‐{kappa}B response. Cold Spring Harb. Perspect. Biol. 2 (4): a000257.
- 14 Paszek, P., Lipniacki, T., Brasier, A.R. et al. (2005). Stochastic effects of multiple regulators on expression profiles in eukaryotes. J. Theor. Biol. 233 (3): 423–433.
- 15 Boston University (2011). NF‐kB Target Genes. http://www.bu.edu/nf‐kb/gene‐resources/target‐genes (accessed 1 February 2018).
- 16 Iwanaszko, M., Brasier, A.R., and Kimmel, M. (2012). The dependence of expression of NF‐kappaB‐dependent genes: statistics and evolutionary conservation of control sequences in the promoter and in the 3′ UTR. BMC Genomics 13: 182.
- 17 Wunderlich, Z. and Mirny, L.A. Different gene regulation strategies revealed by analysis of binding motifs. Trends Genet. 25 (10): 434–440.
- 18 Zhong, H., May, M.J., Jimi, E., and Ghosh, S. (2002). The phosphorylation status of nuclear NF‐kappa B determines its association with CBP/p300 or HDAC‐1. Mol. Cell 9 (3): 625–636.
- 19 Zhong, H., Voll, R.E., and Ghosh, S. (1998). Phosphorylation of NF‐kappa B p65 by PKA stimulates transcriptional activity by promoting a novel bivalent interaction with the coactivator CBP/p300. Mol. Cell 1 (5): 661–671.
- 20 Chen, L.F., Mu, Y., and Greene, W.C. (2002). Acetylation of RelA at discrete sites regulates distinct nuclear functions of NF‐kappaB. EMBO J. 21 (23): 6539–6548.
- 21 Wajant, H. and Scheurich, P. (2011). TNFR1‐induced activation of the classical NF‐kappaB pathway. FEBS J. 278 (6): 862–876.
- 22 Hao, S. and Baltimore, D. (2009). The stability of mRNA influences the temporal order of the induction of genes encoding inflammatory molecules. Nat. Immunol. 10 (3): 281–288.
- 23 Shen, Z.J. and Malter, J.S. Regulation of AU‐rich element RNA binding proteins by phosphorylation and the Prolyl Isomerase Pin1. Biomolecules 5 (2): 412–434.
- 24 Inada, S., Ikeda, Y., Suehiro, T. et al. (2007). Glucose enhances protein tyrosine phosphatase 1B gene transcription in hepatocytes. Mol. Cell. Endocrinol. 271 (1–2): 64–70.
- 25 Fritzius, T. and Moelling, K. (2008). Akt‐ and Foxo1‐interacting WD‐repeat‐FYVE protein promotes adipogenesis. EMBO J. 27 (9): 1399–1410.
- 26 Sajan, M.P., Ivey, R.A. 3rd, and Farese, R.V. (2015). BMI‐related progression of atypical PKC‐dependent aberrations in insulin signaling through IRS‐1, Akt, FoxO1 and PGC‐1alpha in livers of obese and type 2 diabetic humans. Metabolism 64 (11): 1454–1465.
- 27 Sajan, M.P., Ivey, R.A., Lee, M.C., and Farese, R.V. (2015). Hepatic insulin resistance in Ob/Ob mice involves increases in ceramide, aPKC activity, and selective impairment of Akt‐dependent FoxO1 phosphorylation. J. Lipid Res. 56 (1): 70–80.
- 28 Jeon, T.I. and Osborne, T.F. (2012). SREBPs: metabolic integrators in physiology and metabolism. Trends Endocrinol. Metab. 23 (2): 65–72.
- 29 Bakan, I. and Laplante, M. (2012). Connecting mTORC1 signaling to SREBP‐1 activation. Curr. Opin. Lipidol. 23 (3): 226–234.
- 30 Guo, S. (2014). Insulin signaling, resistance, and the metabolic syndrome: insights from mouse models into disease mechanisms. J. Endocrinol. 220 (2): T1–T23.
- 31 Li, S., Brown, M.S., and Goldstein, J.L. (2010). Bifurcation of insulin signaling pathway in rat liver: mTORC1 required for stimulation of lipogenesis, but not inhibition of gluconeogenesis. Proc. Natl. Acad. Sci. U.S.A. 107 (8): 3441–3446.
- 32 Owen, J.L., Zhang, Y., Bae, S.H. et al. (2012). Insulin stimulation of SREBP‐1c processing in transgenic rat hepatocytes requires p70 S6‐kinase. Proc. Natl. Acad. Sci. U.S.A. 109 (40): 16184–16189.
- 33 Wang, Y., Viscarra, J., Kim, S.J., and Sul, H.S. (2015). Transcriptional regulation of hepatic lipogenesis. Nat. Rev. Mol. Cell. Biol. 16 (11): 678–689.
- 34 Kim, K.H., Song, M.J., Yoo, E.J. et al. (2004). Regulatory role of glycogen synthase kinase 3 for transcriptional activity of ADD1/SREBP1c. J. Biol. Chem. 279 (50): 51999–52006.
- 35 Du, X., Kristiana, I., Wong, J., and Brown, A.J. (2006). Involvement of Akt in ER‐to‐Golgi transport of SCAP/SREBP: a link between a key cell proliferative pathway and membrane synthesis. Mol. Biol. Cell 17 (6): 2735–2745.
- 36 Yellaturu, C.R., Deng, X., Cagen, L.M. et al. (2009). Insulin enhances post‐translational processing of nascent SREBP‐1c by promoting its phosphorylation and association with COPII vesicles. J. Biol. Chem. 284 (12): 7518–7532.
- 37 Chandra, R. and Liddle, R.A. (2014). Recent advances in the regulation of pancreatic secretion. Curr. Opin. Gastroenterol. 30 (5): 490–494.
- 38 Molina, J., Rodriguez‐Diaz, R., Fachado, A. et al. (2014). Control of insulin secretion by cholinergic signaling in the human pancreatic islet. Diabetes 63 (8): 2714–2726.
- 39 Bedinger, D.H. and Adams, S.H. (2015). Metabolic, anabolic, and mitogenic insulin responses: a tissue‐specific perspective for insulin receptor activators. Mol. Cell. Endocrinol. 415: 143–156.
- 40 Koo, B.K., Cho, Y.M., Park, B.L. et al. (2007). Polymorphisms of KCNJ11 (Kir6.2 gene) are associated with type 2 diabetes and hypertension in the Korean population. Diabet. Med. 24 (2): 178–186.
- 41 Leibiger, B., Leibiger, I.B., Moede, T. et al. (2001). Selective insulin signaling through A and B insulin receptors regulates transcription of insulin and glucokinase genes in pancreatic beta cells. Mol. Cell. 7 (3): 559–570.
- 42 White, M.F. (2006). Regulating insulin signaling and beta‐cell function through IRS proteins. Can. J. Physiol. Pharmacol. 84 (7): 725–737.
- 43 Rhodes, C.J., White, M.F., Leahy, J.L., and Kahn, S.E. (2013). Direct autocrine action of insulin on beta‐cells: does it make physiological sense? Diabetes 62 (7): 2157–2163.
- 44 Smithers, N.P., Hodgkinson, C.P., Cuttle, M., and Sale, G.J. (2008). 80K‐H acts as a signaling bridge in intact living cells between PKCzeta and the GLUT4 translocation regulator Munc18c. J. Recept. Signal Transduct. Res. 28 (6): 581–589.
- 45 DeFronzo, R.A. and Tripathy, D. (2009). Skeletal muscle insulin resistance is the primary defect in type 2 diabetes. Diabetes Care 32 (Suppl 2): S157–S163.
- 46 Sajan, M.P., Rivas, J., Li, P. et al. (2006). Repletion of atypical protein kinase C following RNA interference‐mediated depletion restores insulin‐stimulated glucose transport. J. Biol. Chem. 281 (25): 17466–17473.
- 47 Biddinger, S.B. and Kahn, C.R. (2006). From mice to men: insights into the insulin resistance syndromes. Annu. Rev. Physiol. 68: 123–158.
- 48 Center for Disease Control (2017). National Diabetes Statistics Report, Atlanta.
- 49 Rowley, W.R., Bezold, C., Arikan, Y. et al. (2017). Diabetes 2030: insights from yesterday, today, and future trends. Popul. Health Manag. 20 (1): 6–12.
- 50 Cai, D., Yuan, M., Frantz, D.F. et al. (2005). Local and systemic insulin resistance resulting from hepatic activation of IKK‐beta and NF‐kappaB. Nat. Med. 11 (2): 183–190.
- 51 Ben‐Jonathan, N., Hugo, E.R., and Brandebourg, T.D. (2009). Effects of bisphenol a on adipokine release from human adipose tissue: implications for the metabolic syndrome. Mol. Cell. Endocrinol. 304 (1–2): 49–54.
- 52 Hugo, E.R., Brandebourg, T.D., Woo, J.G. et al. (2008). Bisphenol a at environmentally relevant doses inhibits adiponectin release from human adipose tissue explants and adipocytes. Environ. Health Perspect. 116 (12): 1642–1647.
- 53 Soriano, S., Alonso‐Magdalena, P., Garcia‐Arevalo, M. et al. (2012). Rapid insulinotropic action of low doses of bisphenol‐a on mouse and human islets of Langerhans: role of estrogen receptor beta. PLoS One 7 (2): e31109.
- 54 Alonso‐Magdalena, P., Quesada, I., and Nadal, A. (2011). Endocrine disruptors in the etiology of type 2 diabetes mellitus. Nat. Rev. Endocrinol. 7 (6): 346–353.