
4
Signal Transduction in Disease: Relating Cell Signaling to Morbidity and Mortality
Patricia E. Ganey1 and Sean A. Misek2
1 Department of Pharmacology and Toxicology, Michigan State University, East Lansing, MI, USA
2 Department of Physiology, Michigan State University, East Lansing, MI, USA
4.1 Introduction
Disease pathogenesis can often arise from disruptions in normal signaling pathways, which are often complex and integrated. For example, perturbations in intracellular calcium homeostasis have been implicated in the development of neurodegenerative diseases such as Parkinson's, Huntington's, and Alzheimer's disease [1–3]. Additionally, simple dysregulation of signal transduction cascades in response to alterations in the local cellular environment (e.g. oxidative stress, endoplasmic reticulum stress, mitogen‐activated protein kinase (MAPK) activity, and alterations in calcineurin, to name a few [1, 4–7]) has also been shown to contribute to disease pathogenesis. Further, perturbations in signal transduction networks can lead to altered physiological states, such as asthma and diabetes. Asthma arises from disruption of inter‐ and intracellular signaling in inflammatory cells, as well as alterations in the molecular machinery for synthesis of mucus; these changes involve lipid mediators, cytokines, T cells, and innate lymphoid cells [8–11]. Disruption of pathways signaling through Notch, MAPKs, phosphoinositide‐3‐kinase (PI3K), and protein tyrosine kinases (PTKs) has been shown to contribute to the pathogenesis of asthma [12–14]. Diabetes, which was discussed in detail in Chapter 3, is associated with alterations in Wnt and bone morphogenetic protein 4 (BMP4) signaling [15], as well as disturbance of the function of glucose transporter 4 [16, 17] and peroxisome proliferator‐activated receptors (PPARs) [18].
One of the most well‐researched examples of altered signal transduction in disease pathogenesis is the study of cancer. Large efforts in the field have been dedicated to understanding the imbalances that lead to the development of this disease. From a holistic point of view, inhibition of apoptotic pathways (that are initiated via signal transduction), which would normally eliminate mutated or otherwise damaged cells, plays a critical permissive role in carcinogenesis [19, 20]. Further, imbalances in cellular homeostasis can result in adaptations at the cellular level that facilitate disease development (e.g. loss of pathways that degrade hypoxia‐inducible factor‐1 alpha [HIF‐1α] leads to its stabilization, affording a survival advantage to oxygen‐deprived tumor cells [21]). Additionally, changes in DNA methylation, microRNAs, and disrupted Notch signaling are among the other pathways for which perturbation can contribute to the development of cancer [22–25].
From a genetic perspective, one of the most common oncogenes – or mutated genes that drives aberrant cancer growth and survival – is the small GTPase protein Ras. Mutations that prevent GTP hydrolysis and “turn‐off” of the protein are found commonly in the KRAS gene in pancreatic, colorectal, and lung cancers, as well as the NRAS gene in melanoma, both of which participate in Ras signaling. Protein kinases are another well‐studied species in the field of signal transduction and cancer, as they are often mutated or overexpressed. Kinases are affected by the activity of oncogenes as well as tumor suppressor genes. The first definitively identified oncogene was src from the Rous sarcoma virus. Both this viral protein and its mammalian cellular homolog, Src, are PTKs encoded by the src gene; other known examples of oncogenes associated with tyrosine kinases include the epidermal growth factor receptor (EGFR), the EGFR family protein HER2 in breast cancer, platelet‐derived growth factor (PDGF), vascular endothelial growth factor (VEGF), and anaplastic lymphoma kinase (ALK), which is important in lung cancer as well as lymphoma. A number of serine/threonine kinases are also mutated in melanoma, lung, and other cancers. These include the v‐Raf murine sarcoma viral oncogene homolog B (BRAF) and the kinases that activate mitogen‐activated protein kinase (MAPK) and extracellular‐regulated kinase (ERK) kinase (MEK1/2). The activity of tumor suppressor genes that code for important signaling proteins can be inactivated or lost in cancer, also resulting in dysregulation of kinase activity. For example, one of the most common tumor suppressor genes is phosphatase and tensin homolog (PTEN), which encodes phosphatidylinositol‐3,4,5‐trisphosphate 3‐phosphatase. This lipid phosphatase breaks down phosphatidylinositol (3,4,5)‐trisphosphate (PIP3) to bisphosphate product phosphatidylinositol (4,5)‐bisphosphate (PIP2). Since PIP3 is the primary activator of the pro‐survival Akt kinases, loss of a key degradation pathway for PIP3 provides an important stimulus for cancer development and progression.
The above examples merely scratch the surface of intracellular signaling pathways that contribute to disease. In this chapter, we will focus on changes that go beyond single cells to understand the complex interactions between cell types that often contribute to disease. Rather than attempt complete coverage, this chapter will focus on two examples: (i) First, diseases in which tissue fibrosis develops will illustrate the complexity and extensive interaction of cells and signaling events that participate in the development of fibrotic diseases. (ii) Second, the development of cancer resistance to the new “targeted” drugs that modulate signal transduction can involve cell–cell interactions, and it is important to note that both heterogeneity and intercellular interactions among the large population of cancer cells will contribute to the complexity of response. With these two topics as the focus of the chapter, we aim to illustrate general principles that are broadly applicable to signal transduction in disease.
4.2 Fibrosis as an Example of Complex Signaling
Fibrosis is a chronic condition characterized by excess deposition of extracellular matrix (ECM) proteins and thickening and stiffening of tissue, resulting in impairment of function and alterations in tissue architecture. It is considered a wound healing process of last resort, one that is initiated when repair processes fail. Fibrosis occurs in a variety of tissues including liver, lung, and kidney, and it is a result of persistent damage and inflammation. Fibrosis can range from a benign condition to one that is quite serious, and it can even be a precursor to neoplastic disease [26]. However, recent efforts have brought to light that even advanced changes are reversible, and resolution can be achieved [27]. This section will focus on intracellular signaling events and cellular interactions that lead to fibrosis, using hepatic fibrosis as an example. Hepatic fibrosis is the example of choice, as many of the signaling pathways involved in fibrosis of the liver are relevant to other tissues.
4.2.1 Development of Liver Fibrosis
Liver fibrosis can occur as a result of chronic injury due to viral infection, chemical insult (including chronic alcohol consumption), nonalcoholic steatohepatitis (fatty liver), autoimmune reactions, or cholestatic liver disease, among others [28]. Necrosis, accumulation of inflammatory cells, increased numbers of myofibroblasts, and excessive deposition of ECM are all evident in liver fibrosis [29]. Development of fibrosis occurs due to interactions among multiple resident liver cell types, inflammatory cells, and mediators, as well as ECM components.
Hepatocellular damage is the initiator of fibrosis. In response to cell damage, reactive oxygen species (ROS) and other signal transduction mediators are released from dying hepatocytes and Kupffer cells (KCs), the resident macrophages of the liver (Figure 4.1). These mediators attract other macrophages and inflammatory cells from the blood, leading to increased production and release of pro‐inflammatory mediators [27]. Cytokines, such as tumor necrosis factor‐α (TNF‐α), interleukin (IL)‐6, IL‐1β, and transforming growth factor‐β1 (TGF‐β1), are released by macrophages to promote inflammation and recruit other immune cells, including T lymphocytes (T cells). Growth factors, including PDGF and epidermal growth factor (EGF), are also generated during this response. TGF‐β1 released by hepatocytes is a major activator of hepatic stellate cells (HSCs), which then release more TGF‐β1 to act in an autocrine manner for further activation [30]. Consequences of HSC activation are discussed in the following sections.

Figure 4.1 Initiation of fibrosis. Damaged hepatocytes (HPCs) release mediators that stimulate sinusoidal endothelial cells (SECs) and Kupffer cells (KCs). KCs phagocytose dead and dying cells and release mediators that attract more macrophages. Some mediators (cytokines, growth factors) released by KCs and SECs activate quiescent hepatic stellate cells (HSCs) to change phenotype to a myofibroblast‐like cell that proliferates and secretes extracellular matrix (ECM) components. ROS, reactive oxygen species; DAMPs, damage‐associated molecular pattern molecules; GFs, growth factors.
4.2.2 Animal Models of Hepatic Fibrosis
Animal models have been instrumental in our understanding of the pathogenesis of liver fibrosis. In general, the histologic changes that occur in animal models are similar to those seen in humans and have shed light on potential molecular mechanisms. The most common models involve ligation of the bile duct or repeated treatment of mice or rats with carbon tetrachloride (CCl4) over a period of weeks [31]. Other less common but useful models include treatment with thioacetamide or chronic exposure to alcohol [32]. Dietary modifications, such as methionine/choline deficiency or high cholesterol diet, have also been used. In addition, a variety of genetic models, alone or in combination with nutritional changes, have been employed (reviewed in [33]). Through the use of animal models, much has been learned about the mechanism of fibrosis, which will be discussed throughout the remainder of the chapter.
4.2.3 Activation of Hepatic Stellate Cells
Myofibroblasts are critical to the development of liver fibrosis. They can arise from resident fibroblasts, such as portal fibroblasts, which are few in number in the liver, or from HSCs. Lineage tracing studies have revealed that activated HSCs represent the majority of myofibroblasts in livers of mice that had undergone bile duct ligation (BDL) or treatment with CCl4[34]. HSCs reside in the space of Disse, between the endothelium and hepatic parenchymal cells. Quiescent HSCs store lipids, especially vitamin A, which explains why they were formerly called “fat‐storing” cells or Ito cells. These cells take on a myofibroblast phenotype upon activation.
Myofibroblasts differ from quiescent HSCs in that they contain less lipid, are contractile, and proliferate at a greater rate. The myofibroblast phenotype of activated HSCs is also characterized by expression of α‐smooth muscle actin (αSMA), and this has been used in vitro and in vivo as a marker of HSC activation. The percentage of HSCs that express αSMA increases in patients with liver fibrosis, and hepatic expression of αSMA is elevated in livers of animals that have undergone BDL or treatment with CCl4[35].
Activated HSCs also express the gene encoding collagen type I, alpha 1 (COL1a1), and they subsequently release large amounts of collagen, elastin, and other ECM proteins [36–39]. The resulting change in composition and amount of ECM results in loss of fenestrae in sinusoidal endothelial cells (SECs) and changes in hepatic parenchymal cells, ultimately leading to disruption of liver architecture. Under normal circumstances, the amount of ECM present is maintained by a balance between its synthesis and its degradation by matrix metalloproteinases (MMPs). Activated HSCs upregulate and release tissue inhibitor of metalloproteinase 1 (Timp1), which inhibits MMP‐mediated degradation of ECM [40, 41]. In hepatic tissue taken from patients with chronic fibrotic liver disease, the level of expression of Timp1 correlated positively with the severity of disease [42, 43].
Another consequence of activation of HSCs is the release of cytokines and growth factors (e.g. TGF‐β1, PDGF, hepatocyte growth factor) and the upregulation of growth factor receptors [44–49]. The upregulation and release of TGF‐β1 contributes to the development of fibrosis through further activation of HSCs and stimulation of their production of collagen, so it is not surprising that the level of TGF‐β1 was positively related to the severity of fibrosis in human tissue [42, 43]. Intracellular signaling initiated by TGF‐β1 is critical to development of fibrosis.
Activation of HSCs is thought to involve both an initiation phase and a perpetuation phase [50]. The initiation phase is mediated by products released from neighboring cells, including cells that are damaged. Mediators include cytokines such as TGF‐β1, TNF‐α, and IL‐6, and growth factors such as PDGF and EGF, as well as lipid peroxides, and endothelin [51]. The perpetuation phase involves proliferation of HSCs and replacement of normal ECM with collagen type 1. Although a variety of mediators participate in the perpetuation phase, a primary stimulus for collagen production is TGF‐β1 [52]. The role of matrix stiffness in the HSC phenotype has subsequently been investigated. In vitro experiments using hydrogels, for which stiffness was controlled, have demonstrated that HSCs remained quiescent in a soft matrix, whereas in a stiff matrix, their lipid droplet content was reduced, and they expressed collagen type 1 and αSMA [53, 54]. Furthermore, softening the matrix led to return to a quiescent phenotype. Thus, the stiffening of tissue that accompanies fibrosis likely contributes to HSC activation. Interestingly, mice treated with CCl4 exhibited increased liver stiffness prior to evidence of fibrosis [55]. Clearly, the complex cell–cell and cell–environment interactions can be investigated to help elucidate the progression of disease states, like fibrosis.
4.2.4 Epithelial‐to‐Mesenchymal Transition (EMT)
Other cell types may also give rise to myofibroblasts. One potential mechanism to facilitate this is epithelial‐to‐mesenchymal transition (EMT). Fibrocytes are inactive mesenchymal circulating cells derived from bone marrow, and they can be found in liver after BDL injury or exposure to CCl4. Studies have suggested that secretions from fibrocytes may have the potential to induce EMT. While they have been shown to express collagen and αSMA, their contribution to the pathology has been debated [56–60].
Myofibroblast‐like cells can also arise from hepatic parenchymal cells (hepatocytes) and cholangiocytes though the EMT process [61–64]. EMT is effected through several transcription factors, including Snail1 and Snail2. These transcription factors repress transcription of genes associated with cell adhesion, such as cadherins. As a result, cells dissociate from the basement membrane, lose intercellular adhesion complexes, and take on mesenchymal properties, including motility. Exposure of hepatocytes to TGF‐β1 was accompanied by a loss of E‐cadherin and an increase in αSMA and vimentin [65, 66]. Hepatocytes isolated from CCl4‐treated animals displayed a myofibroblast phenotype [64]. Furthermore, hepatocytes that had undergone EMT contributed to liver fibrosis in CCl4‐treated mice [67]. On the other hand, the hypothesis that EMT contributes to the population of myofibroblasts in fibrotic liver has been challenged by studies that demonstrated a lack of conversion of hepatocytes or cholangiocytes to collagen‐expressing cells in livers of CCl4‐treated mice [68, 69]. Additional research on this topic is needed to clarify this disparity.
4.2.5 Other Cellular Interactions in Fibrosis
Although HSCs play a critical function in the development of liver fibrosis, other cell types, including KCs, SECs, natural killer (NK) cells, and hepatocytes, participate. There is evidence of extensive crosstalk among cell types [70]. KCs, or resident tissue macrophages, actually play a dual role in liver fibrosis. Early in the development of fibrosis, they release pro‐inflammatory and pro‐fibrotic mediators, such as ROS, ILs, and TGF‐β1, contributing to the pathogenesis. Later, macrophages produce mediators, such as MMPs, that promote resolution of fibrosis. A population of macrophages that contributes to resolution of fibrosis was observed in livers of CCl4‐treated mice, and deficiency in this population inhibited tissue remodeling [71]. Clearance of necrotic hepatocytes is critical to restoration of normal tissue after fibrosis develops. One hypothesis is that macrophages involved in the restoration of normal tissue are those that have phagocytosed dying cells. Macrophages exposed in vitro to debris from dead hepatocytes expressed a phenotype similar to that of macrophages that mediate resolution of liver fibrosis. In addition, the ability of macrophages to clear dead cells after exposure to CCl4 was impaired in mice with reduced levels of HIF‐1α in HSCs [72]. This defect leads to hepatic deposition of collagen. These results suggest that HIF‐1α signaling in HSCs is important in determining the phenotype of macrophages during fibrosis.
Hepatic SECs are characterized by many fenestrae and a discontinuous basement membrane. This allows blood‐borne substances access to the hepatocytes. Like other endothelial cells, SECs express nitric oxide (NO) synthase; SEC‐derived NO contributes to changes in blood flow and pressure. Fibrosis causes loss of fenestrae and thickening of the basement membrane in a process termed “capillarization,” which is accompanied by a reduction in NO release from SECs. In the absence of liver disease, SECs are thought to help maintain HSCs in a quiescent state, which is supported by the observation that HSCs are resistant to activation when cocultured with SECs. The loss of SEC‐derived NO might contribute to HSC activation during fibrosis, although there is no direct evidence for that relationship [73, 74]. NO signals through soluble guanylate cyclase and protein kinase G. Activation of soluble guanylate cyclase slows progression of fibrosis in thioacetamide‐treated rats. Activation of soluble guanylate cyclase inhibited activation of HSCs in vitro, and this effect was greater in the presence of SECs. However, the progression of fibrosis through this signaling pathway was not completely dependent on NO [75, 76].
As mentioned above, fibrosis is associated with tissue hypoxia and activation of HIF‐1α. VEGF is a HIF‐1α‐regulated gene that is expressed by hypoxic hepatocytes and HSCs. VEGF from hepatocytes and HSCs contributes to the maintenance of SEC fenestrae through NO‐dependent and NO‐independent mechanisms [75]. NO‐dependent VEGF signaling might underlie some of the actions mediated by guanylate cyclase, which is not surprising considering its role in angiogenic responses during fibrosis.
NK cells are innate lymphoid cells that reside in several tissues, including liver. As their name implies, NK cells kill tumor and other cells, in addition to other functions. In effecting these functions, they produce various cytokines, including interferon‐γ (IFN‐γ), and they interact with other cells within the liver. In general, NK cells are thought to play an anti‐fibrotic role, primarily by killing activated HSCs through release of IFN‐γ and signal transduction involving TNF‐related apoptosis‐inducing ligand (TRAIL). Cytotoxic NK cells accumulate in livers of patients with fibrosis [77]. When HSCs and NK cells isolated from patients with liver fibrosis were cocultured, NK cells became activated and induced apoptosis in the HSCs [78, 79]. The cytotoxic potential of NK cells toward HSCs decreased with increasing disease severity [78], suggesting that the more effective these cells are at eliminating HSCs, the more fibrosis is limited. Mice lacking NK cells developed more hepatic fibrosis in response to CCl4 than control mice [80]. Furthermore, activation of NK cells in a model of hepatic fibrosis was protective. When mice were fed a diet containing 3,5‐diethoxycarbonyl‐1,4‐dihydrocollidine to induce cholestatic liver fibrosis, treatment with polyinosinic–polycytidylic acid (poly I : C) to activate NK cells resulted in death of HSCs and a reduction of liver fibrosis. This result depended on NK cells and IFN‐γ [81]. Treatment with poly I : C also reduced CCl4‐induced liver fibrosis. It should be noted, however, that poly I : C also affects function of dendritic cells and B cells [82, 83], so the effect may be through more cell types than just NK cells.
4.2.6 Intracellular Signaling Pathways Critical to Liver Fibrosis
4.2.6.1 TGF‐β1
As previously mentioned, the activation of HSCs is affected primarily by TGF‐β1. TGF‐β1 is a member of the TGF‐β superfamily of proteins that includes activins, inhibins, BMPs, and other proteins. TGF‐β1 is synthesized as a propeptide. The latent form is bound to latency‐associated peptide (LAP) and latent TGF‐β binding proteins (LTBPs), forming a large complex. TGF‐β1 can be activated by integrins, MMPs, plasmin, ROS, and other substances, as well as by myofibroblast contraction [27, 84–87].
Activated TGF‐β1 binds a heterotetrameric complex containing two types of cell surface serine/threonine‐specific protein kinase receptors, the TGF‐β receptors type I and type II (TBRI and TBRII). Binding of TGF‐β1 induces phosphorylation of TBRI by TBRII, which initiates intracellular signaling through phosphorylation of intracellular regulators (Figure 4.2).
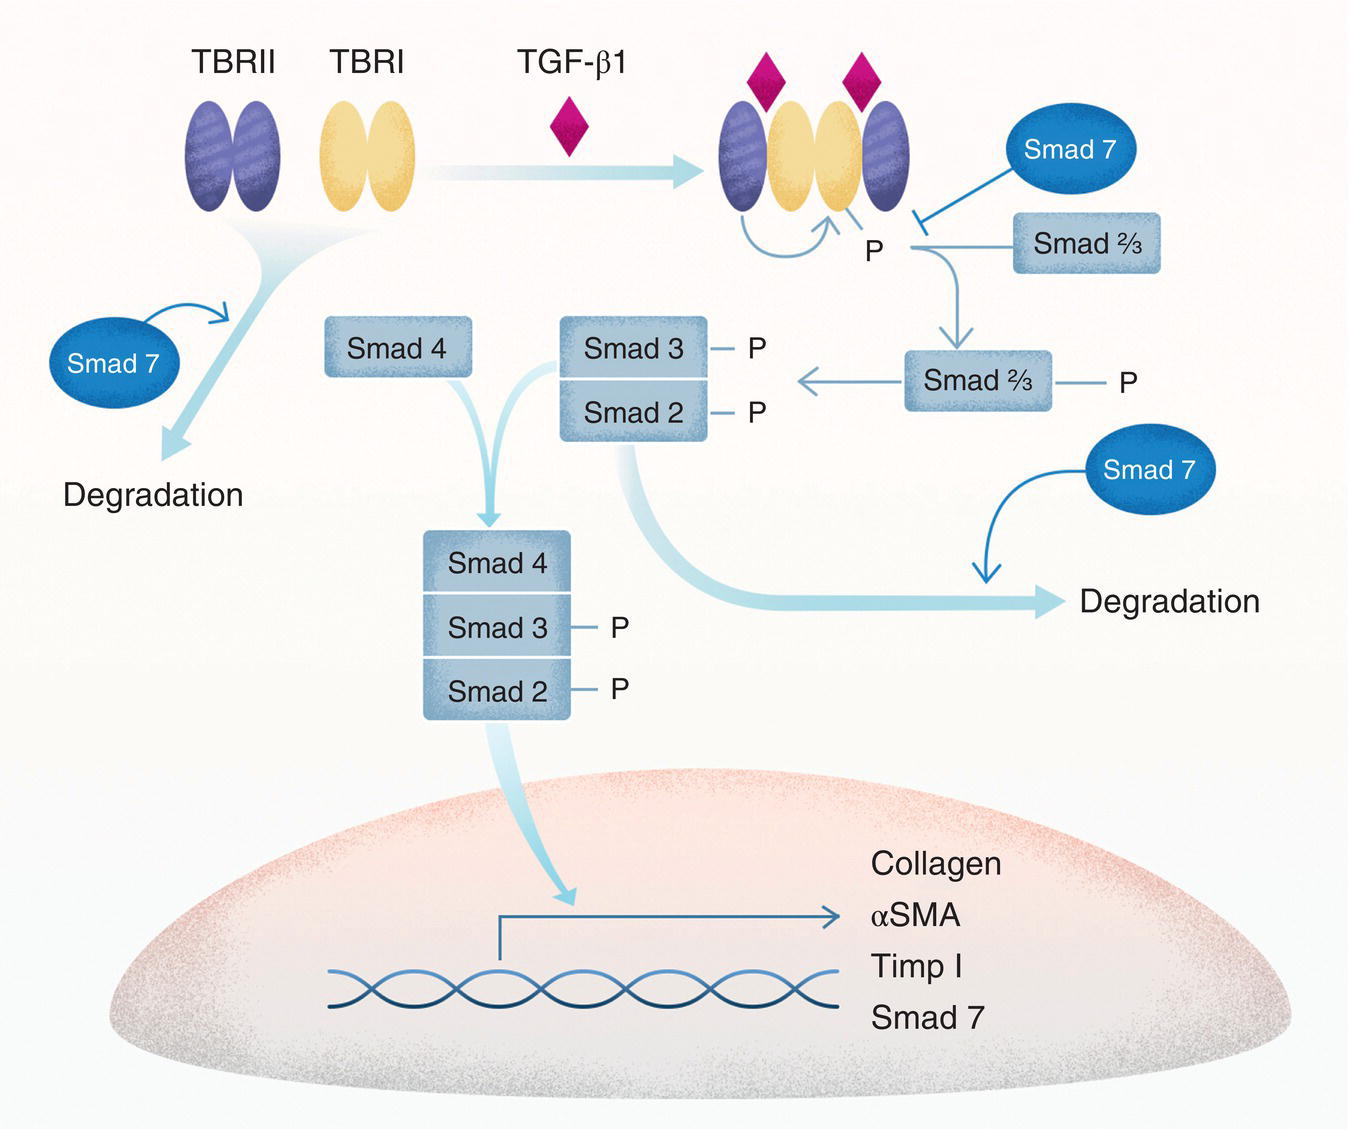
Figure 4.2 Smad‐dependent TGF‐β1 signaling. TGF‐β1 binds to two receptors, TBRI and TBRII. These two receptors exist as dimers, and, when ligated by TGF‐β1, they form a complex capable of phosphorylating Smad proteins. Phosphorylated Smad2 and Smad3 dimerize and associate with Smad4 to form a complex that translocates to the nucleus and acts as a transcription factor to regulate transcription of several genes involved in fibrosis. Smad7 negatively regulates the signaling process by inhibiting binding of Smad proteins to TBRI and by enhancing degradation of TBRI and Smad2 proteins. αSMA, α‐smooth muscle actin; Timp1, tissue inhibitor of metalloproteinase 1.
The TGF‐β1 signaling response involves Smad proteins, which are the main signal transducers for the TGF‐β family. Smad proteins are either receptor‐regulated (R‐Smads; Smad1, Smad2, Smad3, Smad5, and Smad8), inhibitory (Smad6 and Smad7), or common (Smad4). They contain two Mad Homology (MH) domains separated by a linker region. MH1 binds DNA, whereas MH2 binds to TGF receptors or other MH2 domains in coactivators and corepressors. When TGF‐β1 binds to its receptor, phosphorylation of TBRI reveals its Smad binding site, allowing association of R‐Smads and their phosphorylation at C‐terminal serine domains. Phosphorylation creates a motif capable of binding MH2 domains on R‐Smads or on Smad4 [88, 89]. Once phosphorylated, Smad2 and Smad3 associate with Smad4 and translocate to the nucleus where the complex functions as a transcription factor [88–91]. Although free Smads move easily between the cytoplasm and the nucleus using nuclear porins, phosphorylated Smads use a variety of nuclear transport factors [92, 93].
A conserved domain known as MH1 facilitates sequence‐specific Smad binding to DNA. Phosphorylation of the MH1 domain of Smad2 or Smad3 inhibits DNA binding [94], illustrating one method by which signal transduction can regulate the activity of Smads. Smad‐regulated genes include those encoding collagen, αSMA, E‐cadherin, and Timp1 [40, 41]. The gene for inhibitory Smad7 is also regulated through this pathway; its transcription and translation lead to downregulation of Smad signaling.
Interaction among Smad proteins determines the outcome of signaling. For example, Smad2 and Smad3 might not contribute equally to fibrosis. In human fibrotic tissue and cells, both Smad2 and Smad3 are phosphorylated [29]. In Smad3 knockout mice, treatment with CCl4 elicited a smaller increase in expression of collagen mRNA, although αSMA expression was increased relative to wild‐type (WT) mice [95]. Results were similar in HSCs isolated from Smad3‐deficient mice. Levels of collagen and Timp1 were decreased in TGF‐β1‐treated human HSCs deficient in Smad3. Conversely, overexpression of Smad3 increased the expression of collagen and Timp1 and decreased expression of MMP‐2 in vitro[29]. Manipulation of Smad2 in vitro had the opposite effect of that described for Smad3 [29, 95]. In extrahepatic tissues, deficiency of Smad3 blocked EMT and fibrosis, while Smad2 deletion increased fibrosis [96, 97]. Both functioning Smad2 and Smad3 are required for transcriptional activity, as evidenced by a lack of nuclear translocation in the absence of either [29, 95]. These results suggest a degree of complexity in Smad signaling at the level of interaction of Smads. The essential role of Smad4 in fibrosis is illustrated by the observation that deletion of Smad4 inhibits TGF‐β1‐induced ECM deposition by mesangial cells [98].
Smad7 downregulates Smad signaling by regulating binding of Smads to TBRI, thereby preventing their phosphorylation. In addition, Smad7 facilitates the degradation of Smad2 and TBRI by recruiting ubiquitin‐specific processing protease 15 and Smad ubiquitination regulatory factors (SMURFs) [99, 100], which target the proteins for degradation. In CCl4‐induced liver fibrosis, loss of Smad7 enhanced HSC activation and development of fibrosis, but overexpression of Smad7 diminished fibrosis [101, 102].
4.2.6.2 Kinase Pathways Involved in Fibrotic Responses
Activation of protein kinases also plays a role in development of liver fibrosis. TGF‐β1 increases phosphorylation of ERK, c‐Jun N‐terminal kinase (JNK), and p38 MAPKs [103–105]. Thioacetamide‐ or CCl4‐induced fibrosis in mice was associated with activation of ERK [106], and interference with ERK signaling reduced expression of collagen [107]. Furthermore, transcriptomic analysis of human keratinocytes revealed a role for ERK‐regulated pathways in cell adhesion and motility; inhibition of MAPK signaling inhibited EMT [103, 108]. Conversely, activation of ERK can lead to phosphorylation of Smad proteins in the linker region that causes their retention in the cytoplasm [109], thereby inhibiting their transcriptional activity.
PI3 kinase/Akt signaling is also involved in fibrosis, especially through effects on EMT. Loss of Akt is associated with loss of EMT phenotype and increased expression of E‐cadherin [110]. Snail1 and Snail2 are transcription factors that are upregulated through TGF‐β1 signaling (Figure 4.3). Their overexpression induces EMT [111, 112]. They complex with corepressors and histone deacetylase to reduce expression of E‐cadherin. Akt signals through nuclear factor κB (NF‐κB) to induce transcription of SNAI1, the gene for Snail1 [113]. Akt also inhibits glycogen synthase kinase‐3β (GSK‐3β), which targets Snail1 protein for degradation [114]. Accordingly, Akt both increases Snail1 protein synthesis and inhibits its degradation, permitting Snail‐mediated EMT. In addition, Akt inactivates proteins (e.g. heterogeneous nuclear ribonucleoprotein E1 [hnRNP E1]) that suppress EMT [115]. Furthermore, in tumor cells, Akt activates mammalian target of rapamycin (mTOR) complexes 1 and 2, both of which contribute to EMT [116, 117].
Figure 4.3 Akt signaling in epithelial‐to‐mesenchymal transition (EMT). TGF‐β1 increases expression of SNAI1, the gene encoding Snail1, and also activates PI3 kinase (PI3K). Signaling through PI3K activates Akt, which also upregulates SNAI1, leading to increased Snail1 that promotes EMT. Akt also inhibits glycogen synthase kinase‐3β (GSK‐3β), which normally targets Snail for degradation. In addition, Akt inhibits a number of proteins such as heterogeneous nuclear ribonucleoprotein E1 (hnRNP E1) that repress EMT.
4.2.6.3 HIF‐1α
As mentioned previously, tissue hypoxia occurs during fibrosis, likely from diminished hepatic blood flow as well as deposition of fibrin in sinusoids [118, 119]. Hypoxia leads to activation of HIF‐1α. HIF‐1α was increased in livers of mice subjected to BDL [120]. This was accompanied by an increase in mRNA for collagen, αSMA, and PDGF. These responses were reduced in livers of mice deficient in HIF. In patients with fibrotic liver disease, HIF‐1α protein was detected in macrophages, hepatocytes, and fibroblasts [121], and experimental evidence suggests that activation of HIF‐1α in KCs contributes to hepatic fibrosis. In mice with myeloid cell‐specific deficiency in HIF‐1α or HIF‐1β, BDL led to smaller increases in expression of collagen and αSMA [122]. Furthermore, exposure of isolated KCs to hypoxia led to increased mRNA for PDGF and VEGF; this response was absent in KCs isolated from HIF‐1β‐deficient mice [122].
4.2.6.4 miRNA
MicroRNAs (miRNAs) are small noncoding RNAs that regulate the translation and transcription of genes. The role of miRNAs in disease has been a relatively recent subject of research exploration. Several miRNAs have been suggested to play different roles in the pathogenesis of hepatic fibrosis, although no causality has been demonstrated directly. In human tissue, expression of miR‐199a, miR‐199a*, miR‐200a, and miR‐200b tracked positively with severity of fibrosis [123]. Similarly, miR‐21 has a positive effect on activation of HSCs as well as EMT [124, 125].
On the other hand, some miRNAs correlate negatively with fibrosis. Microarray analysis of livers from CCl4‐treated mice detected 31 differentially expressed miRNAs, of which the majority were decreased in expression compared to control mice [126]. Among these, decreased expression of miR‐29b correlated with decreased liver fibrosis. Expression of miR‐29 family members was also decreased in livers and plasma from patients with fibrosis/cirrhosis [126]. miR‐29 family members were highly expressed in HSCs isolated from livers of control mice, and expression was decreased by exposure to TGF‐β1 in vitro. Overexpression of miR29b in HSC led to decreased expression of Col1a1 but did not affect Timp1 or αSMA expression. Similar results were observed with miR‐122 [127].
4.2.6.5 Toll‐Like Receptors (TLRs)
Toll‐like receptors (TLRs) are receptors for pathogen‐associated and damage‐associated molecular pattern molecules. They mediate responses to inflammagens, such as bacterial products (e.g. lipopolysaccharide) and molecules released by dying cells (e.g. high‐mobility group box 1 protein). Both TLR2 and TLR4 have been implicated in fibrogenesis. Activation of TLR4 signaling pathways leads to decreased expression of the BMP and activin membrane‐bound inhibitor homolog (Bambi), which is a pseudoreceptor for TGF‐β1 that lacks intracellular kinase activity. Reductions in Bambi play a permissive role for profibrogenic actions of TGF‐β1 on HSCs [128]. In TLR2‐deficient mice treated with CCl4, hepatic fibrosis, HSC activation, and collagen deposition were reduced, as were inflammation and necrosis [129]. Similar results were observed in TLR5‐deficient mice [130]. These latter two studies demonstrate the role of inflammation in the development of fibrosis. Taken together, these results suggest that inflammatory signaling through TLRs can contribute to the pathogenesis of liver fibrosis.
4.3 Cancer Drug Resistance: Complex Cellular and Population Changes
Modern cancer research is based on a deep understanding of signal transduction mechanisms. Many of the genetic mutations, amplifications, or chromosomal translocations that cause cancer (i.e. oncogenes or tumor suppressors) are in signal transduction proteins as described in Chapter 2. Oncogenic mutations occur in a broad array of receptors (e.g. receptor tyrosine kinases [RTKs]), many kinase pathways such as the mitogen‐activated kinase (MAPK) and cell cycle‐dependent kinase (CDK) mechanisms, small GTPases (e.g. KRAS), and transcription factors (e.g. MYC). Tumor suppressors include phosphatases (e.g. PTEN) and GTPase deactivators (e.g. neurofibromatosis 1 [NF1]). As might be expected, the mutated oncoproteins are excellent drug targets when inhibitors can be found. EGFR is commonly mutated in non‐small cell lung cancer (NSCLC), and EGFR tyrosine kinase inhibitors (TKIs) have become a valuable treatment strategy for these tumors [131–133]. In melanoma, the MAPK pathway is frequently mutated with nearly 60% of melanomas having mutations in the serine/threonine kinase BRAF. Inhibitors of BRAF (BRAFi) produce excellent clinical responses in BRAF‐mutant melanomas [134].
Drug resistance, however, remains a major hurdle in achieving durable therapeutic responses for EGFR and BRAFi and for virtually every “targeted” cancer therapy that is based on signal transduction mechanisms. Drug resistance can be divided into two broad classes: (i) intrinsic resistance and (ii) acquired resistance. The exact definition of intrinsic versus acquired resistance is still debated and depends on whether the cancer is being discussed on a tumor level or on a cellular level. For example, a point mutation found in 0.01% of tumor cells may promote intrinsic resistance to a drug on the cellular level for those rare cells with a resistance‐causing mutation. For the tumor, resistance to the drug would be acquired as the mutant cell clonally expands. Due to this confusion, another way to stratify resistance mechanisms is to consider genomic resistance and non‐genomic resistance mechanisms.
4.3.1 Genomic Resistance Mechanisms
Genomic resistance mechanisms are typically caused by mutations, copy number alterations (CNAs), or chromosomal translocations. Cells that harbor genomic resistance mechanisms may only comprise a small subpopulation of cells in drug‐naïve tumors (Figure 4.4). For lung cancers treated with EGFR TKIs, one frequently observed resistance mechanism is the so‐called “gatekeeper” mutation in EGFR, in which a single amino acid is altered from threonine to methionine (i.e. EGFRT790M) [135–137]. This prevents drug binding and causes loss of effectiveness to first‐generation EGFR inhibitors. Finally, activation of parallel signaling pathways can promote drug resistance, since activation of the parallel pathway may phenocopy the role of the drug target pathway. An example of this is deletion or mutation of PTEN, which promotes resistance to a wide range of targeted therapies via activation of the PI3K/Akt pathway [138–140].

Figure 4.4 Comparison of genomic and non‐genomic resistance mechanisms. Genomic – rare cells within a non‐small cell lung cancer (NSCLC) tumor contain EGFRT790M mutations. Upon treatment with an EGFR TKI, such as erlotinib, cells with EGFRT790M mutations can continue proliferating, leading to the selection for these cells within the bulk tumor population. Ultimately this results in tumor relapse. Non‐genomic – upon drug treatment, the signaling circuitry within cancer cells is altered. These alterations allow for cancer cells to retain their ability to proliferate even in the presence of drug treatment. This potentially can affect all cells in the tumor at once.
While drug‐naïve tumors may have only a few cells with this mutation, drug treatment kills the cells with WT EGFR, providing selective pressure that gives a growth advantage to the EGFRT790M cells, allowing for their clonal expansion. Similarly, various estrogen receptor (ER) mutations in breast cancer can promote resistance to ER antagonists [141]. In both cases, drug resistance results from direct genomic modification of the drug target to result in signaling pathway reactivation.
Pathway reactivation can also result from mutation or CNAs in genes which encode proteins upstream or downstream of the drug target (Figure 4.5). BRAFi initially produce excellent responses in BRAF‐mutant melanomas [134], but resistance develops rapidly. For example, one common mechanism of resistance to BRAFi is mutations or CNAs in NRAS or MEK, which flank BRAF in the pathway [142, 143]. Because of this, MEK inhibitors (MEKi) have also been used (see below) with significant benefit.
Figure 4.5 MAPK pathway reactivation results in BRAF inhibitor resistance in melanoma tumors. Physiological – signaling diagram detailing the MAPK pathway under physiological conditions. BRAF‐mutant – BRAFV600E mutations result in constitutive MAPK activation regardless of upstream stimulus. Inhibition of BRAFV600E results in MAPK pathway inactivation and suppression of proliferation. MAPK‐reactivating mutations – selection for cells with NRASQ61K mutations, NRAS amplification, and MEK mutations results in tumor recurrence since these genomic alterations result in BRAFV600E‐independent MAPK pathway reactivation. MAPK‐reactivating mutations are located within the shaded region of the diagram.
4.3.2 Non‐genomic Mechanisms
Non‐genomic mechanisms, such as epigenetic remodeling or rewiring of signaling circuitry, can also result in drug resistance. Like genomic resistance mechanisms, non‐genomic resistance mechanisms can also result in pathway reactivation or activation of parallel signaling mechanisms. Inhibition of one RTK may lead to compensatory upregulation of other RTKs, resulting in reactivation of downstream signaling pathways. In other cases, specific epigenetic states poise cancer cells to upregulate a resistance gene program in response to drug treatment [144]. A common thread among many non‐genomic resistance mechanisms is that drug treatment induces specific alterations in the cell's signaling circuitry. These mechanisms most commonly fall in the category of acquired resistance mechanisms.
4.3.3 Non‐cancer Drug Resistance Paradigms
Drug resistance is not a problem that is unique to cancer. For example, bacterial drug resistance poses a major problem in both livestock management [145] and human health [146]. These non‐cancer systems can provide some guidance to future targeted cancer therapies. One success story in combatting drug resistance is illustrated by the development of modern HIV therapeutic strategies. In this case, the use of drug combinations provides dramatically prolonged disease suppression, sometimes for the remainder of the patient's lifetime [147, 148]. While such an approach works well for bacterial or viral drug targets, success using these types of approaches has remained elusive in cancer. This is because cancer cells exploit the same signaling pathways that nonmalignant cells depend on; many of these drug combinations can have significant toxicity. This issue can be partially blunted by developing mutation‐specific therapeutic strategies. For example, the BRAFi vemurafenib has approximately 10–100‐fold selectivity for the cancer‐specific mutant BRAFV600E/K over the normal protein BRAFWT[149], boosting the therapeutic index.
One mechanism of bacterial antibiotic resistance is expression of multidrug efflux pumps. Similar proteins, such as the multidrug resistance protein 1 (MDR1) (gene name ABCB1), are expressed on the surface of cancer cells and promote resistance to a wide range of therapeutics by preventing the accumulation of drug within the cell [150]. Unfortunately, in humans MDR1 inhibitors display significant toxicities at therapeutically relevant doses, which highlights yet another challenge in targeting cancer drug resistance mechanisms [151].
4.3.4 Tumor Heterogeneity as a Driver of Drug Resistance
As was first proposed by Nowell in 1976, tumors become substantially more heterogeneous during disease progression as different cellular clones acquire new genomic and non‐genomic alterations [152]. These tumor cell clones are spatially heterogeneous, meaning that clonally similar tumor cells are located in close proximity to each other within a tumor [153]. This observation is not surprising, given what we now know about how sequential acquisition of new alterations in cancer cells contributes to oncogenesis and tumor progression. In most cases, the targeted therapies used in the clinic were designed to target the “driver oncogene.” These approaches fail to account for the considerable intratumor heterogeneity, ultimately leading to selection for clones with drug‐resistant characteristics.
Advances in sequencing technology, especially the ability to determine gene expression in an individual cell (i.e. single‐cell transcriptomic profiling), have led to a revolution in our understanding of tumor heterogeneity and the clonal evolution of cancer. Most major tumor types have been transcriptomically characterized on a single‐cell level [154–158]. In all cases, tumor cells can be stratified into clusters based on their transcriptional signatures. In melanoma, two cell states were identified, which show different gene expression programs. One has high expression of the protein kinase AXL (AXLHigh), and the other has high expression of MITF, a transcription factor that promotes melanocyte differentiation (MITFHigh) [156]. Cells in the AXLHigh cell state show resistance to MAPK inhibitor therapy (i.e. MAPKi, which consists of BRAF and/or MEKi alone or in combination) [159]. While each tumor could be classified as predominantly AXLHigh or MITFHigh through bulk RNA‐Seq analysis, drug‐resistant AXLHigh cells were present in all tumors to some degree. This was found even in drug‐naïve tumors that had a MITFHigh signature on a bulk transcriptomic level. This point is important, since bulk RNA‐Seq analysis would suggest that a MITFHigh tumor would likely be sensitive to MAPKi therapy; however, owing to the presence of a subpopulation of resistant cells, tumor relapse would occur eventually.
Single‐cell analysis of the tumor microenvironment is also important for studying drug resistance. It has become clear that cancer progression, metastasis, and treatment response depend on other cells in the vicinity of the cancer as well as the cancer cells themselves [160–163]. Cells in the tumor microenvironment, or stroma, that may affect these processes can include fibroblasts, macrophages, T cells, etc. [164–168]. In many contexts, including response to BRAFi, tumor‐killing T lymphocytes (CD8+ T cells) are pivotal for maintaining the drug response. Depletion or exhaustion of CD8+ T cells can be recognized by reduced cell numbers or an altered transcriptional program including changes in expression of T‐bet, eomesodermin (EOMES), and B lymphocyte‐induced maturation protein 1 (BLIMP1). This results in drug resistance [169, 170]. As with cancer cells, there is a high degree of heterogeneity in CD8+ T cells, especially within the T‐cell receptor (TCR), which determines the selectivity of immune recognition. Characterizing the heterogeneity and clonal expansion of these cells can provide important information on mechanism and prediction of prolonged drug responses. Using single‐cell sequencing to identify tumors with an abundance of exhausted T cells, or simply a dearth of anti‐tumor T cells, will help identify tumors that may be intrinsically resistant to select targeted therapies.
4.3.5 Mutational Drivers of Drug Resistance
As discussed above, drug resistance of NSCLC to EGFR TKIs is common due to the EGFRT790M mutation [135–137]. This mutation is located within the catalytic cleft of the tyrosine kinase domain of EGFR. Co‐crystallization studies have demonstrated that the T790 residue is critical for inhibitor binding. Increased steric hindrance, due to methionine's bulkier side chain, prevents drug binding and also increases the affinity of EGFR for its substrate ATP [171]. What is interesting is that this mutation is often present in only a small subpopulation of cells. In one of the original studies of the EGFRT790M mutation, it was only detected in ~1% of cells [137]. Other studies have found this mutation to be even rarer. Despite this, 50–60% of patients treated with EGFR TKIs will relapse with EGFRT790M mutations [172]. What makes the identification of EGFRT790M such a success story is the development of second‐line therapeutics strategies to combat this drug resistance. Tumors that developed resistance to first‐line EGFR inhibitors such as erlotinib or gefitinib could be treated with second‐generation EGFRT790M inhibitors such as rociletinib and osimertinib. Most EGFRT790M‐positive tumors respond strongly to one of these second‐generation inhibitors [173, 174]. These findings are an excellent example of how identification of drug resistance mechanisms can lead to the development of new therapeutic options that substantially improve patient outcome.
Another success story in combatting drug resistance clinically is the development of BRAF + MEKi dual therapy. The most common mechanism of resistance to BRAFi is the emergence of secondary mutations that reactivate the MAPK pathway ([175] and see Figure 4.5). However, unlike the EGFRT790M mutations in lung cancer, there is a wide range of MAPK‐reactivating mutations that emerge in melanoma. The most common alterations include NRAS or BRAF amplification, NRASQ61K mutations, NF1 mutation/deletion, or MEK mutations. In all cases, these genomic alterations result in MAPK pathway activation. Due to this, MEKi were developed and used in combination with BRAFi [176, 177]. It may initially appear counterintuitive to concurrently use two different inhibitors that target the same signaling pathway. However, the MEKi delays or prevents MAPK‐reactivating resistance mechanisms from arising, since all these mutations ultimately signal downstream to activate MEK/ERK. Unfortunately, tumors still become resistant to BRAF + MEKi. One possibility is that MEKi are typically used at low concentrations due to on‐target toxicity issues, resulting in incomplete MAPK pathway inactivation in vivo. Alternatively, it could be due to the emergence of MAPK‐independent resistance mechanisms.
The mutations that drive EGFR TKI resistance or BRAFi resistance are just two examples of mutationally driven resistance mechanisms. However, there are mutationally driven resistance mechanisms for virtually every targeted cancer therapy that blocks a signal transduction mechanism. For example, mutations in the ER promote resistance to ER antagonists [141], and mutations in or deletions of the retinoblastoma tumor suppressor render cells nonresponsive to cell cycle checkpoint inhibitors such as blockers of CDK4/6 [178]. Thus far, only the most prominent mutations in well‐studied genes have been characterized for their role in resistance to targeted therapies. However, tumors can have hundreds or thousands of mutations, and few are understood in terms of functional consequences. To make matters worse, these mutations may only be present in a fraction of tumor cells and may consequently be undetectable by bulk sequencing. Even if a mutation is identified and a causal link is established between that mutation and drug resistance, it is unlikely that there is an FDA‐approved therapeutic avenue to target that resistance mechanism. From these examples, it is evident that while we have made enormous progress in understanding how genomic alterations contribute to drug resistance, there is still a long way to go before we can transform such knowledge into clinical benefit for patients.
4.3.6 Drug‐Induced Rewiring of Signaling Networks as a Mechanism of Drug Resistance
Until now, we have discussed mutationally driven resistance mechanisms. On a cellular level, these mechanisms are mostly static, in the sense that drug treatment does not specifically induce the mutations; rather the drug simply selects for resistant cells. In many cases, drug treatment can specifically and dynamically induce changes in signaling pathway activation and can rewire the signaling networks within a cell without inducing genomic alterations. The time scales of these alterations can vary greatly from seconds to days or weeks. This may involve epigenetic mechanisms or stable alterations in gene transcription programs. Since this broad class of drug resistance mechanisms is induced by drug treatment, these mechanisms fall under the umbrella of acquired resistance mechanisms.
Most BRAF‐mutant melanoma tumors respond to the BRAFi vemurafenib, but this response is not observed in BRAF‐mutant colorectal cancer (CRC) patients even though both tumor types harbor the same mutation. One reason for this lack of response is because CRC tumors adaptively activate EGFR in response to BRAF inhibition [179]. This compensatory EGFR activation results in activation of the PI3K/Akt pathway and reactivation of the MAPK pathway, which subsequently promotes vemurafenib resistance (Figure 4.6). One might then assume that simultaneous inhibition of BRAF and EGFR may be enough to prevent drug resistance. This strategy works initially, but, ultimately, patients still relapse on these therapies. In some cases, relapse on anti‐EGFR + BRAF therapy results from compensatory activation of other RTKs such as c‐Met.

Figure 4.6 Compensatory EGFR activation results in BRAF inhibitor resistance. As in melanoma tumors, BRAFV600E mutations in colorectal cancer result in constitutive MAPK pathway activation and constitutive pro‐proliferative signals. Inhibition of mutant BRAF with vemurafenib suppresses proliferation. However, colorectal cancer cells develop resistance to these therapies via feedback activation of EGFR. Ultimately EGFR signals by activating the BRAF‐related kinase CRAF to reactivate the MAPK pathway. EGFR also activates the PI3K/Akt pathway. Due to these actions, the cancer cells can proliferate even in the presence of vemurafenib. This ultimately results in drug resistance and tumor relapse.
Resistance to targeted therapies through activation of RTKs appears to be a recurrent theme in cancer biology. In addition to CRC, melanoma tumors can also develop resistance to BRAFi through activation of RTKs such as EGFR, PDGFR, IGF‐1R, and AXL. Ultimately, this results in compensatory reactivation of the MAPK pathway through a BRAF‐independent mechanism or via activation of parallel pathways such as the PI3K/Akt pathway [180]. Due to the degree of similarity in RTK effector pathways, compensatory activation of other RTKs is also a common bypass mechanism of resistance to anti‐RTK targeted therapies [181]. Earlier we discussed how selection for the rare NSCLC cell that harbors an EGFRT790M mutation promotes resistance to EGFR inhibitors. However, this resistance mechanism is not present in all tumors, and some cancers develop resistance through compensatory activation of other signaling pathways. For example, in lung cancer, activation of the RTK AXL results in resistance to the EGFR inhibitor erlotinib [182]. Also, signaling by fibroblast growth factor 2 (FGF2) acting through the fibroblast growth factor receptor 1 (FGFR1) promotes resistance to the EGFR inhibitor gefitinib through an autocrine/paracrine loop [183]. There are other mechanisms of compensatory RTK activation that are not necessarily drug induced, such as selection for NSCLC cells that harbor MET amplification [184]. Ultimately, activation of any of these RTKs results in activation of signaling pathways involved in cell proliferation such as the MAPK pathway or the PI3K pathway.
4.3.7 Parallel Pathways and Combination Treatments
As one looks at the problem of cancer drug resistance, patterns begin to emerge. Non‐genomic drug resistance does not always occur simply by stochastic activation of other signaling pathways. Rather, drug treatment can induce specific alterations in the cellular signaling circuitry. Some of these are found repeatedly in different types of tumors. Cancer is a complex disease, and, to simplify it, we often think of each signaling pathway in isolation; the reality is that signaling pathways within a cell are generally linked to each other in complex networks. By learning how these signaling pathways interact, we can begin to understand how cancer cells adaptively respond to drug treatments. This information can be exploited to develop new therapeutic approaches to prevent or reverse drug resistance. For example, inhibition of one signaling pathway may render cells exquisitely sensitive to inhibition of another, a phenomenon known as “synthetic lethality.” This can be due to effects of two different drugs on the same pathway or different pathways. The latter is frequently used in antiviral or antibacterial therapies where drug combinations target multiple pathways with mutually exclusive resistance mechanisms.
Alternatively, consider a situation in which two distinct signaling pathways can promote proliferation of a cancer cell (Figure 4.7). These pathways function as a logical OR gate where either one being “on” results in cancer. Specifically, we could have a situation in which Pathway 1 includes proteins “A,” “B,” “C,” and “D” and Pathway 2 includes proteins “E,” “F,” “G,” and “H.” Pathway 1 could be the oncogenic driver in the cancer cell through an activating mutation in any of the four proteins, A–D. Activation of this pathway results in uncontrolled proliferation and tumor growth. Inhibiting signal transduction by this pathway with a small molecule inhibitor prevents the cell from proliferating. Activation of a second “parallel” signaling pathway may also be able to promote proliferation without the need for activation of Pathway 1. If this occurs when a cancer is treated with an inhibitor of Pathway 1, this would represent drug resistance. Such resistance mechanisms could occur through an adaptive response, wherein drug treatment actively induces the compensatory activation of the other signaling pathway. Alternatively, cells could have activation of Pathway 2 through a mutational mechanism. In this case, rare cells with a mutation in protein “E” in Pathway 2 would also be resistant to Pathway 1 inhibitors.

Figure 4.7 Parallel pathways can lead to resistance. (a) In a cancer cell driven by a mutant oncogene in Pathway 1, there are two primary mechanisms of genomic resistance. A new mutation can arise in a protein (e.g. A) downstream of the oncogene (and its inhibitor) to reactivate the original oncogenic pathway. Alternatively, a parallel Pathway 2 could substitute for Pathway 1 in maintaining the oncogenic proliferation. A driving mutation in Pathway 2 could also result in drug resistance. Approaches to therapy would differ based on which of these two resistance mechanisms occurred. (b) In some cases, two distinct pathways that each can drive proliferation and oncogenesis on their own, will interact to cause senescence when activated together.
If there are multiple signaling pathways that control cellular proliferation, then why do cancer cells not simply acquire activation of all these pathways during the clonal evolution of a tumor? Certainly, one would assume that maximizing proliferative signaling is something cancer cells would want. Counterintuitively, excessive activation of pro‐proliferative signaling pathways results in oncogene‐induced senescence [185, 186]. In this case, an overload of pro‐proliferative signaling causes the cell to exit from the cell cycle and prevents proliferation. In some cases, concurrent activation of two pro‐proliferative signaling pathways results in suppressed proliferation, but when one of the pathways is inhibited (for example, by drug treatment), it would allow for that cell to proliferate. In this case, this signaling circuitry functions as an XOR gate rather than an OR gate (Figure 4.7B). These signaling mechanisms may explain why many tumors relapse during drug treatment with no apparent genomic resistance mechanisms. One example of this phenomenon is in melanoma where EGFR expression or TGF‐β treatment suppresses proliferation of BRAFV600E‐mutant melanoma cells. However, in the presence of a BRAFi, TGF‐β‐treated cells or cells with EGFR expression are conferred a growth advantage.
4.3.8 Epigenetic Mechanisms of Drug Resistance
It is becoming better appreciated that stable changes in the function of a cell do not require alterations in DNA sequence. Epigenetics refers to the creation of stable functional alterations by long‐lasting, but potentially reversible, modification of DNA, RNA, or proteins. This often involves methylation of DNA or methylation, acetylation, or phosphorylation of histones or other proteins [187, 188]. Epigenetic changes in cancer cells clearly contribute to drug resistance. We discussed above how EGFR activation in melanoma cells promotes resistance to BRAFi; however, the mechanism was not described. As melanoma cells develop resistance to BRAFi, the landscape of DNA methylation marks in the genome, which largely serve to suppress gene expression, is dynamically altered [189]. Methylation of adjacent cytosine and guanine bases (i.e. CpG regions) can reduce gene expression. Methylation of CpG in the upstream and downstream enhancer regions of the EGFR gene is inversely correlated with EGFR expression. Methylation at these sites is lost in drug‐resistant cells, which should enhance EGFR expression. This prediction is validated by the observation that treatment with the demethylating agent 5‐azacytidine results in EGFR upregulation [190]. Of course, this is only one mechanism by which EGFR signaling can be increased, so there are likely other mechanisms at play. Given the importance of epigenetic changes, both as cancer drivers themselves and as mechanisms of resistance, substantial efforts are underway to target epigenetic mechanisms pharmacologically [191].
It is not necessary for epigenetic reprogramming to occur in every cell within a tumor. Melanoma cells can stochastically switch between a “bulk tumor cell” state and a slow cycling “pre‐resistant” state; the latter state is very rare before drug treatment due to overgrowth of the faster proliferating cells [192]. Upon treatment with vemurafenib, which is a BRAFi, cells in the “bulk tumor cell state” are unable to proliferate. However, the cells in the “pre‐resistant” state continue to proliferate and also undergo epigenetic reprogramming, which results in “burn‐in” of a drug‐resistant transcriptional state (Figure 4.8). A factor in this transcriptional new state is Sox10, a transcription factor that controls melanocyte differentiation. High Sox10 activity induces melanocyte‐specific genes such as another transcription factor, MITF, and an enzyme, tyrosinase. Tyrosinase synthesizes melanin and makes melanocytes dark. The “burn‐in” process begins with loss of accessible Sox10 binding sites through epigenetic changes, ultimately resulting in increased active chromatin and more accessible binding sites for the growth‐promoting transcription factors activator protein 1 (AP‐1) and transcriptional enhancer factor domain family member 1 (TEAD1). Interestingly, Sox10 was previously identified as a mediator of vemurafenib resistance in an shRNA screen of chromatin regulators [193].

Figure 4.8 Dynamic state changes in non‐genomic resistance mechanisms. Melanoma cells can stochastically switch between a bulk tumor cell state (common) and a “pre‐resistant” state (rare). Upon drug treatment “pre‐resistant” cells are transcriptionally rewired to be resistant to vemurafenib and retain the ability to proliferate in the presence of vemurafenib. This state is reversible and cessation of drug treatment results in the cancer cells returning to a bulk tumor cell state, which is presumably resensitized to the original drug treatment.
Subpopulations of pre‐resistant cells are not unique to melanoma. Work from Jeffrey Settelman's group identified a similar subpopulation of resistant cells, or “drug‐tolerant persisters (DTPs),” in NSCLC cells treated with EGFR inhibitors [194]. Fitting with the recurring theme of compensatory RTK activation, these DTPs require signaling by the insulin‐like growth factor receptor (IGF‐1R) for sustained growth and maintenance of an altered chromatin state in the resistant cells. This altered chromatin state is associated with global changes in methylation and acetylation of histones, including changes in di‐ and tri‐methylated histone 3 at lysine 4 (H3K4me2 and H3K4me3) and histone 3 acetylation at lysine 14 (H3K14Ac) [194]. Interestingly, this study also demonstrated that cell surface antigens CD133 and CD44 are upregulated in the DTPs. Both CD133 and CD44 are putative cancer stem cell (CSC) markers. CSCs have been implicated in drug resistance in multiple cancer types including pancreatic cancer, glioblastoma, and breast cancer. DTP cells have also been identified in T‐cell‐derived acute lymphocytic leukemia (T‐ALL). These cells are also driven by an epigenetic mechanism [195]. The take‐home point from these observations is that the presence of small subpopulations of cells that are primed to become drug resistant is a recurring theme in multiple cancer types. These cells, while genetically similar, differ in their epigenetic and transcriptional landscapes. These differences profoundly alter the signaling circuitry within these cells and represent a major challenge to targeted cancer therapies.
4.3.9 Summary of Cancer Drug Resistance
Throughout this section we have identified several recurring themes in drug resistance. First, compensatory activation of signaling pathways (especially RTKs) through multiple mechanisms can promote drug resistance. This can occur through mutational reactivation of the drug target itself as well as activation of other proteins that share similar downstream effector pathways. Activation of parallel signaling pathways can also result in drug resistance. Signaling pathway plasticity is one of the main hallmarks of cancer and is certainly one of the driving mechanisms behind drug resistance. We also learned how rare subpopulations of cells contribute to drug resistance. These subpopulations can be resistant through genomic mechanisms (e.g. a mutation in a resistance gene) but also through non‐genomic or epigenetic mechanisms. As with therapy of HIV/AIDS and tuberculosis, it seems clear that combination therapy will ultimately be needed to keep resistance at bay.
The complexity of drug resistance cannot be overstated; every mechanism that we have discussed here is at play to varying degrees in every single cancer cell. As one might expect, each tumor develops drug resistance through not one but many of these mechanisms. Owing to this complexity, it appears less likely that cancer can be treated as an acute disease, wherein a patient takes an antibiotic‐like drug and is completely cured. The recent success of various immunotherapies, though, may challenge this assertion. But even this exciting new immunotherapeutic approach is not without drug resistance issues. Rather, it may be more appropriate to treat cancer as a chronic disease with the expectation that eventually the patient will relapse. Appropriate combinations should delay that outcome, hopefully for the natural life of the patient. Genomic, transcriptomic, and, perhaps, epigenomic profiling of tumors should help define personalized treatment strategies with appropriate combinations that evolve with the patient's disease. Even this vision is still in the future since, in many cases, we lack the arsenal of drugs to combat the various resistance mechanisms. To address this problem, we need to learn more about mechanisms of drug resistance, but we also need to develop new approaches to target those mechanisms.
4.4 Summary
Determining the mechanisms that may lead to morbidity and mortality requires a comprehensive theoretical understanding of cell signaling as well as experimental studies in models that appropriately match the organism (or organ or cell type) of interest. The role of many different interacting cell types and the tremendous heterogeneity even within a single (e.g. cancer) cell type make it challenging to dissect mechanisms of disease. A proper analogy would be trying to decipher the culprit in a murder mystery with no knowledge of who, when, where, how, or why the crime took place. Dissecting both the players and the roles of the multiple cellular constituents that may lead to disease often requires substantial corroborative results that provide independent identification of involvement. To accomplish this, there are many pharmacological, toxicological, and genetic techniques that can provide discriminatory power to aid in building a case (i.e. testing a hypothesis). The remainder of this book will focus on methods and techniques for collecting data, analyzing data, and drawing conclusions, with a final chapter focused on current needs in the field.
References
- 1 Shah, S.Z., Hussain, T., Zhao, D., and Yang, L. (2017). A central role for calcineurin in protein misfolding neurodegenerative diseases. Cell Mol. Life Sci. 74 (6): 1061–1074.
- 2 Naia, L., Ferreira, I.L., Ferreiro, E., and Rego, A.C. (2017). Mitochondrial Ca2+ handling in Huntington's and Alzheimer's diseases – role of ER‐mitochondria crosstalk. Biochem. Biophys. Res. Commun. 483 (4): 1069–1077.
- 3 Raymond, L.A. (2017). Striatal synaptic dysfunction and altered calcium regulation in Huntington disease. Biochem. Biophys. Res. Commun. 483 (4): 1051–1062.
- 4 Wang, H., Dharmalingam, P., Vasquez, V. et al. (2017). Chronic oxidative damage together with genome repair deficiency in the neurons is a double whammy for neurodegeneration: is damage response signaling a potential therapeutic target? Mech. Ageing Dev. 161 (Pt A): 163–176.
- 5 Bahar, E., Kim, H., and Yoon, H. (2016). ER stress‐mediated signaling: action potential and Ca(2+) as key players. Int. J. Mol. Sci. 17 (9): 1558.
- 6 Segales, J., Perdiguero, E., and Munoz‐Canoves, P. (2016). Regulation of muscle stem cell functions: a focus on the p38 MAPK signaling pathway. Front. Cell Dev. Biol. 4: 91.
- 7 Kipanyula, M.J., Kimaro, W.H., and Seke Etet, P.F. (2016). The emerging roles of the calcineurin‐nuclear factor of activated T‐lymphocytes pathway in nervous system functions and diseases. J. Aging Res. 2016 (5081021): 1–20.
- 8 Sanak, M. (2016). Eicosanoid mediators in the airway inflammation of asthmatic patients: what is new? Allergy Asthma Immunol. Res. 8 (6): 481–490.
- 9 Akdis, M., Aab, A., Altunbulakli, C. et al. (2016). Interleukins (from IL‐1 to IL‐38), interferons, transforming growth factor B, and TNF‐a: receptors, functions, and roles in diseases. J Allergy Clin. Immunol. 138 (4): 984–1010.
- 10 Krishnamurthy, P. and Kaplan, M.H. (2016). STAT6 and PARP family members in the development of T cell‐dependent allergic inflammation. Immune Netw. 16 (4): 201–210.
- 11 Kim, H.Y., Umetsu, D.T., and Dekruyff, R.H. (2016). Innate lymphoid cells in asthma: will they take your breath away? Eur. J. Immunol. 46 (4): 795–806.
- 12 Zong, D., Ouyang, R., Li, J. et al. (2016). Notch signaling in lung diseases: focus on Notch1 and Notch3. Ther. Adv. Respir. Dis. 10 (5): 468–484.
- 13 Barnes, P.J. (2016). Kinases as novel therapeutic targets in asthma and chronic obstructive pulmonary disease. Pharmacol. Rev. 68 (3): 788–815.
- 14 Sharma, Y., Bashir, S., Bhardwaj, P. et al. (2016). Protein tyrosine phosphatase SHP‐1: resurgence as new drug target for human autoimmune disorders. Immunol. Res. 64 (4): 804–819.
- 15 Smith, U. and Kahn, B.B. (2016). Adipose tissue regulates insulin sensitivity: role of adipogenesis, de novo lipogenesis and novel lipids. J. Intern. Med. 280 (5): 465–475.
- 16 Carnagarin, R., Dharmarajan, A.M., and Dass, C.R. (2015). Molecular aspects of glucose homeostasis in skeletal muscle – a focus on the molecular mechanisms of insulin resistance. Mol. Cell Endocrincol. 417: 52–62.
- 17 Govers, R. (2014). Molecular mechanisms of GLUT4 regulation in adipocytes. Diabetes Metab. 40 (6): 400–410.
- 18 Gross, B., Pawlak, M., Lefebvre, P., and Staels, B. (2017). PPARs in obesity‐induced T2DM, dyslipidaemia and NAFLD. Nature Rev. Endocrinol. 13 (1): 36–49.
- 19 Wong, R.S. (2011). Apoptosis in cancer: from pathogenesis to treatment. J. Exp. Clin. Cancer Res. 30 (87): 1–14.
- 20 Croce, C.M. and Reed, J.C. (2016). Finally, an apoptosis‐targeting therapeutic for cancer. Cancer Res. 76 (20): 5914–5920.
- 21 Nguyen, T.L. and Duran, R.V. (2016). Prolyl hydroxylase domain enzymes and their role in cell signaling and cancer metabolism. Int. J. Biochem. Cell Biol. 80: 71–80.
- 22 Mohammadi, A., Mansoori, B., and Baradaran, B. (2016). The role of microRNAs in colorectal cancer. Biomed. Pharmacother. 84: 705–713.
- 23 Mahdian‐Shakib, A., Dorostkar, R., Tat, M. et al. (2016). Differential role of microRNAs in prognosis, diagnosis, and therapy of ovarian cancer. Biomed. Pharmacother. 84: 592–600.
- 24 Brzozowa‐Zasada, M., Piecuch, A., Dittfeld, A. et al. (2016). Notch signalling pathway as an oncogenic factor involved in cancer development. Contemp. Oncol. 20 (4): 267–272.
- 25 Caplakova, V., Babusikova, E., and Blahovcova, E. (2016). DNA methylation machinery in the endometrium and endometrial cancer. Anticancer Res. 36 (9): 4407–4420.
- 26 Dongiovanni, P., Romeo, S., and Valenti, L. (2014). Hepatocellular carcinoma in nonalcoholic fatty liver: role of environmental and genetic factors. World J. Gastroenterol. 20 (36): 12945–12955.
- 27 Pellicoro, A., Ramachandran, P., Iredale, J.P., and Fallowfield, J.A. (2014). Liver fibrosis and repair: immune regulation of wound healing in a solid organ. Nat. Rev. Immunol. 14 (3): 181–194.
- 28 Bataller, R. and Brenner, D.A. (2009). Hepatic fibrosis. In: The Liver: Biology and Pathobiology, 5e (ed. I.M. Arias, H.J. Alter, J.L. Boyer, et al.), 433–452. Chichester: Wiley‐Blackwell.
- 29 Zhang, L., Liu, C., Meng, X.M. et al. (2015). Smad2 protects against TGF‐B1/Smad3‐mediated collagen synthesis in human hepatic stellate cells during hepatic fibrosis. Mol. Cell Biochem. 400 (1–2): 17–28.
- 30 Bissell, D.M., Wang, S.S., Jarnagin, W.R., and Roll, F.J. (1995). Cell‐specific expression of transforming growth factor‐beta in rat liver. Evidence for autocrine regulation of hepatocyte proliferation. J Clin. Invest. 96 (1): 447–455.
- 31 Wasser, S. and Tan, C.E. (1999). Experimental models of hepatic fibrosis in the rat. Ann. Acad. Med. Singapore 28 (1): 109–111.
- 32 Krishnasamy, Y., Ramshesh, V.K., Gooz, M. et al. (2016). Ethanol and high cholesterol diet causes severe steatohepatitis and early liver fibrosis in mice. PloS One 11 (9): 1–20.
- 33 Sanches, S.C., Ramalho, L.N., Augusto, M.J. et al. (2015). Nonalcoholic steatohepatitis: a search for factual animal models. BioMed Research International 2015 (574832): 1–13.
- 34 Mederacke, I., Hsu, C.C., Troeger, J.S. et al. (2013). Fate tracing reveals hepatic stellate cells as dominant contributors to liver fibrosis independent of its aetiology. Nat. Commun. 4 (2823): 1–11.
- 35 Cassiman, D., Libbrecht, L., Desmet, V. et al. (2002). Hepatic stellate cell/myofibroblast subpopulations in fibrotic human and rat livers. J. Hepatol. 36 (2): 200–209.
- 36 Mannaerts, I., Schroyen, B., Verhulst, S. et al. (2013). Gene expression profiling of early hepatic stellate cell activation reveals a role for Igfbp3 in cell migration. PloS One 8 (12): 1–13.
- 37 Lee, K.S., Buck, M., Houglum, K., and Chojkier, M. (1995). Activation of hepatic stellate cells by TGF alpha and collagen type I is mediated by oxidative stress through c‐myb expression. J Clin. Invest. 96 (5): 2461–2468.
- 38 Nieto, N., Friedman, S.L., and Cederbaum, A.I. (2002). Stimulation and proliferation of primary rat hepatic stellate cells by cytochrome P450 2E1‐derived reactive oxygen species. Hepatology 35 (1): 62–73.
- 39 Iredale, J.P., Thompson, A., and Henderson, N.C. (2013). Extracellular matrix degradation in liver fibrosis: biochemistry and regulation. Biochim. Biophys. Acta. 1832 (7): 876–883.
- 40 Latella, G., Vetuschi, A., Sferra, R. et al. (2009). Targeted disruption of Smad3 confers resistance to the development of dimethylnitrosamine‐induced hepatic fibrosis in mice. Liver Int. 29 (7): 997–1009.
- 41 Masszi, A. and Kapus, A. (2011). Smaddening complexity: the role of Smad3 in epithelial‐myofibroblast transition. Cells Tissues Organs 193 (1–2): 41–52.
- 42 Dudas, J., Kovalszky, I., Gallai, M. et al. (2001). Expression of decorin, transforming growth factor‐beta 1, tissue inhibitor metalloproteinase 1 and 2, and type IV collagenases in chronic hepatitis. Am. J. Clin. Pathol. 115 (5): 725–735.
- 43 Castilla, A., Prieto, J., and Fausto, N. (1991). Transforming growth factors beta 1 and alpha in chronic liver disease. Effects of interferon alfa therapy. N. Engl. J. Med. 324 (14): 933–940.
- 44 Marra, F., Valente, A.J., Pinzani, M., and Abboud, H.E. (1993). Cultured human liver fat‐storing cells produce monocyte chemotactic protein‐1. Regulation by proinflammatory cytokines. J. Clin. Invest. 92 (4): 1674–1680.
- 45 Czaja, M.J., Geerts, A., Xu, J. et al. (1994). Monocyte chemoattractant protein 1 (MCP‐1) expression occurs in toxic rat liver injury and human liver disease. J Leukoc. Biol. 55 (1): 120–126.
- 46 Pinzani, M., Milani, S., Grappone, C. et al. (1994). Expression of platelet‐derived growth factor in a model of acute liver injury. Hepatology 19 (3): 701–707.
- 47 Schirmacher, P., Geerts, A., Pietrangelo, A. et al. (1992). Hepatocyte growth factor/hepatopoietin a is expressed in fat‐storing cells from rat liver but not myofibroblast‐like cells derived from fat‐storing cells. Hepatology 15 (1): 5–11.
- 48 Maher, J.J. (1993). Cell‐specific expression of hepatocyte growth factor in liver. Upregulation in sinusoidal endothelial cells after carbon tetrachloride. J. Clin. Invest. 91 (5): 2244–2252.
- 49 Mullhaupt, B., Feren, A., Fodor, E., and Jones, A. (1994). Liver expression of epidermal growth factor RNA. Rapid increases in immediate‐early phase of liver regeneration. J. Biol. Chem. 269 (31): 19667–19670.
- 50 Friedman, S.L. (2008). Hepatic stellate cells: protean, multifunctional, and enigmatic cells of the liver. Physiol. Rev. 88 (1): 125–172.
- 51 Reeves, H.L. and Friedman, S.L. (2002). Activation of hepatic stellate cells – a key issue in liver fibrosis. Front. Biosci. 7: 808–826.
- 52 Shah, R., Reyes‐Gordillo, K., Arellanes‐Robledo, J. et al. (2013). TGF‐B1 up‐regulates the expression of PDGF‐B receptor mRNA and induces a delayed PI3K‐, AKT‐, and p70(S6K) ‐dependent proliferative response in activated hepatic stellate cells. Alcohol. Clin. Exp. Res. 37 (11): 1838–1848.
- 53 Caliari, S.R., Perepelyuk, M., Soulas, E.M. et al. (2016). Gradually softening hydrogels for modeling hepatic stellate cell behavior during fibrosis regression. Integr. Biol. (Camb.) 8 (6): 720–728.
- 54 Guvendiren, M., Perepelyuk, M., Wells, R.G., and Burdick, J.A. (2014). Hydrogels with differential and patterned mechanics to study stiffness‐mediated myofibroblastic differentiation of hepatic stellate cells. J. Mech. Behav. Biomed. Mater. 38: 198–208.
- 55 Georges, P.C., Hui, J.J., Gombos, Z. et al. (2007). Increased stiffness of the rat liver precedes matrix deposition: implications for fibrosis. Am. J. Physiol. Gastrointest. Liver Physiol. 293 (6): 1147–1154.
- 56 Kisseleva, T., Uchinami, H., Feirt, N. et al. (2006). Bone marrow‐derived fibrocytes participate in pathogenesis of liver fibrosis. J. Hepatol. 45 (3): 429–438.
- 57 Scholten, D. and Weiskirchen, R. (2011). Questioning the challenging role of epithelial‐to‐mesenchymal transition in liver injury. Hepatology 53 (3): 1048–1051.
- 58 Higashiyama, R., Moro, T., Nakao, S. et al. (2009). Negligible contribution of bone marrow‐derived cells to collagen production during hepatic fibrogenesis in mice. Gastroenterology 137 (4): 1459–1466.
- 59 Taura, K., Iwaisako, K., Hatano, E., and Uemoto, S. (2016). Controversies over the epithelial‐to‐mesenchymal transition in liver fibrosis. J. Clin. Med. 5 (1): 9.
- 60 Brenner, D.A., Kisseleva, T., Scholten, D. et al. (2012). Origin of myofibroblasts in liver fibrosis. Fibrogenesis Tissue Repair 5 (1): 1–14.
- 61 Valdes, F., Alvarez, A.M., Locascio, A. et al. (2002). The epithelial mesenchymal transition confers resistance to the apoptotic effects of transforming growth factor Beta in fetal rat hepatocytes. Mol. Cancer Res. 1 (1): 68–78.
- 62 Ikegami, T., Zhang, Y., and Matsuzaki, Y. (2007). Liver fibrosis: possible involvement of EMT. Cells Tissues Organs 185 (1–3): 213–221.
- 63 Omenetti, A., Bass, L.M., Anders, R.A. et al. (2011). Hedgehog activity, epithelial‐mesenchymal transitions, and biliary dysmorphogenesis in biliary atresia. Hepatology 53 (4): 1246–1258.
- 64 Nitta, T., Kim, J.S., Mohuczy, D., and Behrns, K.E. (2008). Murine cirrhosis induces hepatocyte epithelial mesenchymal transition and alterations in survival signaling pathways. Hepatology 48 (3): 909–919.
- 65 Kaimori, A., Potter, J., Kaimori, J.Y. et al. (2007). Transforming growth factor‐beta1 induces an epithelial‐to‐mesenchymal transition state in mouse hepatocytes in vitro. J. Biol. Chem. 282 (30): 22089–22101.
- 66 Kang, M., Choi, S., Jeong, S.J. et al. (2012). Cross‐talk between TGFB1 and EGFR signalling pathways induces TM4SF5 expression and epithelial‐mesenchymal transition. Biochem. J. 443 (3): 691–700.
- 67 Zeisberg, M., Yang, C., Martino, M. et al. (2007). Fibroblasts derive from hepatocytes in liver fibrosis via epithelial to mesenchymal transition. J Biol. Chem. 282 (32): 23337–23347.
- 68 Taura, K., Miura, K., Iwaisako, K. et al. (2010). Hepatocytes do not undergo epithelial‐mesenchymal transition in liver fibrosis in mice. Hepatology 51 (3): 1027–1036.
- 69 Chu, A.S., Diaz, R., Hui, J.J. et al. (2011). Lineage tracing demonstrates no evidence of cholangiocyte epithelial‐to‐mesenchymal transition in murine models of hepatic fibrosis. Hepatology 53 (5): 1685–1695.
- 70 Greuter, T. and Shah, V.H. (2016). Hepatic sinusoids in liver injury, inflammation, and fibrosis: new pathophysiological insights. J. Gastroenterol. 51 (6): 511–519.
- 71 Ramachandran, P., Pellicoro, A., Vernon, M.A. et al. (2012). Differential Ly‐6C expression identifies the recruited macrophage phenotype, which orchestrates the regression of murine liver fibrosis. Proc. Natl. Acad. Sci. U.S.A. 109 (46): 3186–3195.
- 72 Mochizuki, A., Pace, A., Rockwell, C.E. et al. (2014). Hepatic stellate cells orchestrate clearance of necrotic cells in a hypoxia‐inducible factor‐1a‐dependent manner by modulating macrophage phenotype in mice. J. Immunol. 192 (8): 3847–3857.
- 73 Langer, D.A., Das, A., Semela, D. et al. (2008). Nitric oxide promotes caspase‐independent hepatic stellate cell apoptosis through the generation of reactive oxygen species. Hepatology 47 (6): 1983–1993.
- 74 DeLeve, L.D. (2015). Liver sinusoidal endothelial cells in hepatic fibrosis. Hepatology 61 (5): 1740–1746.
- 75 Xie, G., Wang, X., Wang, L. et al. (2012). Role of differentiation of liver sinusoidal endothelial cells in progression and regression of hepatic fibrosis in rats. Gastroenterology 142 (4): 918–927.
- 76 Knorr, A., Hirth‐Dietrich, C., Alonso‐Alija, C. et al. (2008). Nitric oxide‐independent activation of soluble guanylate cyclase by BAY 60‐2770 in experimental liver fibrosis. Arzneimittelforschung 58 (2): 71–80.
- 77 Kramer, B., Korner, C., Kebschull, M. et al. (2012). Natural killer p46High expression defines a natural killer cell subset that is potentially involved in control of hepatitis C virus replication and modulation of liver fibrosis. Hepatology 56 (4): 1201–1213.
- 78 Glassner, A., Eisenhardt, M., Kramer, B. et al. (2012). NK cells from HCV‐infected patients effectively induce apoptosis of activated primary human hepatic stellate cells in a TRAIL‐, FasL‐ and NKG2D‐dependent manner. Lab. Invest. 92 (7): 967–977.
- 79 Tian, Z., Chen, Y., and Gao, B. (2013). Natural killer cells in liver disease. Hepatology 57 (4): 1654–1662.
- 80 Melhem, A., Muhanna, N., Bishara, A. et al. (2006). Anti‐fibrotic activity of NK cells in experimental liver injury through killing of activated HSC. J. Hepatol. 45 (1): 60–71.
- 81 Radaeva, S., Sun, R., Jaruga, B. et al. (2006). Natural killer cells ameliorate liver fibrosis by killing activated stellate cells in NKG2D‐dependent and tumor necrosis factor‐related apoptosis‐inducing ligand‐dependent manners. Gastroenterology 130 (2): 435–452.
- 82 Miyake, T., Kumagai, Y., Kato, H. et al. (2009). Poly I:C‐induced activation of NK cells by CD8 alpha+ dendritic cells via the IPS‐1 and TRIF‐dependent pathways. J. Immunol. 183 (4): 2522–2528.
- 83 Ngoi, S.M., Tovey, M.G., and Vella, A.T. (2008). Targeting poly (I:C) to the TLR3‐independent pathway boosts effector CD8 T cell differentiation through IFN‐alpha/beta. J. Immunol. 181 (11): 7670–7680.
- 84 Lafyatis, R. (2014). Transforming growth factor beta – at the centre of systemic sclerosis. Nat. Rev. Rheumatol. 10 (12): 706–719.
- 85 Popov, Y., Patsenker, E., Stickel, F. et al. (2008). Integrin alphavbeta6 is a marker of the progression of biliary and portal liver fibrosis and a novel target for antifibrotic therapies. J. Hepatol. 48 (3): 453–464.
- 86 Wipff, P.J., Rifkin, D.B., Meister, J.J., and Hinz, B. (2007). Myofibroblast contraction activates latent TGF‐beta1 from the extracellular matrix. J. Cell. Biol. 179 (6): 1311–1323.
- 87 Wang, X.M., Yu, D.M., McCaughan, G.W., and Gorrell, M.D. (2005). Fibroblast activation protein increases apoptosis, cell adhesion, and migration by the LX‐2 human stellate cell line. Hepatology 42 (4): 935–945.
- 88 Wrighton, K.H., Lin, X., and Feng, X.H. (2009). Phospho‐control of TGF‐beta superfamily signaling. Cell Res. 19 (1): 8–20.
- 89 Massague, J. (2012). TGFB signalling in context. Nat. Rev. Mol. Cell Biol. 13 (10): 616–630.
- 90 Xie, W., Aisner, S., Baredes, S. et al. (2013). Alterations of Smad expression and activation in defining 2 subtypes of human head and neck squamous cell carcinoma. Head Neck 35 (1): 76–85.
- 91 Meng, X.M., Chung, A.C., and Lan, H.Y. (2013). Role of the TGF‐B/BMP‐7/Smad pathways in renal diseases. Clin. Sci. (Lond.) 124 (4): 243–254.
- 92 Hill, C.S. (2009). Nucleocytoplasmic shuttling of Smad proteins. Cell Res. 19 (1): 36–46.
- 93 Dai, F., Lin, X., Chang, C., and Feng, X.H. (2009). Nuclear export of Smad2 and Smad3 by RanBP3 facilitates termination of TGF‐B signaling. Dev. Cell 16 (3): 345–357.
- 94 Derynck, R. and Zhang, Y.E. (2003). Smad‐dependent and Smad‐independent pathways in TGF‐beta family signalling. Nature 425 (6958): 577–584.
- 95 Schnabl, B., Kweon, Y.O., Frederick, J.P. et al. (2001). The role of Smad3 in mediating mouse hepatic stellate cell activation. Hepatology 34 (1): 89–100.
- 96 Roberts, A.B., Russo, A., Felici, A., and Flanders, K.C. (2003). Smad3: a key player in pathogenetic mechanisms dependent on TGF‐beta. Ann. N.Y. Acad. Sci. 995: 1–10.
- 97 Meng, X.M., Huang, X.R., Chung, A.C. et al. (2010). Smad2 protects against TGF‐beta/Smad3‐mediated renal fibrosis. J. Am. Soc. Nephrol. 21 (9): 1477–1487.
- 98 Tsuchida, K., Zhu, Y., Siva, S. et al. (2003). Role of Smad4 on TGF‐beta‐induced extracellular matrix stimulation in mesangial cells. Kidney Int. 63 (6): 2000–2009.
- 99 Tan, R., He, W., Lin, X. et al. (2008). Smad ubiquitination regulatory factor‐2 in the fibrotic kidney: regulation, target specificity, and functional implication. Am. J. Physiol. Renal Physiol. 294 (5): 1076–1083.
- 100 Lin, X., Liang, M., and Feng, X.H. (2000). Smurf2 is a ubiquitin E3 ligase mediating proteasome‐dependent degradation of Smad2 in transforming growth factor‐beta signaling. J. Biol. Chem. 275 (47): 36818–36822.
- 101 Dooley, S., Hamzavi, J., Ciuclan, L. et al. (2008). Hepatocyte‐specific Smad7 expression attenuates TGF‐beta‐mediated fibrogenesis and protects against liver damage. Gastroenterology 135 (2): 642–659.
- 102 Bian, E.B., Huang, C., Wang, H. et al. (2014). Repression of Smad7 mediated by DNMT1 determines hepatic stellate cell activation and liver fibrosis in rats. Toxicol. Lett. 224 (2): 175–185.
- 103 Davies, M., Robinson, M., Smith, E. et al. (2005). Induction of an epithelial to mesenchymal transition in human immortal and malignant keratinocytes by TGF‐beta1 involves MAPK, Smad and AP‐1 signalling pathways. J. Cell. Biochem. 95 (5): 918–931.
- 104 Hartsough, M.T. and Mulder, K.M. (1995). Transforming growth factor beta activation of p44mapk in proliferating cultures of epithelial cells. J. Biol. Chem. 270 (13): 7117–7124.
- 105 Yu, L., Hebert, M.C., and Zhang, Y.E. (2002). TGF‐beta receptor‐activated p38 MAP kinase mediates Smad‐independent TGF‐beta responses. EMBO J. 21 (14): 3749–3759.
- 106 Bourbonnais, E., Raymond, V.A., Ethier, C. et al. (2012). Liver fibrosis protects mice from acute hepatocellular injury. Gastroenterology 142 (1): 130–139.
- 107 Mucsi, I., Skorecki, K.L., and Goldberg, H.J. (1996). Extracellular signal‐regulated kinase and the small GTP‐binding protein, Rac, contribute to the effects of transforming growth factor‐beta1 on gene expression. J. Biol. Chem. 271 (28): 16567–16572.
- 108 Zavadil, J., Bitzer, M., Liang, D. et al. (2001). Genetic programs of epithelial cell plasticity directed by transforming growth factor‐beta. Proc. Natl. Acad. Sci. U.S.A. 98 (12): 6686–6691.
- 109 Kretzschmar, M., Doody, J., Timokhina, I., and Massague, J. (1999). A mechanism of repression of TGFbeta/ Smad signaling by oncogenic Ras. Genes Dev. 13 (7): 804–816.
- 110 Gonzalez, D.M. and Medici, D. (2014). Signaling mechanisms of the epithelial‐mesenchymal transition. Sci. Signal. 7 (344): 1–16.
- 111 Medici, D., Hay, E.D., and Olsen, B.R. (2008). Snail and slug promote epithelial‐mesenchymal transition through beta‐catenin‐T‐cell factor‐4‐dependent expression of transforming growth factor‐beta3. Mol. Biol. Cell 19 (11): 4875–4887.
- 112 Cano, A., Perez‐Moreno, M.A., Rodrigo, I. et al. (2000). The transcription factor snail controls epithelial‐mesenchymal transitions by repressing E‐cadherin expression. Nat. Cell Biol. 2 (2): 76–83.
- 113 Julien, S., Puig, I., Caretti, E. et al. (2007). Activation of NF‐kappaB by Akt upregulates snail expression and induces epithelium mesenchyme transition. Oncogene 26 (53): 7445–7456.
- 114 Zhou, B.P., Deng, J., Xia, W. et al. (2004). Dual regulation of snail by GSK‐3beta‐mediated phosphorylation in control of epithelial‐mesenchymal transition. Nat. Cell Biol. 6 (10): 931–940.
- 115 Chaudhury, A., Hussey, G.S., Ray, P.S. et al. (2010). TGF‐beta‐mediated phosphorylation of hnRNP E1 induces EMT via transcript‐selective translational induction of Dab2 and ILEI. Nat. Cell Biol. 12 (3): 286–293.
- 116 Lamouille, S. and Derynck, R. (2007). Cell size and invasion in TGF‐beta‐induced epithelial to mesenchymal transition is regulated by activation of the mTOR pathway. J. Cell Biol. 178 (3): 437–451.
- 117 Lamouille, S., Connolly, E., Smyth, J.W. et al. (2012). TGF‐B‐induced activation of mTOR complex 2 drives epithelial‐mesenchymal transition and cell invasion. J. Cell Sci. 125 (Pt. 5): 1259–1273.
- 118 Rosmorduc, O., Wendum, D., Corpechot, C. et al. (1999). Hepatocellular hypoxia‐induced vascular endothelial growth factor expression and angiogenesis in experimental biliary cirrhosis. Am. J. Pathol. 155 (4): 1065–1073.
- 119 Ji, S., Lemasters, J.J., Christenson, V., and Thurman, R.G. (1982). Periportal and pericentral pyridine nucleotide fluorescence from the surface of the perfused liver: evaluation of the hypothesis that chronic treatment with ethanol produces pericentral hypoxia. Proc. Natl. Acad. Sci. U.S.A. 79 (17): 5415–5419.
- 120 Moon, J.O., Welch, T.P., Gonzalez, F.J., and Copple, B.L. (2009). Reduced liver fibrosis in hypoxia‐inducible factor‐1alpha‐deficient mice. Am. J. Physiol. Gastrointest. Liver Physiol. 296 (3): 582–592.
- 121 Copple, B.L., Kaska, S., and Wentling, C. (2012). Hypoxia‐inducible factor activation in myeloid cells contributes to the development of liver fibrosis in cholestatic mice. J. Pharmacol. Exp. Ther. 341 (2): 307–316.
- 122 Copple, B.L., Bai, S., and Moon, J.O. (2010). Hypoxia‐inducible factor‐dependent production of profibrotic mediators by hypoxic Kupffer cells. Hepatol. Res. 40 (5): 530–539.
- 123 Murakami, Y., Toyoda, H., Tanaka, M. et al. (2011). The progression of liver fibrosis is related with overexpression of the miR‐199 and 200 families. PloS One 6 (1): e16081.
- 124 Wei, J., Feng, L., Li, Z. et al. (2013). MicroRNA‐21 activates hepatic stellate cells via PTEN/Akt signaling. Biomed. Pharmacother. 67 (5): 387–392.
- 125 Zhao, J., Tang, N., Wu, K. et al. (2014). MiR‐21 simultaneously regulates ERK1 signaling in HSC activation and hepatocyte EMT in hepatic fibrosis. PloS One 9 (10): e108005.
- 126 Roderburg, C., Urban, G.W., Bettermann, K. et al. (2011). Micro‐RNA profiling reveals a role for miR‐29 in human and murine liver fibrosis. Hepatology 53 (1): 209–218.
- 127 Zeng, C., Wang, Y.L., Xie, C. et al. (2015). Identification of a novel TGF‐B‐miR‐122‐fibronectin 1/serum response factor signaling cascade and its implication in hepatic fibrogenesis. Oncotarget 6 (14): 12224–12233.
- 128 Seki, E., De Minicis, S., Osterreicher, C.H. et al. (2007). TLR4 enhances TGF‐beta signaling and hepatic fibrosis. Nat. Med. 13 (11): 1324–1332.
- 129 Ji, L., Xue, R., Tang, W. et al. (2014). Toll like receptor 2 knock‐out attenuates carbon tetrachloride (CCl4)‐induced liver fibrosis by downregulating MAPK and NF‐kB signaling pathways. FEBS Lett. 588 (12): 2095–2100.
- 130 Shu, M., Huang, D.D., Hung, Z.A. et al. (2016). Inhibition of MAPK and NF‐kB signaling pathways alleviate carbon tetrachloride (CCl4)‐induced liver fibrosis in toll‐like receptor 5 (TLR5) deficiency mice. Biochem. Biophys. Res. Commun. 471 (1): 233–239.
- 131 Pao, W., Miller, V., Zakowski, M. et al. (2004). EGF receptor gene mutations are common in lung cancers from “never smokers” and are associated with sensitivity of tumors to gefitinib and erlotinib. Proc. Natl. Acad. Sci. U.S.A. 101 (36): 13306–13311.
- 132 Sharma, S.V., Bell, D.W., Settleman, J., and Haber, D.A. (2007). Epidermal growth factor receptor mutations in lung cancer. Nat. Rev. Cancer 7 (3): 169–181.
- 133 Haber, D.A., Bell, D.W., Sordella, R. et al. (2005). Molecular targeted therapy of lung cancer: EGFR mutations and response to EGFR inhibitors. Cold Spring Harb. Symp. Quant. Biol. 70: 419–426.
- 134 Flaherty, K.T., Puzanov, I., Kim, K.B. et al. (2010). Inhibition of mutated, activated BRAF in metastatic melanoma. N. Engl. J. Med. 363 (9): 809–819.
- 135 Pao, W., Miller, V.A., Politi, K.A. et al. (2005). Acquired resistance of lung adenocarcinomas to gefitinib or erlotinib is associated with a second mutation in the EGFR kinase domain. PLoS Med. 2 (3): e73.
- 136 Kobayashi, S., Boggon, T.J., Dayaram, T. et al. (2005). EGFR mutation and resistance of non‐small‐cell lung cancer to gefitinib. N. Engl. J. Med. 352 (8): 786–792.
- 137 Kwak, E.L., Sordella, R., Bell, D.W. et al. (2005). Irreversible inhibitors of the EGF receptor may circumvent acquired resistance to gefitinib. Proc. Natl. Acad. Sci. U.S.A. 102 (21): 7665–7670.
- 138 Sos, M.L., Koker, M., Weir, B.A. et al. (2009). PTEN loss contributes to erlotinib resistance in EGFR‐mutant lung cancer by activation of Akt and EGFR. Cancer Res. 69 (8): 3256–3261.
- 139 Steelman, L.S., Navolanic, P.M., Sokolosky, M.L. et al. (2008). Suppression of PTEN function increases breast cancer chemotherapeutic drug resistance while conferring sensitivity to mTOR inhibitors. Oncogene 27 (29): 4086–4095.
- 140 Paraiso, K.H., Xiang, Y., Rebecca, V.W. et al. (2011). PTEN loss confers BRAF inhibitor resistance to melanoma cells through the suppression of BIM expression. Cancer Res. 71 (7): 2750–2760.
- 141 Toy, W., Weir, H., Razavi, P. et al. (2017). Activating ESR1 mutations differentially affect the efficacy of ER antagonists. Cancer Discov. 7 (3): 277–287.
- 142 Nazarian, R., Shi, H., Wang, Q. et al. (2010). Melanomas acquire resistance to B‐RAF(V600E) inhibition by RTK or N‐RAS upregulation. Nature 468 (7326): 973–977.
- 143 Emery, C.M., Vijayendran, K.G., Zipser, M.C. et al. (2009). MEK1 mutations confer resistance to MEK and B‐RAF inhibition. Proc. Natl. Acad. Sci. U.S.A. 106 (48): 20411–20416.
- 144 Brown, R., Curry, E., Magnani, L. et al. (2014). Poised epigenetic states and acquired drug resistance in cancer. Nat. Rev. Cancer 14 (11): 747–753.
- 145 Van Boeckel, T.P., Glennon, E.E., Chen, D. et al. (2017). Reducing antimicrobial use in food animals. Science 357 (6358): 1350–1352.
- 146 Sommer, M.O.A., Dantas, G., and Church, G.M. (2009). Functional characterization of the antibiotic resistance reservoir in the human microflora. Science 325 (5944): 1128–1131.
- 147 Gulick, R.M., Mellors, J.W., Havlir, D. et al. (1997). Treatment with indinavir, zidovudine, and lamivudine in adults with human immunodeficiency virus infection and prior antiretroviral therapy. N. Engl. J. Med. 337 (11): 734–739.
- 148 Hammer, S.M., Squires, K.E., Hughes, M.D. et al. (1997). A controlled trial of two nucleoside analogues plus indinavir in persons with human immunodeficiency virus infection and CD4 cell counts of 200 per cubic millimeter or less. AIDS Clinical Trials Group 320 study team. N. Engl. J. Med. 337 (11): 725–733.
- 149 Tsai, J., Lee, J.T., Wang, W. et al. (2008). Discovery of a selective inhibitor of oncogenic B‐Raf kinase with potent antimelanoma activity. Proc. Natl. Acad. Sci. U.S.A. 105 (8): 3041–3046.
- 150 Goldstein, L.J., Galski, H., Fojo, A. et al. (1989). Expression of a multidrug resistance gene in human cancers. J. Natl. Cancer Inst. 81 (2): 116–124.
- 151 Gottesman, M.M. and Pastan, I.H. (2015). The role of multidrug resistance efflux pumps in cancer: revisiting a JNCI publication exploring expression of the MDR1 (P‐glycoprotein) gene. J. Natl. Cancer Inst. 107 (9): https://doi.org/10.1093/jnci/djv222.
- 152 Nowell, P.C. (1976). The clonal evolution of tumor cell populations. Science 194 (4260): 23–28.
- 153 Moncada, R., Chiodin, M., Devlin, J.C., et al. (2018). Building a tumor atlas: integrating single‐cell RNA‐Seq data with spatial transcriptomics in pancreatic ductal adenocarcinoma. bioRxiv. https://doi.org/10.1101/254375.
- 154 Filbin, M.G., Tirosh, I., Hovestadt, V. et al. (2018). Developmental and oncogenic programs in H3K27M gliomas dissected by single‐cell RNA‐seq. Science 360 (6386): 331–335.
- 155 Puram, S.V., Tirosh, I., Parikh, A.S. et al. (2017). Single‐cell transcriptomic analysis of primary and metastatic tumor ecosystems in head and neck cancer. Cell 171 (7): 1611–1624.
- 156 Tirosh, I., Izar, B., Prakadan, S.M. et al. (2016). Dissecting the multicellular ecosystem of metastatic melanoma by single‐cell RNA‐seq. Science 352 (6282): 189–196.
- 157 Tirosh, I., Venteicher, A.S., Hebert, C. et al. (2016). Single‐cell RNA‐seq supports a developmental hierarchy in human oligodendroglioma. Nature 539 (7628): 309–313.
- 158 Patel, A.P., Tirosh, I., Trombetta, J.J. et al. (2014). Single‐cell RNA‐seq highlights intratumoral heterogeneity in primary glioblastoma. Science 344 (6190): 1396–1401.
- 159 Konieczkowski, D.J., Johannessen, C.M., Abudayyeh, O. et al. A melanoma cell state distinction influences sensitivity to MAPK pathway inhibitors. Cancer Discov. 4 (7): 816–827.
- 160 Kumar, V., Donthireddy, L., Marvel, D. et al. (2017). Cancer‐associated fibroblasts neutralize the anti‐tumor effect of CSF1 receptor blockade by inducing PMN‐MDSC infiltration of tumors. Cancer Cell 32 (5): 654–668.
- 161 Kaur, A., Webster, M.R., Marchbank, K. et al. (2016). sFRP2 in the aged microenvironment drives melanoma metastasis and therapy resistance. Nature 532 (7598): 250–254.
- 162 Werb, Z. and Lu, P. (2016). The role of stroma in tumor development. Cancer J. 21 (4): 250–253.
- 163 Hirata, E., Girotti, M.R., Viros, A. et al. (2015). Intravital imaging reveals how BRAF inhibition generates drug‐tolerant microenvironments with high integrin beta1/FAK signaling. Cancer Cell 27 (4): 574–588.
- 164 Nair, S. and Dhodapkar, M.V. (2017). Natural killer T cells in cancer immunotherapy. Front. Immunol. 8: 1178.
- 165 Mantovani, A., Marchesi, F., Malesci, A. et al. (2017). Tumour‐associated macrophages as treatment targets in oncology. Nat. Rev. Clin. Oncol. 14 (7): 399–416.
- 166 Kalluri, R. (2016). The biology and function of fibroblasts in cancer. Nat. Rev. Cancer 16 (9): 582–598.
- 167 Noy, R. and Pollard, J.W. (2014). Tumor‐associated macrophages: from mechanisms to therapy. Immunity 41 (1): 49–61.
- 168 Hadrup, S., Donia, M., and Thor Straten, P. (2013). Effector CD4 and CD8 T cells and their role in the tumor microenvironment. Cancer Microenviron. 6 (2): 123–133.
- 169 Song, C., Piva, M., Sun, L. et al. (2017). Recurrent tumor cell‐intrinsic and ‐extrinsic alterations during MAPKi‐induced melanoma regression and early adaptation. Cancer Discov. 7 (11): 1248–1265.
- 170 Wherry, E.J. and Kurachi, M. (2015). Molecular and cellular insights into T cell exhaustion. Nat. Rev. Immunol. 15 (8): 486–499.
- 171 Yun, C.H., Mengwasser, K.E., Toms, A.V. et al. (2008). The T790M mutation in EGFR kinase causes drug resistance by increasing the affinity for ATP. Proc. Natl. Acad. Sci. U.S.A. 105 (6): 2070–2075.
- 172 Liu, Y., Sun, L., Xiong, Z.C. et al. (2017). Meta‐analysis of the impact of de novo and acquired EGFR T790M mutations on the prognosis of patients with non‐small cell lung cancer receiving EGFR‐TKIs. Onco. Targets Ther. 10: 2267–2279.
- 173 Sequist, L.V., Soria, J.C., Goldman, J.W. et al. (2015). Rociletinib in EGFR‐mutated non‐small‐cell lung cancer. N. Engl. J. Med. 372 (18): 1700–1709.
- 174 Janne, P.A., Yang, J.C., Kim, D.W. et al. (2015). AZD9291 in EGFR inhibitor‐resistant non‐small‐cell lung cancer. N. Engl. J. Med. 372 (18): 1689–1699.
- 175 Johnson, D.B., Menzies, A.M., Zimmer, L. et al. (2015). Acquired BRAF inhibitor resistance: a multicenter meta‐analysis of the spectrum and frequencies, clinical behaviour, and phenotypic associations of resistance mechanisms. Eur. J. Cancer 51 (18): 2792–2799.
- 176 Robert, C., Karaszewska, B., Schachter, J. et al. (2015). Improved overall survival in melanoma with combined dabrafenib and trametinib. N. Engl. J. Med. 372 (1): 30–39.
- 177 Larkin, J., Ascierto, P.A., Dreno, B. et al. (2014). Combined vemurafenib and cobimetinib in BRAF‐mutated melanoma. N. Engl. J. Med. 371 (20): 1867–1876.
- 178 Knudsen, E.S. and Witkiewicz, A.K. (2017). The strange case of CDK4/6 inhibitors: mechanisms, resistance, and combination strategies. Trends Cancer 3 (1): 39–55.
- 179 Prahallad, A., Sun, C., Huang, S. et al. (2012). Unresponsiveness of colon cancer to BRAF(V600E) inhibition through feedback activation of EGFR. Nature 483 (7387): 100–103.
- 180 Villanueva, J., Vultur, A., and Herlyn, M. (2011). Resistance to BRAF inhibitors: unraveling mechanisms and future treatment options. Cancer Res. 71 (23): 7137–7140.
- 181 Alexander, P.B. and Wang, X.F. (2015). Resistance to receptor tyrosine kinase inhibition in cancer: molecular mechanisms and therapeutic strategies. Front. Med. 9 (2): 134–138.
- 182 Zhang, Z., Lee, J.C., Lin, L. et al. (2012). Activation of the AXL kinase causes resistance to EGFR‐targeted therapy in lung cancer. Nat. Genet. 44 (8): 852–860.
- 183 Terai, H., Soejima, K., Yasuda, H. et al. (2013). Activation of the FGF2‐FGFR1 autocrine pathway: a novel mechanism of acquired resistance to gefitinib in NSCLC. Mol. Cancer Res. 11 (7): 759–767.
- 184 Turke, A.B., Zejnullahu, K., Wu, Y.L. et al. (2010). Preexistence and clonal selection of MET amplification in EGFR mutant NSCLC. Cancer Cell 17 (1): 77–88.
- 185 Courtois‐Cox, S., Jones, S.L., and Cichowski, K. (2008). Many roads lead to oncogene‐induced senescence. Oncogene 27 (20): 2801–2809.
- 186 Liu, X.L., Ding, J., and Meng, L.H. (2018). Oncogene‐induced senescence: a double edged sword in cancer. Acta. Pharmacol. Sin 39: 1553–1558.
- 187 Lund, A.H. and van Lohuizen, M. (2004). Epigenetics and cancer. Genes Dev. 18 (19): 2315–2335.
- 188 Baylin, S.B. and Jones, P.A. (2016). Epigenetic determinants of cancer. Cold Spring Harb. Perspect. Biol. 8 (9): a019505. https://doi.org/10.1101/cshperspect.a019505.
- 189 Hugo, W., Shi, H., Sun, L. et al. (2015). Non‐genomic and immune evolution of melanoma acquiring MAPKi resistance. Cell 162 (6): 1271–1285.
- 190 Wang, J., Huang, S.K., Marzese, D.M. et al. (2015). Epigenetic changes of EGFR have an important role in BRAF inhibitor‐resistant cutaneous melanomas. J. Invest. Dermatol. 135 (2): 532–541.
- 191 Jones, P.A., Issa, J.P., and Baylin, S. (2016). Targeting the cancer epigenome for therapy. Nat. Rev. Genet. 17 (10): 630–641.
- 192 Shaffer, S.M., Dunagin, M.C., Torborg, S.R. et al. (2017). Rare cell variability and drug‐induced reprogramming as a mode of cancer drug resistance. Nature 546 (7658): 431–435.
- 193 Sun, C., Wang, L., Huang, S. et al. (2014). Reversible and adaptive resistance to BRAF(V600E) inhibition in melanoma. Nature 508 (7494): 118–122.
- 194 Sharma, S.V., Lee, D.Y., Li, B. et al. (2010). A chromatin‐mediated reversible drug‐tolerant state in cancer cell subpopulations. Cell 141 (1): 69–80.
- 195 Knoechel, B., Roderick, J.E., Williamson, K.E. et al. (2014). An epigenetic mechanism of resistance to targeted therapy in T cell acute lymphoblastic leukemia. Nat. Genet. 46 (4): 364–370.