8
A Toxicological Application of Signal Transduction: Early Cellular Changes Can Be Indicative of Toxicity
Julie Vrana Miller1, Nicole Prince2, Julia A. Mouch2, and Jonathan W. Boyd3
1Cardno ChemRisk, Pittsburgh, PA, USA
2Department of Orthopaedics, West Virginia University School of Medicine, Morgantown, WV, USA
3Department of Orthopaedics and Department of Physiology and Pharmacology, West Virginia University School of Medicine, Morgantown, WV, USA
8.1 Introduction
The early cellular changes initiated by external stimuli (whether that be chemical, physical, or biological agents) can offer a host of information about the adaptive response and adverse effects related to individual chemical and mixture exposures. Notable examples of early cellular changes are perturbations of dynamic intracellular signaling networks and alterations in cellular bioenergetics, such as increased/decreased oxygen consumption or electron transport chain (ETC) uncoupling. Due to the interconnectivity of various effector proteins and biomolecules, activity at a distinct intracellular location can have consequences at distal locations. Furthermore, a true understanding of biological response to chemical exposures necessitates a better understanding of cellular changes in response to a range of concentrations (especially low‐dose exposures) and is essential to toxicity testing and chemical risk assessment. Finally, the ability to measure the rapid and dynamic cellular responses to exposure(s) is critical for an enhanced understanding of toxicity. The experimental conditions and assays capable of capturing relevant mechanistic information for toxicity testing will be discussed in this chapter. A better understanding of the mechanistic components related to chemical response has numerous implications across many fields, such as risk assessment for toxicology and target molecule/pathway analysis for drug development and pharmacology. With mechanistic data collected from various doses, intracellular proteins and biomolecules, and cellular endpoints, better toxicity prediction models can be developed for individual chemical and mixture risk assessment.
8.2 Classification of Toxic Agent and Exposure Effects: A Toxicological Perspective
Humans are continuously exposed to a plethora of chemicals. These chemicals can be traced to a variety of sources, such as environmental, pharmaceutical, or industrial. With the large scope of individual chemicals humans can be exposed to on a daily basis, this raises a question: what classifies a chemical or agent as “toxic?” A toxic agent, whether it be chemical, biological, or physical, can be classified by their use (e.g. pharmaceutical, pesticide, additive, etc.), source (e.g. man‐made, plant or animal toxin, etc.), target organ(s) (e.g. brain, liver, heart, etc.), and effects (e.g. cardiotoxicity, carcinogenicity, immunogenicity, etc.) [1]. A primary tenet of toxicology states that all chemical agents are toxic, but it is the dose that determines if an agent is toxic or safe [2]. While the classification of what constitutes an agent as toxic, and the threshold thereof, can be ambiguous, the experimental characterization of an agent that incorporates chemical properties and biological exposure effects can be very useful for toxicological risk assessment.
Appropriately characterizing biological effects of a single agent exposure can be a daunting task. Toxicological risk assessment quantitatively determines the possible effects of a xenobiotic on human health [1]. Xenobiotic exposures can provoke adverse, deleterious, or dangerous effects on an organism [3]. Conversely, some effects can be beneficial, such as pharmaceutical side effects of antihistamines (drowsiness) or oral contraceptives (decrease acne severity). To properly address the adverse or beneficial nature of a chemical exposure, the dose and time course of toxicity/adaptation should be properly elucidated.
8.2.1 Dose–Response for Chemical Exposure Toxicity Testing and Risk Assessment
A central concept for toxicity studies and risk assessment is the dose–response relationship [4]. Dose–response relationships are described by dose–response curves, in which the response variable can be any desired effect to be measured, such as cell death, survival, or cellular oxygen consumption; this response is measured across a range of doses to determine the doses required to elicit a response. There are many types of dose–response models used in toxicity testing, but the most dominant is the threshold model [5]. The threshold model has been used in many scientific disciplines, such as biology, pharmacology, and toxicology, and has been the primary model for regulatory agencies, such as the US Federal Drug Administration (FDA) and Environmental Protection Agency (EPA) [5]. In the threshold model, depending on the effect measured and assay sensitivity, there exists a dose below which the probability of a measured response for a sample or individual compared to control is zero [6]. This threshold dose is also referred to as the no‐observed‐adverse‐effect level (NOAEL) [7]. An alternative model, the hormesis model, has also proven useful for low‐dose (below the NOAEL) risk assessment [8] and has seen a recent surge in interest due to advances in molecular toxicology testing [4]. The hormesis model is a biphasic dose–response relationship and can be succinctly described as low‐dose activation followed by high‐dose inhibition, which can appear as a U‐shaped or J‐shaped dose–response curve [9].
The renewed interest in hormesis as a valid model for toxicity testing has opened the door for low‐dose biochemical and molecular toxicology research [9]. It is important to note that the hormetic dose–response relationships should also consider time in toxicity testing. This is due to the fact that hormesis responses may be a compensatory response that follows the initial disruption in homeostasis, resulting in the characteristic low‐dose stimulatory response [10]. Biological systems are highly coordinated and dynamic [11]; the exclusion of temporal response in risk assessment modeling would ignore the ability of an organism to adapt and respond to a low‐dose exposure. Therefore, toxicological risk assessment needs to be inclusive of the spatiotemporal aspect of biological response post‐exposure as well as a wide range of doses, including low doses.
8.2.2 Chemical Mixtures
Current chemical exposure risk assessment is primarily carried out for single xenobiotics [12]. However, in reality, humans are continuously exposed to a vast number of components, whether they be chemical, physical, or biological agents, at various doses, and through a variety of exposure routes on a daily basis [13]. Understanding and ultimately predicting the possible combined effects of a given mixture exposure is necessary for risk assessment toxicology. There are two types of mixtures: simple and complex. Simple mixtures contain a small number of different chemicals, and the composition is known. Complex mixtures contain hundreds to thousands of individual chemicals, of which the composition (dose or constituents) is not known [14]. Experimentally determining all possible mixture combinations, or even binary mixtures, for a range of doses at different time points is not physically or financially possible [12]. Therefore, adequate models capable of predicting mixture responses are necessary for various sectors, such as pharmacological adverse interaction risk assessments and environmental exposure risk assessments. The two most commonly used and accepted mixture prediction models are Loewe additivity (dose addition) and Bliss independence (response addition) [15].
Dose addition is typically used when two or more chemical agents have a similar mechanism of action [16]. Dose addition is based on the theory that two chemicals in a mixture act as a dilution of each other [17, 18]. Traditional dose additivity can be described as shown in Eq. (8.1):

where α′ is the dose of the chemical i when administered as a mixture producing response E and α is the concentration of the chemical agent, i, required to produce the response effect E when administered alone (single exposure). Equation (8.1) can be used for n number of agents as a mixture. If the overall expression is <1, the mixture is considered synergistic. Conversely, if the overall expression is >1, the mixture is considered antagonistic [19].
Response addition (Bliss independence) is typically used for two (or more) chemicals that do not have the same mechanism of action, that is, the organism will respond to each chemical agent independently, as though the other agent(s) are not present [15, 20]. The prediction of mixture effects using response addition is equivalent to the conditional sum of independent chemical effect probabilities [21]. Response addition can be described by expression (Eq. 8.2)
where F(αi) is the response effect produced by chemical i at dose α. Since this is a probabilistic model, F(αi) cannot be greater than 1. Dose addition and response addition models are generalizations of nonlinear regression models, such as a Gompertz growth curve or Hill plot, and can be easily compared with observed mixture dose–response curves [19, 21].
8.2.3 Mode of Action Versus Mechanism of Action
Regulatory guidelines for mixture risk assessments rely heavily on the similarity (or dissimilarity) of two chemical components' mechanistic information for model selection of a given mixture [22–27]. In this discussion of prediction models for mixture toxicity, the term “mechanism of action” is used loosely. The term “mechanism” of action is often used interchangeably with “mode” of action [16]. However, these terms have specific definitions but are often defined differently depending upon the literature article cited [28, 29]. Traditionally, “mechanism of action” refers to the series of molecular events from the absorption of an effective dose of an agent to the eventual biological response [30]. To fully describe the mechanism of action for a chemical, each component outlined in Figure 8.1 would need to be determined experimentally.

Figure 8.1 Mechanism of action. Schematic outlining the components necessary to elucidate the mechanism of action for an exposure. All steps must include the temporal and dose components to fully understand mechanism of action for a given chemical or mixture exposure.
The term “mode of action” is a more generalized means to describe a chemical's action on a given organism [31]. The term “mode of action” describes the type of observed response of an organism exposed to a given chemical or mixture and may only refer to the significant events or components of the mechanism necessary for producing a particular biological response or toxic effect [32]. Regardless of the terminology, the suitability of either model for a given experiment or effect prediction remains debatable when thorough mechanisms or modes of action are unknown, especially for low‐dose studies [29, 33]. Often, the models fail to predict mixtures toxicity when an observed mixture acts synergistically [34, 35] and antagonistically [36, 37] or with dose‐dependent subtle interactions (e.g. synergy for low‐dose mixtures and antagonist for high‐dose mixtures) [38, 39]. To address these challenges, future model development should incorporate low‐dose (i.e. below the NOAEL) mixtures mechanistic effects on the appropriate spatiotemporal scale.
8.3 Early Cellular Changes Post‐exposure
Understanding and ultimately predicting potential biological effects and health outcomes from single chemical or mixture exposure remains an arduous task for risk assessment. The predominant approach for toxicity testing relies heavily on whole animal studies evaluating observable apical responses, such as clinical effects or pathologic changes from high‐dose exposures [29]. While many of these studies have been thorough, the amount of time and resources required to carry out this low‐throughput methodology has left this approach unable to meet the demands of current toxicology needs [40]. The enormous backlog of chemicals waiting to be evaluated for toxic outcome has inspired a paradigm shift in toxicity testing, proposed by the US National Research Council (NRC) report, Toxicity Testing in the 21st Century: A Vision and a Strategy [40, 41]. The NRC proposed a transition from in vivo low‐throughput animal toxicity testing to an in vitro high‐throughput approach utilizing well‐designed mechanistic information‐based assays. This in vitro approach would take advantage of early cellular perturbations post‐exposure associated with toxicity endpoints in human cell lines and tissues to elucidate mechanistically relevant information regarding the mode(s) of action for a potential xenobiotic or mixture [42]. Additionally, the high‐throughput nature of this approach would allow for testing on a wide range of doses, especially low doses, which is not currently possible with traditional whole animal studies [41]. New risk assessment approaches would include a suite of assays in order to cast a wide net on early cellular changes, such as changes in cellular bioenergetics, and various pathway perturbations, such as alterations in posttranslational modifications (PTMs) post‐exposure, to fully understand the cellular response, whether that be adaptation after exposure to a new homeostatic state or cell death [43].
Recent advances in systems toxicology have opened the door for the collection and analysis of large amounts of mechanistic data across a wide dosing range and time scale. Incorporating toxicodynamic factors for risk assessment can aid in our understanding of xenobiotic toxicity. The term toxicodynamics can be succinctly described as what the toxicant does to the body (as opposed to toxicokinetics, which describe what happens to the toxicant once it is in the body). Toxicodynamic analyses interrogate the spatiotemporal interaction of a xenobiotic with biological targets, the corresponding disruption of molecular pathways and bioenergetics, and downstream effects after exposure [44].
Marrying toxicokinetic and toxicodynamic approaches for risk assessment can offer a wealth of knowledge regarding xenobiotic exposure and the biological perturbations associated with exposure and subsequent effects (Figure 8.2). Perturbations of biological processes by xenobiotic exposure can elicit early cellular changes, leading to an adaptive stress response for continued survival or adverse response leading to toxicity [45]. Early cellular changes corresponding to toxicodynamics will be highlighted in this chapter, specifically intracellular signaling perturbations (e.g. PTMs after chemical exposure) and alterations in cellular bioenergetics.

Figure 8.2 Early cellular changes related to biological outcome. Toxicokinetic components of exposure involve the absorption of the chemical exposure, biotransformation, and distribution, resulting in the tissue dose. The chemical then interacts with molecular targets, perturbing endogenous pathways and processes, resulting in early cellular changes, which contributes to the toxicodynamic response post‐exposure. Early cellular changes can lead to adverse effects (toxicity) or adaptive response and survival.
Source: Adapted from Andersen and Krewski [43]. Reproduced with permission of Oxford University Press.
8.3.1 Intracellular Signaling Perturbations Associated with Exposure
The toxicodynamic components of early cellular changes, biological perturbations, and their associated responses yield valuable mechanistic information for toxicity risk assessment. Early and late effects associated with chemical exposure are mediated by plasma membrane receptor proteins acting as sensors for their downstream signaling pathways [41]. Signaling pathways are not static, linear pathways that simply transmit signals, but rather are responsible for encoding and integrating both internal and external cues [46]. Exposure to chemical insults can perturb the dynamic and highly coordinated signaling pathways responsible for normal biological function and maintenance [47]. Additionally, chemical insult at one molecular target and pathway can propagate throughout the signaling network due to pathway crosstalk and the interconnectivity of various signaling cascades [11]. As such, cellular spatiotemporal signaling dynamics are responsible for integrating and interpreting intra‐ and extracellular cues to make cellular fate decisions, such as proliferation, differentiation, or programmed cell death (apoptosis) [11, 48, 49].
Signaling networks are primarily regulated by PTMs. As discussed in Chapter 2, PTMs are vital to signaling coordination and diversification of proteins for various functions [50, 51]. PTMs can modify proteins after translation via complex molecules (glycosylation and isoprenylation), peptides or proteins (ubiquitylation and SUMOylation), chemical groups (acetylation, methylation, and phosphorylation), and cleavage (proteolysis) [52].
Phosphorylation is a PTM that can provide key insights into the early and rapid cellular changes that result from xenobiotic exposures. The rapid toxicodynamic response of cells to xenobiotics is primarily coordinated by these signal transduction networks, which follow a simple framework: the phosphorylation/dephosphorylation cycle mediated by kinases and phosphatases [53, 54]. Kinases are intimately involved in the regulation of signaling events relevant to cellular death and survival processes [55]. Xenobiotics can interfere with kinase signaling via activation (e.g. overstimulation) or inhibition [44]. Kinases can be activated/deactivated via the addition or removal of a phosphate group at serine, threonine, and tyrosine residues (─OH containing amino acids) [50], shown in Figure 8.3. The phosphorylation/dephosphorylation of a protein acts as a molecular switch to activate or deactivate a protein. In the catalytic domain of protein kinases, the ─OH group on serine, threonine, and tyrosine residues acts as a nucleophile, attacking the γ‐phosphate on adenosine triphosphate (ATP), resulting in the transfer of a phosphoryl group to the protein [56]. In this scheme, magnesium is a critical component for protein phosphorylation, acting as a supportive chelator. The covalent bonding between phosphate groups and protein kinases typically induces a conformational change, aiding or preventing protein–protein (enzyme–substrate) interactions [57]. It is this protein–protein/enzyme–substrate interaction where critical cellular information can be transmitted throughout the signaling network.

Figure 8.3 Mechanism of phosphorylation. This reaction scheme uses serine as the example residue; however, this mechanism is true for tyrosine and threonine phosphorylation as well.
Under xenobiotic stress conditions, many pathways can be perturbed, including survival and death pathways. The three major stress‐activated pathways are the mitogen‐activated protein kinase (MAPK) pathway (also commonly referred to as extracellular signal‐regulated kinases [ERK] pathway), the stress‐activated protein kinase (SAPK) pathway (also commonly referred to as Jun N‐terminal kinase [JNK] pathway), and the p38 pathway [58–60]. These stress pathways are endogenously activated, controlling cellular fate via transcriptional upregulation and/or inhibition of genes responsible for either survival/proliferation or cell death [44]. These pathways were traditionally thought of as discrete linear signaling cascades; however, it is now well known that they are merely components of a dynamic and highly interconnected network of pathways that contain many crosstalk, feedback, and feedforward mechanisms to adequately and efficiently respond to a variety of stress‐inducing stimuli [11, 61]. Therefore, it is the delicate balance/imbalance of these pathways that decides the cell's ultimate fate [55, 62]. The highly dynamic and interconnected nature of signaling networks has made it increasingly difficult to elucidate and predict network responses to xenobiotic stress. However, advances in computational and network biology; high‐throughput experimental techniques such as ‐omics investigations using mass spectrometry, multiplex bead‐based enzyme‐linked immunosorbent assay (ELISA) suspension array systems, and microchip arrays; and public databases have greatly improved signaling research. With these advances, new toxicological risk assessment approaches for determining potential toxic outcome of a xenobiotic or mixture using mechanistic information can be attempted, as postulated by the NRC report [40].
8.3.2 Bioenergetic Changes Post‐exposure
Kinase signaling is an energy‐demanding process, and its reliance on phosphorylation results in the consumption of substantial amounts of available ATP [63]. ATP production governs ATP‐consuming processes, such as signal transduction in mammalian cells, and this production is primarily driven by oxidative phosphorylation within mitochondria [64, 65]. Mitochondria are the energy production hub of a cell via production of ATP and, of equal importance, are key mediators in kinase signal transduction, regulating cell survival, proliferation, differentiation, and death [63, 66]. Due to their critical role in many cellular processes, mitochondria are also susceptible to xenobiotic exposure effects. Additionally, irreversible processes leading to cell death primarily rely on two mitochondria‐related phenomena: (i) the inability to reverse mitochondrial dysfunction, resulting in ATP depletion, and (ii) the disturbance of membrane function (both mitochondrial membrane and plasma membrane) [67]. Therefore, maintenance of mitochondrial bioenergetics and integrity is critical to cellular fate.
Mitochondria are composed of several key features: the outer mitochondrial membrane, intermembrane space, inner mitochondrial membrane, and matrix. The outer mitochondrial membrane is permeable to small molecules (molecular weight <5000 g/mol) and ions, which readily diffuse through transmembrane porin proteins, such as voltage‐gated anion channel (VDAC) [68]. The inner membrane, however, is impermeable to most molecules and ions, including protons and ATP [69] unless actively aided via a transporter. The inner membrane contains the proteins that make up the ETC. Additionally, the inner membrane contains numerous transport proteins that allow metabolites to pass through into the matrix and to export ATP generated by the ETC into the intermembrane space [68] (the space between the two membranes). The intermembrane contains a small heme‐containing protein called cytochrome c within the intermembrane side of inner membrane folds (referred to as intracristae space), which acts as an electron carrier for complex III on the ETC and, when released from the outer membrane, can initiate caspase‐dependent apoptosis [70, 71]. The protein adenine nucleotide translocase (ANT) is the transporter responsible for shuttling ATP from the matrix to the intermembrane space [68]. Additionally, ANT forms a complex with VDAC (an outer mitochondrial membrane transporter), commonly referred to as the permeability transition pore (PTP) that can compromise the impermeability of the mitochondrial membranes. If the PTP is open, an influx of ions and water can bombard the matrix, causing swelling, loss of membrane potential, and uncoupling of oxidative phosphorylation, eventually leading to cell death [72]. Finally, the matrix, which is in the space contained by the inner membrane, houses all energy‐yielding oxidative reactions, such as the citric acid cycle, fatty acid oxidation, and the ETC [68]. The matrix also contains important ions (magnesium, calcium, and potassium), metabolic intermediates, ATP/ADP, and mitochondrial DNA (that is transcribed and translated within the matrix).
The number of mitochondria in each eukaryotic cell can vary depending upon the cell type. Red blood cells (erythrocytes) do not have mitochondria; however, the heart, kidney, and liver are considered mitochondria rich [73]. Mitochondria‐rich cell types are especially sensitive to xenobiotics that target the ETC. There are two classes of ETC inhibitors: (i) xenobiotics that block the transport of electrons via binding to ETC enzyme complexes (e.g. deguelin binding to complex I) and (ii) xenobiotics that stimulate/inhibit the flow of electrons at one portion of the ETC but shunt electrons away from their normal route by acting as an electron acceptor. Disruption of normal ETC function and mitochondrial bioenergetics can have deleterious effects (both acute and chronic) on the target tissue as well as whole organism. Examples of pathological conditions where mitochondrial dysfunction plays a critical role are neurodegenerative diseases, neurotoxicity, heart disease (myocardial infarction and atherosclerosis), liver injury (ischemic injury and cholestasis), obesity, and cancer [71, 74]. Thus, mitochondrial bioenergetics should be carefully considered and included in toxicity risk assessment.
8.3.3 Time Scale of Exposure Effects
The toxicity of a xenobiotic or mixture at their intended molecular/tissue target(s) can vary over exposure time, and any change is commonly known as time‐dependent toxicity [75]. The initial toxicodynamic response to any xenobiotic or mixture exposure is predominantly coordinated by signal transduction networks, which can initiate response within the first few seconds to minutes of exposure. The time course from initial toxicodynamic response(s) to cell death following exposure can have a vast range [76]. For example, the time delay between xenobiotic exposure and execution of apoptosis can take from several hours to over a day [77, 78]. With this in mind, monitoring early cellular changes that contribute to adaptive stress response (survival and new homeostatic state) or lead to adverse effects (apoptosis, carcinogenicity) may aid toxicological understanding and ultimately the prediction of potential adverse effects from xenobiotic or mixture exposures.
8.4 Experimentally Testing Early Cellular Changes that May Contribute to Exposure Sensing and Response
Traditional risk assessment testing techniques involve screening potential agents using in vivo and in vitro endpoint experiments, such as neurotoxicity or developmental toxicity, and mode of action analysis, such as cytotoxicity or mutagenicity [79]. However, the recent paradigm shift charged by the NRC report has initiated a new chemical risk assessment approach that utilizes high‐throughput in vitro screening assays to exploit early cellular changes (such as signaling pathway perturbations and alterations in cellular bioenergetics) to reveal mechanistic information about adverse or adaptive effects after xenobiotic exposure.
8.4.1 Paradigm Shift Toward In Vitro Cell Culture
The large number of potential toxic chemical agents that have yet to be fully characterized poses a significant problem for risk assessment testing [40]. Traditional in vivo methods cannot be solely relied on for risk assessment testing due to the low throughput, high financial and time cost, and the sheer number of animals necessary to test the thousands of chemicals yet to be evaluated. Further, the utility of mechanistic information from animal studies has been questionable due to disappointing cross‐species extrapolation for real‐life low‐dose human exposure effects [47]. Thus, a paradigm shift from traditional in vivo methods to an in vitro approach utilizing assays to collect mechanistic information for pathway/network analyses and eventual prediction modeling with computational toxicology has been initiated by the NRC report [40]. The NRC suggested human in vitro high‐throughput screening assays to measure early cellular effects, such as perturbations of critical signaling pathways related to survival and death (referred to as potential adverse outcome pathways by the NRC), across a wide dosing range and multiple cell lines, both immortalized and primary cell culture [80].
The paradigm shift from traditional in vivo animal studies to new in vitro high‐throughput screening assays using human cell lines raises some new questions. What cell type should be used (immortalized versus primary)? Primary cell culture is culture that is initiated immediately following tissue extraction from the sample organism. Once the cells reach confluency (typically 80% of the culture‐containing flask covered by cells, without overlapping each other), cells need to be subcultured (also known as passaging) by dividing the cells into multiple culture flasks for continued growth. Primary cell culture can typically only be subcultured a few times before they can no longer be used. On the other hand, immortalized (continuous) culture is when cells are cultured for a theoretically infinite number of subcultures, which is achieved via transformation (spontaneously transformed via cancerous cell lines or chemically induced immortalization). Immortalized/continuous cell lines offer a low cost in vitro experimental setup but may result in disparate responses than those achieved in primary culture or in vivo due to their continuous cell cycle progression. Even though the response may be slightly different from immortalized to primary or in vivo studies, useful mechanistic information can be collected for toxicity risk assessment. Fortunately, there are several cell lines commercially available that have libraries of data, such as human hepatocellular carcinoma (HepG2) for liver toxicity [81], Michigan Cancer Foundation‐7 (MCF‐7) (human breast cancer) for estrogen‐responsive toxicity studies [82], and human embryonic kidney cells (HEK293) for kidney toxicity [83].
Liver injury and toxicity due to xenobiotic exposure is a major concern for pharmaceutical regulatory and toxicological risk assessment [84]. Additionally, the liver plays a vital role in xenobiotic biotransformation after exposure [85]. Thus, in vitro high‐throughput approaches using human‐derived liver cell lines to probe important early cellular exposure effects and potential pathway perturbations are necessary for toxicological risk assessment. The US EPA ToxCast research program was initiated to screen previously untested environmental chemicals for adverse effects using a large number of high‐throughput bioassays. Data collected from ToxCast assays are made available through the ToxCast data library to disseminate chemical exposure profiles to further toxicology research and gain a mechanistic understanding of chemical exposure [86]. The ToxCast library has two liver models for toxicity testing: primary rat hepatocytes and HepG2 cells [84]. Both models offer important information about hepatotoxicity. Due to the limited availability of human primary liver cells, rat primary hepatocytes are often used for hepatotoxicity risk assessments. Previous studies have shown that xenobiotic metabolizing enzymes have significant interspecies variation [87, 88]. An accepted alternative to primary rat hepatocytes for liver toxicity research is the HepG2 cell line. A benefit of using HepG2 versus primary rat hepatocytes is that they are human derived. Most importantly, the HepG2 cell line retains endogenous xenobiotic metabolizing enzymes, whereas primary hepatocyte culture typically loses these vital enzymes [89].
8.4.2 Real‐Time In Vitro Assays to Measure Early Cellular Changes
As discussed previously, initial cellular responses to xenobiotic exposure are rapid, dynamic, and highly integrated for determining eventual cellular fate. Assays capable of capturing these dynamic processes and relating them to apical outcomes (cell death, survival, plasma membrane degradation) are necessary for xenobiotic risk assessment predictions. Most real‐time assays used are related to mitochondrial bioenergetics (reduced form of nicotinamide adenine dinucleotide [NADH] production, cellular oxygen consumption, and estimations of ATP from NADH and oxygen consumption) and cell death (plasma membrane degradation).
8.4.2.1 Using NADH and Oxygen Consumption to Predict ATP Generation
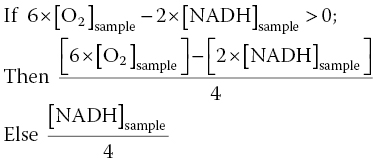
One of the most critical components of bioenergetics, ATP, can be measured to monitor cellular perturbations after xenobiotic exposure. Chapter 6 discussed assays for intracellular ATP that have employed fluorescent tags; however, this can potentially disrupt endogenous intracellular activity (e.g. Förster resonance energy transfer [FRET]) [90] or involve cell lysis (e.g. luciferase assay), making real‐time in vitro ATP measurements not possible [91]. Monitoring relative ATP generation in response to chemical insult without potentially disrupting sensitive intracellular activity is imperative. As mentioned in Chapter 6, NADH is extremely useful because it strongly absorbs at 340 nm and does not require any fluorescent tag or probe; therefore, real‐time kinetic measurements of cellular NADH can be obtained [92, 93]. To this end, the Boyd Lab has developed an extracellular approach to estimate ATP production with data collected from real‐time oxygen consumption and NADH production assays. These datasets allow for stoichiometric determinations of ATP production in real time. Theoretically, mitochondrial oxidative phosphorylation is responsible for producing a substantial portion of cellular ATP, and traditionally, NADH and oxygen are related to ATP production, as shown below [69, 94]:
Since our assay monitors oxygen consumption, the equation can be doubled:
Additionally, cells can produce ATP via glycolysis, where 1 ATP is generated for each available NADH. This may be particularly true for HepG2 cells, since many cancer cells have been shown to have a high reliance on glycolysis due to the Warburg effect [95, 96]. To account for ATP production when there is limited or no oxygen, an “if‐then‐else loop” was used to calculate theoretical ATP generation:
This method has proven successful for two disparate xenobiotics, demonstrating a strong correlation to relative ATP measurements collected via the luciferase assay [93].
8.4.3 Prediction of Posttranslational Phosphorylation Response for Mixtures
As previously mentioned, experimentally determining all possible mixture combinations for a range of doses at different time points is not possible. Therefore, prediction models capable of predicting mixture responses are necessary; however, even relatively simple binary mixture interactions can be difficult to predict based on the current lack of spatiotemporal mechanisms for the individual components. New risk assessment approaches would include a suite of assays that cast a wide net on early cellular changes, such as changes in cellular bioenergetics, and various pathway perturbations, such as alterations in PTMs post‐exposure, to fully understand the cellular response, whether that be adaptation after exposure to a new homeostatic state, or cell death [43]. Understanding and eventually predicting chemical mixture effects could not only elucidate potential risk factors associated with exposures but also offer the opportunity to estimate mixtures toxicity at various doses without measuring the actual mixture. With this new risk assessment methodology in mind, Boyd et al. [97] have shown that early pathway perturbation responses, such as phosphorylation PTMs, at time points relevant to critical signaling events, as indicated by an increase in relative oxygen consumption, to chemical mixture exposures (ETC inhibitors as well as broad kinase inhibitors) can be predicted in vitro using Bliss independence.
8.4.3.1 Using Bliss Independence (Response Addition) to Predict Relative Phosphorylation During Critical Signaling Events
To illustrate the utility of this method, two mitochondrial ETC inhibitors were used: deguelin (complex I ETC inhibitor) and potassium cyanide (KCN) (complex IV ETC inhibitor). The critical signaling event for deguelin and KCN was estimated to be 400 minutes post‐exposure using HepG2 cells and relative oxygen consumption observations [97]. Since alterations in oxygen consumption (cellular respiration) may suggest early perturbations of cellular bioenergetics and potentially adverse effects, Boyd et al. [97] chose a time point where all dosing conditions experienced the highest degree of change. At the identified time points post‐exposure, a snapshot of the toxicodynamic response to deguelin and KCN exposure can be determined with a high‐throughput approach. Inclusion of valuable proteins that cast a wide net on cell death or survival pathways at this time point is necessary to capture intracellular processes related to adverse or adaptive perturbation responses. After exposure to cellular stressors (e.g. xenobiotics, endogenous molecules), many kinase pathways converge upon mitochondria, which can result in mitochondrial membrane permeabilization (MMP)‐mediated death [71, 76]. From this, the list of potential proteins was narrowed to those that are only a few kinase steps removed from key survival or death proteins that are known to alter mitochondrial activity. To this end, a multiplex bead‐based ELISA assay was designed and used to simultaneously determine different protein phosphorylation responses for deguelin and KCN (Figure 8.4) at the estimated critical signaling event of 400 minutes post‐exposure. Cells were lysed and measured for phosphoprotein response at 400 minutes post‐exposure to deguelin and KCN alone (Figure 8.4) or as a chemical mixture (Appendix A). Phosphoprotein responses were determined relative to control, which received dosing vehicle (<1% dimethyl sulfoxide [DMSO] for deguelin or water for KCN).
Figure 8.4 Relative phosphorylation responses of HepG2 cells exposed to deguelin or KCN. Relative protein phosphorylation was determined by dosing HepG2 cells with various doses of deguelin (0.01–100 μM) or KCN (0.01–100 μM) and lysing the cell membrane at 400 minutes post‐exposure. Relative phosphorylation was calculated by normalizing to vehicle controls. Error bars reflect standard error of the mean (S.E.M.). Assay was performed in duplicate.
For the same mixture and dosing regimen, “predicted” relative phosphorylation responses at the key time points of interest were determined using Bliss independence (Appendix A) [97]. Experimentally determined phosphoprotein responses of individual chemicals were used to calculate predicted values at the time points of interest. To determine the accuracy of the prediction method, correlation analysis was used for observed and predicted relative phosphorylation responses (Figure 8.5). Prediction of relative phosphoprotein responses to deguelin and KCN mixtures at 400 minutes post‐exposure was strongly correlated to experimentally determined mixture phosphoprotein responses (r = 0.904, N = 200, P < 0.0001).

Figure 8.5 Deguelin and KCN mixture correlation. Correlation plot of observed and Bliss independence‐predicted phosphoprotein mixture responses at 400 minutes post‐exposure. Data points represent the mean of the mixture response. For this mixture dataset, predicted values were strongly correlated to observed values, r(200) = 0.904, P < 0.0001.
By utilizing downstream convergence of intracellular signal transduction to simplify the understanding of xenobiotics that, when combined, result in toxicity, this method accurately predicted mixture interactions (87.5%). Not only was this method successful for mixture predictions on two chemicals with similar activity (inhibition of ETC activity), but it also proved to be successful for two disparate chemicals, deguelin and staurosporine, which is a broad kinase inhibitor. For deguelin and staurosporine mixtures, this method had 77.5% accuracy [97]. Thus, by monitoring a limited number of pathways, one can screen xenobiotics for potential mixture interactions.
In conclusion, this methodology may offer a new model for risk assessment capable of harnessing early cellular changes post‐exposure to predict potential mixture effects related to cytotoxicity in order to predict cellular fate. The approach presented in this chapter could be used to test the tens of thousands of chemicals currently used and predict all combinations at multiple doses that have the potential to be synergistic (i.e. greater than expected from additivity) or antagonistic (i.e. less than expected from additivity). This would then allow current risk assessment to narrow the experimental efforts to only those doses and chemicals of concern for further in vivo testing.
References
- 1 Casarett, L.J. and Klaassen, C.D. (eds.) (2008). Casarett and Doull's Toxicology: The Basic Science of Poisons. New York: McGraw‐Hill Medical.
- 2 Pottenger, L.H. and Gollapudi, B.B. (2009). A case for a new paradigm in genetic toxicology testing. Mutat. Res. 678 (2): 148–151.
- 3 Edwards, I.R. and Aronson, J.K. (2000). Adverse drug reactions: definitions, diagnosis, and management. Lancet 356 (9237): 1255–1259.
- 4 Calabrese, E.J. and Baldwin, L.A. (2003). Toxicology rethinks its central belief. Nature 421 (6924): 691–692.
- 5 Calabrese, E.J. and Baldwin, L.A. (2003). The hormetic dose‐response model is more common than the threshold model in toxicology. Toxicol. Sci. 71 (2): 246–250.
- 6 Cox, C. (1987). Threshold dose‐response models in toxicology. Biometrics 43 (3): 511–523.
- 7 Allen, B.C., Kavlock, R.J., Kimmel, C.A., and Faustman, E.M. (1994). Dose‐response assessment for developmental toxicity. II. Comparison of generic benchmark dose estimates with no observed adverse effect levels. Fundam. Appl. Toxicol. 23 (4): 487–495.
- 8 Calabrese, E.J. (2009). Getting the dose‐response wrong: why hormesis became marginalized and the threshold model accepted. Arch. Toxicol. 83 (3): 227–247.
- 9 Calabrese, E.J. (2008). Hormesis: why it is important to toxicology and toxicologists. Environ. Toxicol. Chem. 27 (7): 1451–1474.
- 10 Calabrese, E.J. (2001). Overcompensation stimulation: a mechanism for hormetic effects. Crit. Rev. Toxicol. 31 (4–5): 425–470.
- 11 Kholodenko, B.N., Hancock, J.F., and Kolch, W. (2010). Signalling ballet in space and time. Nat. Rev. Mol. Cell Biol. 11 (6): 414–426.
- 12 Cedergreen, N., Christensen, A.M., Kamper, A. et al. (2008). A review of independent action compared to concentration addition as reference models for mixtures of compounds with different molecular target sites. Environ. Toxicol. Chem. 27 (7): 1621–1632.
- 13 Groten, J.P., Feron, V.J., and Suhnel, J. (2001). Toxicology of simple and complex mixtures. Trends Pharmacol. Sci. 22 (6): 316–322.
- 14 Feron, V.J., Groten, J.P., and van Bladeren, P.J. (1998). Exposure of humans to complex chemical mixtures: hazard identification and risk assessment. In: Diversification in Toxicology – Man and Environment, Archives of Toxicology, vol. 20 (ed. J.P. Seiler, J.L. Autrup and H. Autrup), 363–373. Berlin, Heidelberg: Springer.
- 15 McCarty, L.S. and Borgert, C.J. (2006). Review of the toxicity of chemical mixtures: theory, policy, and regulatory practice. Regul. Toxicol. Pharmacol. 45 (2): 119–143.
- 16 Borgert, C.J., Quill, T.F., McCarty, L.S., and Mason, A.M. (2004). Can mode of action predict mixture toxicity for risk assessment? Toxicol. Appl. Pharmacol. 201 (2): 85–96.
- 17 Loewe, S. and Muischnek, H. (1926). Effect of combinations: mathematical basis of problem. Arch. Exp. Pathol. Pharmacol. 114: 313–326.
- 18 Berenbaum, M.C. (1989). What is synergy? Pharmacol. Rev. 41 (2): 93–141.
- 19 Rajapakse, N., Ong, D., and Kortenkamp, A. (2001). Defining the impact of weakly estrogenic chemicals on the action of steroidal estrogens. Toxicol. Sci. 60 (2): 296–304.
- 20 Bliss, C.I. (1939). The toxicity of poisons applied jointly. Ann. Appl. Biol. 26 (3): 585–615.
- 21 Boyd, J., Saksena, A., Patrone, J.B. et al. (2011). Exploring the boundaries of additivity: mixtures of NADH: quinone oxidoreductase inhibitors. Chem. Res. Toxicol. 24 (8): 1242–1250.
- 22 U.S. Environmental Protection Agency (1986). Guidelines for the Health Risk Assessment of Chemical Mixtures. Washington, DC: EPA.
- 23 U.S. Environmental Protection Agency (1999). Guidance for Identifying Pesticide Chemicals That Have a Common Mechanism of Toxicity. Washington, DC: EPA.
- 24 U.S. Environmental Protection Agency (2000). Supplementary Guidance for Conducting Health Risk Assessment of Chemical Mixtures. Washington, DC: EPA.
- 25 U.S. Environmental Protection Agency (2002). Guidance on Cumulative Risk Assessment of Pesticide Chemicals That Have a Common Mechanism of Toxicity. Washington, DC: EPA.
- 26 Agency for Toxic Substance and Disease Registry (2001). Guidance for the Preparation of an Interaction Profile. Atlanta, GA: HHS.
- 27 Agency for Toxic Substance and Disease Registry (2001). Guidance Manual for the Assessment of Joint Toxic Action of Chemical Mixtures. Atlanta, GA: HHS.
- 28 Aptula, A.O. and Roberts, D.W. (2006). Mechanistic applicability domains for nonanimal‐based prediction of toxicological end points: general principles and application to reactive toxicity. Chem. Res. Toxicol. 19 (8): 1097–1105.
- 29 Spurgeon, D.J., Jones, O.A., Dorne, J.L. et al. (2010). Systems toxicology approaches for understanding the joint effects of environmental chemical mixtures. Sci. Total Environ. 408 (18): 3725–3734.
- 30 Butterworth, B.E., Conolly, R.B., and Morgan, K.T. (1995). A strategy for establishing mode of action of chemical carcinogens as a guide for approaches to risk assessments. Cancer Lett. 93 (1): 129–146.
- 31 Schlosser, P.M. and Bogdanffy, M.S. (1999). Determining modes of action for biologically based risk assessments. Regul. Toxicol. Pharmacol. 30 (1): 75–79.
- 32 Dellarco, V.L. and Wiltse, J.A. (1998). US Environmental Protection Agency's revised guidelines for Carcinogen Risk Assessment: incorporating mode of action data. Mutat. Res. 405 (2): 273–277.
- 33 Jonker, M.J., Svendsen, C., Bedaux, J.J. et al. (2005). Significance testing of synergistic/antagonistic, dose level‐dependent, or dose ratio‐dependent effects in mixture dose‐response analysis. Environ. Toxicol. Chem. 24 (10): 2701–2713.
- 34 Meled, M., Thrasyvoulou, A., and Belzunces, L.P. (1998). Seasonal variations in susceptibility of Apis mellifera to the synergistic action of prochloraz and deltamethrin. Environ. Toxicol. Chem. 17 (12): 2517–2520.
- 35 Forget, J., Pavillon, J.F., Beliaeff, B., and Bocquene, G. (1999). Joint action of pollutant combinations (pesticides and metals) on survival (LC50 values) and acetylcholinesterase activity of Tigriopus brevicornis (Copepoda, Harpacticoida). Environ. Toxicol. Chem. 18 (5): 912–918.
- 36 Posthuma, L., Baerselman, R., Van Veen, R.P., and Dirven‐Van Breemen, E.M. (1997). Single and joint toxic effects of copper and zinc on reproduction of Enchytraeus crypticus in relation to sorption of metals in soils. Ecotoxicol. Environ. Saf. 38 (2): 108–121.
- 37 Van Gestel, C.A.M. and Hensbergen, P.J. (1997). Interaction of Cd and Zn toxicity for Folsomia candida Willem (Collembola:Isotomidae) in relation to bioavailability in soil. Environ. Toxicol. Chem. 16 (6): 1177–1186.
- 38 Gennings, C., Carter, W., Campain, J. et al. (2002). Statistical analysis of interactive cytotoxicity in human epidermal keratinocytes following exposure to a mixture of four metals. J. Agric. Biol. Environ. Stat. 7: 58–73.
- 39 Jonker, M.J., Piskiewicz, A.M., Ivorra i Castella, N., and Kammenga, J.E. (2004). Toxicity of binary mixtures of cadmium‐copper and carbendazim‐copper to the nematode Caenorhabditis elegans. Environ. Toxicol. Chem. 23 (6): 1529–1537.
- 40 National Research Council (2007). Toxicity Testing in the 21st Century: A Vision and A Strategy. Washington, DC: National Academies Press.
- 41 Bhattacharya, S., Zhang, Q., Carmichael, P.L. et al. (2011). Toxicity testing in the 21 century: defining new risk assessment approaches based on perturbation of intracellular toxicity pathways. PLoS One 6 (6): e20887.
- 42 Attene‐Ramos, M.S., Miller, N., Huang, R. et al. (2013). The Tox21 robotic platform for the assessment of environmental chemicals – from vision to reality. Drug Discov. Today 18 (15–16): 716–723.
- 43 Andersen, M.E. and Krewski, D. (2009). Toxicity testing in the 21st century: bringing the vision to life. Toxicol. Sci. 107 (2): 324–330.
- 44 Boelsterli, U.A. (2007). Mechanistic Toxicology: The Molecular Basis of How Chemicals Disrupt Biological Targets, 2e. Boca Raton, FL: CRC Press.
- 45 Andersen, M.E. (2010). Calling on science: making “alternatives” the new gold standard. ALTEX 27: 29–37.
- 46 Kholodenko, B.N. (2006). Cell‐signalling dynamics in time and space. Nat. Rev. Mol. Cell. Biol. 7 (3): 165–176.
- 47 Houck, K.A. and Kavlock, R.J. (2008). Understanding mechanisms of toxicity: insights from drug discovery research. Toxicol. Appl. Pharmacol. 227 (2): 163–178.
- 48 Murphy, L.O., MacKeigan, J.P., and Blenis, J. (2004). A network of immediate early gene products propagates subtle differences in mitogen‐activated protein kinase signal amplitude and duration. Mol. Cell. Biol. 24 (1): 144–153.
- 49 von Kriegsheim, A., Baiocchi, D., Birtwistle, M. et al. (2009). Cell fate decisions are specified by the dynamic ERK interactome. Nat. Cell. Biol. 11 (12): 1458–1464.
- 50 Wold, F. (1981). In vivo chemical modification of proteins (post‐translational modification). Annu. Rev. Biochem. 50: 783–814.
- 51 Aye‐Han, N.N., Ni, Q., and Zhang, J. (2009). Fluorescent biosensors for real‐time tracking of post‐translational modification dynamics. Curr. Opin. Chem. Biol. 13 (4): 392–397.
- 52 Wang, Y.C., Peterson, S.E., and Loring, J.F. (2014). Protein post‐translational modifications and regulation of pluripotency in human stem cells. Cell Res. 24 (2): 143–160.
- 53 Kumar, D., Srikanth, R., Ahlfors, H. et al. (2007). Capturing cell‐fate decisions from the molecular signatures of a receptor‐dependent signaling response. Mol. Syst. Biol. 3: 150.
- 54 Schilling, M., Maiwald, T., Hengl, S. et al. (2009). Theoretical and experimental analysis links isoform‐specific ERK signalling to cell fate decisions. Mol. Syst. Biol. 5: 334.
- 55 Bononi, A., Agnoletto, C., De Marchi, E. et al. (2011). Protein kinases and phosphatases in the control of cell fate. Enzyme Res. 2011: 329098.
- 56 Endicott, J.A., Noble, M.E., and Johnson, L.N. (2012). The structural basis for control of eukaryotic protein kinases. Annu. Rev. Biochem. 81: 587–613.
- 57 Wang, Y., Eddy, J.A., and Price, N.D. (2012). Reconstruction of genome‐scale metabolic models for 126 human tissues using mCADRE. BMC Syst. Biol. 6: 153.
- 58 Paul, A., Wilson, S., Belham, C.M. et al. (1997). Stress‐activated protein kinases: activation, regulation and function. Cell Signal. 9 (6): 403–410.
- 59 Tibbles, L.A. and Woodgett, J.R. (1999). The stress‐activated protein kinase pathways. Cell. Mol. Life Sci. 55 (10): 1230–1254.
- 60 Pouyssegur, J., Volmat, V., and Lenormand, P. (2002). Fidelity and spatio‐temporal control in MAP kinase (ERKs) signalling. Biochem. Pharmacol. 64 (5–6): 755–763.
- 61 Junttila, M.R., Li, S.P., and Westermarck, J. (2008). Phosphatase‐mediated crosstalk between MAPK signaling pathways in the regulation of cell survival. FASEB J 22 (4): 954–965.
- 62 Currie, H.N., Vrana, J.A., Han, A.A. et al. (2014). An approach to investigate intracellular protein network responses. Chem. Res. Toxicol. 27 (1): 17–26.
- 63 Hammerman, P.S., Fox, C.J., and Thompson, C.B. (2004). Beginnings of a signal‐transduction pathway for bioenergetic control of cell survival. Trends Biochem. Sci. 29 (11): 586–592.
- 64 Buttgereit, F. and Brand, M.D. (1995). A hierarchy of ATP‐consuming processes in mammalian cells. Biochem. J. 312 (Pt 1): 163–167.
- 65 Ainscow, E.K. and Brand, M.D. (1999). Top‐down control analysis of ATP turnover, glycolysis and oxidative phosphorylation in rat hepatocytes. Eur. J. Biochem. 263 (3): 671–685.
- 66 Mohamed, S.M., Veeranarayanan, S., Minegishi, H. et al. (2014). Cytological and subcellular response of cells exposed to the type‐1 RIP curcin and its hemocompatibility analysis. Sci. Rep. 4: 5747.
- 67 Law, M. and Elmore, S. (2008). Mechanisms of cell death. In: Molecular and Biochemical Toxicology, 5e (ed. R.C. Smart and E. Hodgson), 327–369. Hoboken: Wiley.
- 68 Ninomiya‐Tsuji, J. (2008). Mitochondrial dysfunction. In: Molecular and Biochemical Toxicology, 5e (ed. R.C. Smart and E. Hodgson), 371–389. Hoboken: Wiley.
- 69 Lehninger, A., Cox, M.M., and Nelson, D.L. (eds.) (2008). Lehninger Principles of Biochemistry, W. New York: H. Freeman.
- 70 Desagher, S. and Martinou, J.C. (2000). Mitochondria as the central control point of apoptosis. Trends Cell. Biol. 10 (9): 369–377.
- 71 Kroemer, G., Galluzzi, L., and Brenner, C. (2007). Mitochondrial membrane permeabilization in cell death. Physiol. Rev. 87 (1): 99–163.
- 72 Fosslien, E. (2001). Mitochondrial medicine—molecular pathology of defective oxidative phosphorylation. Ann. Clin. Lab. Sci. 31 (1): 25–67.
- 73 Veltri, K.L., Espiritu, M., and Singh, G. (1990). Distinct genomic copy number in mitochondria of different mammalian organs. J. Cell. Physiol. 143 (1): 160–164.
- 74 Nunnari, J. and Suomalainen, A. (2012). Mitochondria: in sickness and in health. Cell 148 (6): 1145–1159.
- 75 Dawson, D.A., Allen, E.M., Allen, J.L. et al. (2014). Time‐dependence in mixture toxicity prediction. Toxicology 326: 153–163.
- 76 Rehm, M., Huber, H.J., Hellwig, C.T. et al. (2009). Dynamics of outer mitochondrial membrane permeabilization during apoptosis. Cell Death Differ. 16 (4): 613–623.
- 77 Lemasters, J.J., Nieminen, A.L., Qian, T. et al. (1998). The mitochondrial permeability transition in cell death: a common mechanism in necrosis, apoptosis and autophagy. Biochim. Biophys. Acta. 1366 (1–2): 177–196.
- 78 Messam, C.A. and Pittman, R.N. (1998). Asynchrony and commitment to die during apoptosis. Exp. Cell. Res. 238 (2): 389–398.
- 79 Dix, D.J., Houck, K.A., Martin, M.T. et al. (2007). The ToxCast program for prioritizing toxicity testing of environmental chemicals. Toxicol. Sci. 95 (1): 5–12.
- 80 Andersen, M.E., Al‐Zoughool, M., Croteau, M. et al. (2010). The future of toxicity testing. J. Toxicol. Environ. Health B. Crit. Rev. 13 (2‐4): 163–196.
- 81 O'Brien, P.J., Irwin, W., Diaz, D. et al. (2006). High concordance of drug‐induced human hepatotoxicity with in vitro cytotoxicity measured in a novel cell‐based model using high content screening. Arch. Toxicol. 80 (9): 580–604.
- 82 Holliday, D.L. and Speirs, V. (2011). Choosing the right cell line for breast cancer research. Breast Cancer Res. 13 (4): 215.
- 83 Sasaki, A., Oshima, Y., and Fujimura, A. (2007). An approach to elucidate potential mechanism of renal toxicity of arsenic trioxide. Exp. Hematol. 35 (2): 252–262.
- 84 Kavlock, R., Chandler, K., Houck, K. et al. (2012). Update on EPA's ToxCast program: providing high throughput decision support tools for chemical risk management. Chem. Res. Toxicol. 25 (7): 1287–1302.
- 85 Mersch‐Sundermann, V., Knasmuller, S., Wu, X.J. et al. (2004). Use of a human‐derived liver cell line for the detection of cytoprotective, antigenotoxic and cogenotoxic agents. Toxicology 198 (1–3): 329–340.
- 86 Sipes, N.S., Martin, M.T., Kothiya, P. et al. (2013). Profiling 976 ToxCast chemicals across 331 enzymatic and receptor signaling assays. Chem. Res. Toxicol. 26 (6): 878–895.
- 87 Selkirk, J.K. (1977). Divergence of metabolic activation systems for short‐term mutagenesis assays. Nature 270: 604–607.
- 88 Maslansky, C.J. and Williams, G.M. (1982). Primary cultures and the levels of cytochrome P450 in hepatocytes from mouse, rat, hamster, and rabbit liver. In Vitro 18 (8): 683–693.
- 89 Knasmuller, S., Parzefall, W., Sanyal, R. et al. (1998). Use of metabolically competent human hepatoma cells for the detection of mutagens and antimutagens. Mutat. Res. 402 (1–2): 185–202.
- 90 Berg, J., Hung, Y.P., and Yellen, G. (2009). A genetically encoded fluorescent reporter of ATP:ADP ratio. Nat. Methods 6 (2): 161–166.
- 91 Imamura, H., Nhat, K.P., Togawa, H. et al. (2009). Visualization of ATP levels inside single living cells with fluorescence resonance energy transfer‐based genetically encoded indicators. Proc. Natl. Acad. Sci. U.S.A. 106 (37): 15651–15656.
- 92 McComb, R.B., Bond, L.W., Burnett, R.W. et al. (1976). Determination of the molar absorptivity of NADH. Clin. Chem. 22 (2): 141–150.
- 93 Vrana, J.A., Currie, H.N., Han, A.A., and Boyd, J. (2014). Forecasting cell death dose‐response from early signal transduction responses in vitro. Toxicol. Sci. 140 (2): 338–351.
- 94 Kadenbach, B. (1986). Regulation of respiration and ATP synthesis in higher organisms: hypothesis. J. Bioenerg. Biomembr. 18 (1): 39–54.
- 95 Vander Heiden, M.G., Cantley, L.C., and Thompson, C.B. (2009). Understanding the Warburg effect: the metabolic requirements of cell proliferation. Science 324 (5930): 1029–1033.
- 96 Warburg, O. (1956). On the origin of cancer cells. Science 123 (3191): 309–314.
- 97 Boyd, J., Vrana, J.A., and Williams, H.N. (2013). In vitro approach to predict post‐translational phosphorylation response to mixtures. Toxicology 313 (2–3): 113–121.
Appendix A
Observed relative phosphorylation of deguelin and KCN mixtures (400 minutes post‐exposure).