Chapter 3
Transformations and Chemical Processes in Solar Energy Systems
Direct utilization of solar energy for heating, drying, and food processing has been practiced by human beings since time immemorial. These practices continue to be employed by people all over the world, particularly in developing countries, for satisfying their basic livelihood requirements. Development of sophisticated devices for improving the efficiency of such practices through modern technology is an exciting and vital field of research that will continue to make differences in the lives of a large percentage of humanity. The efficiency of utilization of solar energy can be improved significantly and its scope of application expanded without any practical limitation through indirect utilization by its conversion to electricity. As described in Chapter 2, Renewable Energy Sources, the conversion of solar energy into electrical energy takes place through either solar thermal (concentrating solar power [CSP]) systems or photovoltaic (PV) systems. Both these systems are described in detail, with a focus on chemical separations and processes, in this chapter.
3.1 Solar Thermal (CSP) Systems
Solar radiation incident on any surface or body is either absorbed, reflected, or transmitted by it. The absorbed radiant energy is converted into thermal energy as manifested by an increase in the temperature of the body or change in its physical state, and solar thermal devices operate using this thermal energy. Unfortunately, all bodies also lose energy by radiation, with the radiant energy spectrum that is characteristic of its temperature. If the body or surface behaves as a perfect black body, that is, having both absorptivity and emissivity of 1,1 then the efficiency of solar thermal energy capture (hec) is as shown in equation 3.1.
1. Absorptivity is the fraction of incident radiation absorbed by the body, the remaining being reflected or transmitted through. Emissivity is the ratio of power emitted by the body to the power emitted by a black body at the same temperature.
where T is the absolute temperature of the body in K, σ, the Stefan–Boltzmann constant (5.67×10⁻⁸ W/m2 K4), and I, the solar irradiance. The numerator in the second term on the right-hand side of equation 3.1 represents the power emitted by a black body at its temperature according to the Stefan–Boltzmann law. As mentioned in Chapter 2, Renewable Energy Sources, the intensity of solar radiation, the solar constant, has a value of 1360 W/m2. Equation 3.1 clearly indicates that the efficiency of the solar energy capture decreases with increasing temperature of the receiving body. On the other hand, if this body or medium is to be used for power generation, then temperatures as high as possible are desirable, as indicated by equation 3.2 for the Carnot cycle efficiency (hcc)—the theoretical maximum efficiency—for a heat engine operating between this temperature and Tsink, the temperature of the sink to which heat is rejected by the engine.
CSP systems function, as indicated by their name, by concentrating the solar radiant energy so that the denominator of the second term of equation 3.1 is increased. As a result, temperatures of the receiving medium can also be increased without any loss of efficiency in capturing solar radiant energy. The higher temperatures, in turn, allow the heat engines to operate at higher efficiencies.
Not all bodies are black bodies, that is, perfect absorbers and emitters of the radiant energy. Accounting for the absorptivity and emissivity of the body or the medium, the efficiency of solar energy capture for a CSP device can be expressed as follows [1]:
where a and e are the absorptivity and emissivity of the body, respectively, and C is the concentration factor by which the intensity of solar radiation is enhanced by the device. The alternative configurations used to accomplish this concentration of solar energy are described in the following section.
3.1.1 CSP Configurations
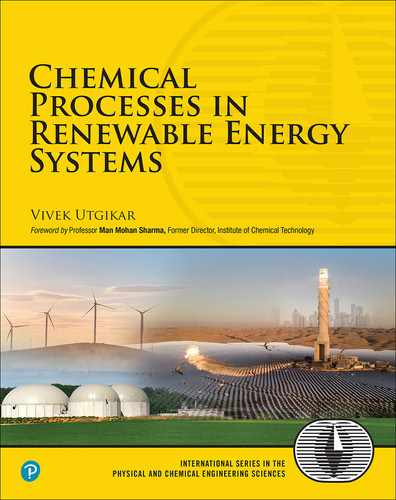
There are three primary configurations for CSP: linear systems, solar towers (STs), and parabolic dish (PD) systems [2, 3]. Linear systems include linear Fresnel reflectors (LFRs) and parabolic troughs (PTs). LFRs consist of several long, flat mirrors set at appropriate angles to reflect the sunlight to a centrally located linear receiver. PTs also consist of banks of long reflectors; however, the sunlight is concentrated at the focal points of each reflector. ST systems consist of a large number of mirrors, which track the position of the sun and reflect the radiation to a single point located high up on a tower. PD systems, similarly, use the reflection properties of its geometry to concentrate the radiation at its focal point. The schematic of these systems is represented in Figure 3.1.
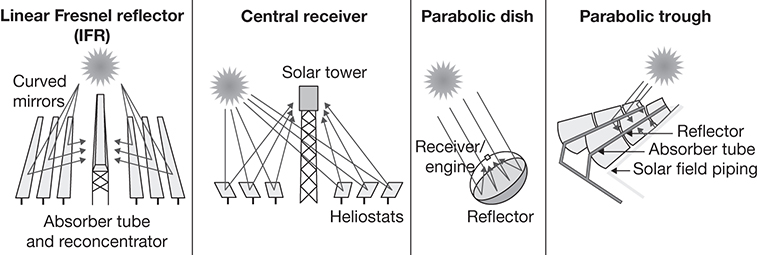
Figure 3.1 CSP configurations.
Source: International Energy Agency, Technology Roadmap: Solar Thermal Electricity, 2014 Edition, https://webstore.iea.org/download/direct/422.
LFRs and PTs are similar in operation, with reflectors located close to the ground and a linear collector that has only a slight elevation (3–4 m) above the ground. In addition, reflectors in both these systems can track the sun, however, only on a single axis. PDs and STs are more efficient as the reflectors in both these systems can be programmed to move in two axes, and thus track the path of the sun much better. The reflectors in ST systems are called heliostats, and each heliostat, moving independently of the other heliostats, reflects the radiation on to the receiver that may be located at an elevation in excess of 100 m above the ground level. Each PD is a single focal point system and requires a highly accurate and precise tracking mechanism for maximum efficiency.
Linear systems are typically able to achieve concentration factors ranging between 10 and 50. Both PDs and STs are able to achieve substantial concentration factors, with values as high as 500 for PDs and 1000 for STs [5]. With such high concentration factors, the receiving media in both STs and PDs can reach very high temperatures, potentially in excess of 1000°C, while the maximum temperatures in the linear systems are typically less than 500°C. With such high temperatures and concentration factors, the energy capture efficiencies of PDs and STs can be as high as 30%–35%, while the efficiencies of linear systems are typically between 10% and 15% [2]. In contrast, maximum temperatures in the simple flat plate collectors that are used in traditional, nonpower heating operations are less than 200°C, and the efficiencies are in single digits [5]. In terms of land-area requirements, STs have the greatest requirements of all systems. LFRs have the least area requirements, while the area requirements for PDs depend upon the scale of the system. The PD architecture is more complex than the other systems, with each dish concentrating the incident energy in its receiver, which moves along with the reflector as it tracks the sun. The receivers in other systems are static, and their integration into the power generation system is less complicated. The power conversion system—typically a Stirling heat engine—is also integrated in the receiver in a PD, increasing the efficiency of electricity generation, but also its complexity. PDs do have the advantage of being modular in nature, and any desired power output can be achieved by adding PDs as needed.
It can readily be seen from equation 3.3 that the efficiency of capture can be increased by increasing the concentration factor. This will make it possible to achieve higher temperatures in the receivers, which, in turn, will result in increasing the efficiency of power generation. Two-stage solar concentrators, which incorporate a secondary mirror in its architecture, can achieve ultrahigh (>1000) concentration factors. The conceptual schematic of a two-stage solar concentration is shown in Figure 3.2 [6].
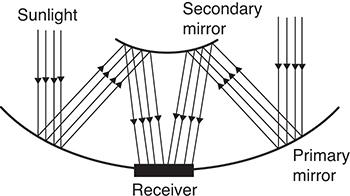
Figure 3.2 Conceptual schematic of a two-stage solar concentrator.
Source: Bushra, N., and T. Hartmann, “A Review of State-of-the-Art Reflective Two-Stage Solar Concentrators: Technology Categorization and Research Trends,” Renewable and Sustainable Energy Reviews, Vol. 114, 2019, p. 109307.
Higher concentration factors and increased capture efficiency also translate into a smaller footprint for any given power requirement. However, the system complexity is significantly higher for the two-stage solar concentrators. The control system mechanism is substantially more involved and challenging due to the need to manipulate the secondary mirror position as well. Furthermore, the secondary mirror, while much smaller than the primary mirror, will have some shading effect by intercepting a fraction of the solar radiation and preventing it from reaching the primary mirror. These concentrators are still in developmental stages; however, they show great promise for applications where only a limited land area is available for capturing solar radiation.
Solar energy captured by these devices is transformed into thermal energy of a medium circulating through the receiver. This medium is then cycled through a power generation system for producing electricity. Figure 3.3 shows schematics of simple systems in which water is used as the medium [7]. The advantage of using water as the medium is that it can be fed directly to a steam turbine for electricity generation, obviating the need for any intermediate heat exchange. A thermal energy storage component can also be incorporated, as shown in the figure. Water is a low-cost, nontoxic material that is readily available in most places, and the simplicity of the system makes it very attractive as the heat transfer medium. However, use of water puts limitations on the maximum temperatures that can be used in the system, and the mineral content gives rise to corrosion concerns [8].

Figure 3.3 Solar electricity generation using (a) PT and (b) ST systems.
Source: U.S. Department of Energy, “2014: The Year of Concentrating Solar Power,” Report #DOE/EE-1101, 2014.
Water is also not an effective thermal energy storage medium for power generation during the times when sunlight is not available. Several other media, including molten salts, oils, phase change materials, and solids, have been investigated for use as thermal energy storage media for their superior characteristics including low energy loss and higher temperatures as compared to water. Thermal energy storage in these media enables continued power generation at higher efficiencies due to higher temperatures available in the power conversion system. Transfer of thermal energy from the receiver to these storage media requires use of fluids other than water—typically oils, molten salts, or liquid metals. The conceptual schematic of a typical system utilizing substances other than water as the heat transfer medium in the receiver is shown in Figure 3.4.

Figure 3.4 Thermal energy storage and intermediate heat exchange in solar power generation.
Source: U.S. Department of Energy, “2014: The Year of Concentrating Solar Power,” Report #DOE/EE-1101, 2014.
It is possible to employ gases (air, steam, etc.) to store thermal energy; however, the very low volumetric energy density of such substances imposes large volume requirements, increasing the footprint of the power plant [9]. Furthermore, the system needs to be designed to prevent any leakage of the gases. Thermal energy storage using solid media—crushed rock, concrete, and so on—has also been investigated for overcoming the intermittency issues associated with solar energy. A recirculating fluid heat transfer medium is still used in these cases to transfer the thermal energy to the solid storage media. Thermal energy storage is discussed in more detail later in Chapter 6, Hybrid Energy Systems. This chapter focuses on the nonaqueous heat transfer/storage media and their chemistry. The three media specifically discussed include oils, molten salts, and liquid metals.
3.1.2 Chemistry and Processing of Solar Heat Exchange Media
The key thermophysical and transport properties for the heat exchange medium, or heat transfer fluid, in CSP are the following [10]:
Specific heat capacity, the amount of energy needed per unit mass of the fluid for raising its temperature by 1°. A fluid having higher heat capacity is able to store and transfer higher quantity of heat than one with lower specific heat capacity. This translates into lower inventory of the fluid for a given power duty, and hence lower capital costs for the system.
Thermal conductivity, a measure of the ability of the fluid to conduct heat by molecular transport. Higher thermal conductivity means faster heat transfer into and out of the fluid, resulting in smaller heat exchange equipment, again lowering the capital costs.
Viscosity, a measure of the resistance of the fluid to flow. Viscosity of the fluid has a significant impact on the pumping costs.
Density, the mass of the fluid per unit volume. The density of the fluid is an important parameter that influences both capital and operating costs through its impact on energy density, hydrostatic pressure in storage tanks, and pumping power needed to circulate the fluid.
As mentioned earlier, the key to increasing efficiency of power conversion is in achieving as high a temperature of the heat transfer fluid as possible. Maximum temperatures possible with any liquid depend on its boiling point or, more accurately, on its thermal stability since many fluids and fluid mixtures start decomposing well below their boiling points. Fluids with high boiling points also tend to have high melting points, which imposes a constraint on the minimum temperature allowed in the system. Lowering of temperature below the melting point of the fluid will cause it to freeze, potentially damaging and causing failures of system components. The entire system needs to be designed to prevent the occurrence of such an event through heat tracing of pipelines, tanks, and other equipment, properly insulating the components, and so on, increasing capital costs.
It should be noted that the thermophysical and transport properties are functions of temperature, and extensive data on a large number of fluids are available in the literature as, for example, in references [10–12]. The discussion presented below mentions typical values for various types of fluids, while focusing primarily on the chemical aspects of these materials.
3.1.2.1 Thermal Oils
Thermal oils used in CSP applications include mineral oils, silicone oils, and synthetic oils [12]. Most of these oils have similar properties, with the specific gravity between 0.85 and 1.1, thermal conductivity around 0.11 W/m K, and specific heat capacity ranging from 1.5 to 2 kJ/kg K. The viscosities show some variation among the materials; however, viscosity of any fluid is highly dependent on temperature, and at the operating temperatures in the CSP plants, the viscosity is sufficiently low so as not to impose a large burden on pumping costs. Mineral oils, such as Xceltherm 600, are typically petroleum-based refined paraffinic oils characterized by low vapor pressure and low toxicity [13]. Most mineral oils typically will start decomposing at temperatures in excess of 400°C, and these low temperatures limit the power conversion efficiency of the CSP. Synthetic oils, with trade names such as Dowtherm HP and Therminol 60, are formulated to increase the thermal stability and can increase the maximum temperature by almost 100°C over what is possible with mineral oils. These synthetic oils may be paraffinic or aromatic, and even higher temperatures are reportedly possible with them. Silicone oils, siloxane-based polymers, Dow Corning 550®, or Syltherm 800 are similarly formulated for raising the maximum operating temperature of CSP systems.
Therminol VP-1, a eutectic of biphenyl (C12H10) and diphenyl oxide (C12H10O), is widely used in CSP systems, allowing a maximum temperature approaching 400°C. However, all organic heat transfer media start degrading at higher temperatures, frequently resulting in formation of sludges in the system. Therminol VP-1 starts oxidizing above 400°C, putting a limit on efficiency of the power conversion system [14].
Thermal oils have been the heat transfer media of choice in PT CSP systems, a combination that is often referred to as the first generation or Generation 1 (Gen 1) of the CSP systems. However, efficiency of the power conversion system is constrained due to the limitations on the maximum temperature possible with these systems. Thermal oils are ill-equipped to handle the higher temperatures possible in the ST systems, necessitating the use of other media, specifically molten salts. CSP systems evolved to the second generation, characterized by ST achieving higher concentration factors and utilizing solar salt as the heat transfer medium.
3.1.2.2 Molten Salts
Inorganic molten salts make excellent heat transfer media while also offering a wide range of operating temperatures due to their high boiling points. High density and specific heat capacity, along with excellent thermal stability and nonvolatility, make the molten salts extremely attractive for use in CSP systems. They are also cheaper than organic media, have lower toxicity, and are nonflammable. Higher density and heat capacity translate into lower inventories, reducing the plant size and the capital costs [14].
The most commonly used molten salt in the CSP systems is the eutectic of sodium nitrate (NaNO3) and potassium nitrate (KNO3). This mixture, in a 60:40 weight ratio of NaNO3 to KNO3, is referred to as the solar salt. The melting point of the solar salt is ~223°C, lower than those of the individual pure components by 75°C–100°C [15]. Nitrate deposits in Chile’s Atacama Desert are the cheapest source of the nitrate salts. However, as can be expected, these nitrate salts are not totally pure, and the impurities present in the salts as well as formation of nitrites from the nitrates can cause significant corrosion of the materials of construction, as shown by the sequence of reactions from R3.1 to R3.3 [16, 17].
The oxide ion generated in scheme R3.1 is highly reactive and can form peroxide and superoxide ions by reactions with nitrate, as shown in reactions R3.4 and R3.5, respectively [18].
The oxide ion is aggressive toward chromium and tends to destabilize the protective oxide film formed over the materials of construction. All oxygen ionic species enter into a variety of reactions with different species present in the system, leading to formation of compounds such as Na2O and KO2. Formation of these oxides is potentially beneficial in reducing the corrosion rate [17]. Nitrate salt decomposition can also lead to formation of various NOx species (NO, N2O, etc.) and also N2 and O2 [16].
The components in the nitrate salt mixture, particularly oxides, can react with carbon dioxide if in contact with the atmosphere, leading to the formation of carbonates, as shown in scheme R3.6. The presence of moisture results in the formation of a hydroxide ion, as shown in scheme R3.7, and the increase in the basicity is further detrimental to the protective oxide layer [18].
Hydrogen evolution is possible in the presence of excess water, which reacts with the nitrite ion, as shown in reaction R3.8.
Hydrogen evolution is also reportedly possible through the reaction R3.9:
Clearly, moisture has a detrimental effect on the solar, and it can be removed from the matrix through extended sparging by an inert gas, such as N2, He, or Ar. However, this is feasible only for laboratory and small-scale activities. For large-scale operations, heat treatment may be the only option to get rid of its undesirable presence.
Similarly, trace elements (Mg, Ca, etc.) and ionic elements (sulfate, chloride, etc.) can react with solar salt and structural components, leading to the formation of Na2Mg(CO3)2, MgFe2O4, K2SO4, KClO4, and so on. These impurities may cause corrosion of components, as well as affect the heat transfer performance of the solar salt. Perchlorate is particularly harmful, as it leads to formation of oxide and chloride ions, both of which attack the materials of construction. Protective oxide layers are typically stable if the chloride concentration is below 100 ppm; however, higher concentrations lead to pitting corrosion and spalling of the oxide layer due to the formation of iron chlorides underneath it [18]. Purification of salt and control of corrosion are two important areas of research and development for improving the performance of solar salt CSP systems.
Solar salt is a binary mixture of sodium and potassium nitrate, having a melting point that is lower than that of individual salts. Introduction of a third component can result in further lowering of the melting point, increasing the ease of handling of the heat transfer fluid. Two such attractive ternary salt combinations are Hitec—NaNO3–KNO3–NaNO2 ternary mixture in a weight ratio 7:53:40—and Hitec XL—NaNO3–KNO3–Ca(NO3)2 ternary in a weight ratio of 7:45:48. The melting point of Hitec is ~80°C lower than that of the solar salt, and Hitec XL melts at a temperature that is a further 20°C lower [12]. Such lower melting temperatures help alleviate concerns related to the potential freezing of the heat transfer fluids. The heat transfer properties of these ternary salts are similar to that of the solar salt. However, these salts also have lower thermal stability, limiting the maximum temperature in the heat transfer systems and lowering the power conversion efficiency.
Nitrate-based salts are superior to thermal oils with respect to heat transfer characteristics and power generation due to operation at higher temperatures. However, the maximum temperatures of these salts range between 500°C and 600°C, and increasing the power conversion efficiency requires heat transfer media that operate at even higher temperatures. Generation 3 of the CSP plants are visualized to utilize chloride salts that are stable up to 800°C, and thus can operate at temperatures that are at least 100°C higher than those in the generation 2 solar salt CSP plants [19]. Chloride salts also offer the advantages of being more abundantly available and cheaper than the nitrate salts. Among the chloride salts, the binary mixture KCl–MgCl2 (62:38 weight ratio) and two ternary mixtures—NaCl–KCl–ZnCl2 (weight ratio 7.5:23.5:69) and NaCl–KCl–MgCl2 (weight ratio 16:41:43)—are considered to be the most attractive. The advantage of ternary salts is that typically the melting point of the eutectic will be much lower than that of the binary mixture. The NaCl–KCl–MgCl2 offers two advantages over the NaCl–KCl–ZnCl2 mixture—it has a lower vapor pressure, which can be significant factor at higher temperatures, and the composition of the ternary is remarkably close to the composition of carnallite, a naturally occurring NaCl–KCl–MgCl2 mixture with a weight ratio of 12.3:38.6:49.1 in the carnallite mined on a large scale in Israel. The moisture content of this anhydrous carnallite is between 0.5% and 1.0%, much lower than other such deposits around the world [20]. The desired composition of the ternary salt can be achieved very nearly by simply blending the carnallite with halite, as shown in Figure 3.5. The different lines in the figure represent liquidus curves, and it can be seen that the desired salt composition lies in close proximity to the minimum liquidus curve, as well as that of carnallite from Israel.

Figure 3.5 Phase diagram for NaCl–KCl–MgCl2 ternary mixture.
Source: Zhao, Y., and J. Vidal, “Potential Scalability of a Cost-Effective Purification Method for MgCl2-Containing Salts for Next-Generation Concentrating Solar Power Technologies,” Solar Energy Materials and Solar Cells, Vol. 215, 2020, p. 110663.
The ternary salt needs to be dehydrated and purified for use as the heat transfer medium. High-temperature dehydration results in the formation of magnesium hydroxychloride (MgOHCl), which can then decompose to form MgO. The corresponding reactions are shown in R3.10 and R3.11, respectively.
The first reaction occurs below 400°C, whereas the second reaction takes place around 550°C. Unfortunately, both the reactions result in the formation of HCl gas, which is highly corrosive in the presence of moisture. Alternately, chemical purification of the salt can be accomplished by reacting the hydroxychloride with Mg metal, as shown in R3.12.
Mg metal also acts to reduce other metal chlorides and protects them from corrosion. Precipitated MgO and other reduced metals can be removed from the salt and the heat transfer fluid circulation loop. However, this chemical purification requires use of Mg metal.
Molten carbonates and fluoride salts are also candidates for use as heat transfer and energy storage media due to higher temperatures possible with these media. Carbonate salts suffer from the disadvantage of high melting points—the relatively low melting point of the eutectic ternary carbonate salt of Li, Na, and K is still 397°C, higher than the maximum operating temperature of many other heat transfer media. Addition of hydroxides to the mix does lower the melting point; however, it also results in lower thermal stability of the mixture [21].
Fluoride salts have been proposed as coolants for advanced nuclear plants, and considerable experience is available in the nuclear energy field, primarily as a result of the U.S. DOE’s molten salt reactor experiment (MSRE) at the Oak Ridge National Laboratory. These salts are typically binary or ternary salts of alkali and alkaline earth metals (FLiNaK—ternary salt of Li, Na, and K; FLiBe—binary salt of Li and Be; etc.). These salts have excellent heat transfer characteristics and thermal stability. However, corrosion is a significant concern, as are the high melting points—454°C for FLiNaK, for example. Material cost is a concern for both carbonate and fluoride salts [21].
3.1.2.3 Liquid Metals
Liquid metals present another option borrowed from the nuclear energy field for use in CSP plants. Liquid metals—Na, Na–K eutectic, Pb–Bi eutectic (lead–bismuth eutectic, or LBE), and so on—are characterized by excellent heat transfer characteristics, low melting points (particularly for eutectics), and high temperature stability. Similar to the fluoride salt application in the MSRE, substantial experience exists in the operation of nuclear reactors using liquid Na as the heat transfer medium. Compatibility of materials of construction is not a significant concern with Na; however, that is certainly an issue with the LBE. On the other hand, LBE is chemically inert and stable upon exposure to air or moisture, whereas Na is highly reactive and any exposure may result in potentially catastrophic consequences. These fluids are attractive as heat transfer media, but not as thermal energy storage materials due to their lower specific heat capacities [12]. In any case, large-scale thermal energy storage is likely to require separating the heat exchange and storage functions, with any CSP heat transfer medium functioning only as an energy carrier to transfer thermal energy from the solar receiver to a storage medium and carrying the stored energy to the power conversion system. The thermal energy storage medium required in large quantities will be an inexpensive material, such as crushed rock or concrete.
The two key factors that determine the usefulness of a fluid as the heat transfer medium in CSP plants are its maximum operating temperature and effectiveness in transferring heat. The second factor can be quantified through the use of the dimensionless Prandtl number (Pr), which combines the basic thermophysical and transport properties mentioned earlier—specific heat capacity (CP), viscosity (m), and thermal conductivity (k), as shown below [22].
Pr number signifies the ratio of the momentum diffusivity to thermal diffusivity. For heat transfer applications, fluids with low Pr are preferred, as lower values of Pr signify high thermal diffusivities, meaning these fluids conduct heat more effectively than those with a high Pr.
Figure 3.6 presents a comparative analysis of various heat transfer fluids discussed earlier. The bars in the figure indicate the maximum operating temperatures, while the points indicate the values of the Pr for the fluids.2
2. Pr depends upon temperature, as thermophysical and transport properties of a fluid are functions of temperature. The Pr values shown in the figure are calculated at approximately the highest operating temperature for the fluid, which is different for each fluid. Property data needed for calculating Pr are obtained from references [12–14, 16, 21, 23, 24].
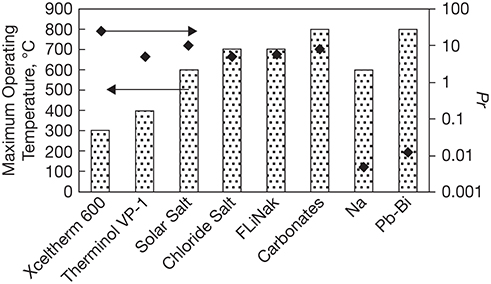
Figure 3.6 Comparison of CSP heat transfer fluids.
It can be seen that the carbonate salts and LBE have higher maximum operating temperatures than other fluids, which would allow the power conversion system to operate at the highest efficiency. It can also be seen that LBE is far superior to the carbonate salts, as indicated by its lower Pr. It should be noted that the Pr numbers are plotted on a log-axis, and the Pr of LBE is nearly three orders of magnitude lower than that of carbonate salts. Liquid Na is even better as a heat transfer fluid; however, its maximum operating temperature is lower than that of the carbonate salts and LBE. FLiNaK and chloride salts have similar Pr and maximum operating temperature. Cost and corrosive nature are issues with both halide salts, with more severe concerns for FLiNaK than the chloride salts. Solar salt has similar Pr but a lower operating temperature. The thermal oils operate at even lower temperatures, while also not being as effective in transferring heat as the other media.
It should be noted that several other factors play a role in the choice of the heat transfer medium in addition to the above two factors. Materials compatibility, purification and processing complexity, and process hazards and safety are equally critical considerations. Above all, the availability and the cost of the material will heavily influence the selection process for the fluid. Figure 3.6 does provide a strong indication that chloride salts are attractive candidates for use in the Gen 3 CSP plants. Heat transfer properties of these and other media can be enhanced through doping with nanoparticles, which is an area of considerable research and development activity not only in the CSP arena but also in the broader heat transfer field.
3.2 Solar PV Systems
PV electricity production started gaining prominence from the 1950s when the U.S. space program started using PV cells to power equipment in its satellites. However, PV cells have a much longer history; the PV effect was first observed in 1839 by Edmund Becquerel, and selenium PV cells were used in photography as early as in the 1880s [25, 26]. PV cells have evolved dramatically since those early days, and it is essential to understand the basic physics behind PV electricity generation.
3.2.1 PV Effect and Fundamental Structure of a PV Cell
The PV effect can be readily understood from the wave–particle duality of the solar radiation—it can be visualized as having both electromagnetic wave and photonic form. Photons, quantized packets of energy, behave as invisible and indivisible particles. The energy content of a photon is directly proportional to its frequency. Photons incident on any surface will either be reflected, transmitted through, or absorbed by the material. The interaction of the photon with the electrons in the material forms the basis of the PV effect. Electrons in certain materials will acquire enough energy in some of these interactions to be ejected from their position. Ejection of an electron creates a vacancy—a hole in the position it previously occupied, generating a voltage—photovoltage in the material. The freed electrons directed through an external circuit create an electric current—the photoelectric current [25]. It can be seen that a PV device generating electricity harnesses solar energy in a fundamentally different mechanism than that of solar thermal devices. In the thermal power systems, absorbed photons do not result in creation of electron vacancies, and hence photovoltage. Instead, the energy transferred by the photons results in increased kinetic (rotational, vibrational, and translational) energy of the material, manifested through higher temperature and/or phase change.
Obviously, not all materials exhibit the PV effect and can be used in PV devices. Even in the materials that possess these properties, not all interactions of photons with electrons result in the ejection of electrons and the creation of an electron–hole pair. The theoretical basis for the phenomena and the quantitative explanation of the photoelectric effect3 was provided by Einstein in 1905, for which he was awarded the Nobel Prize in Physics in 1921.
3. The terms photovoltaic effect and photoelectric effect are sometimes used interchangeably, and sometimes a finer distinction is made between the two. The fundamental process in both involves an interaction of the photon with a material displacing an electron from its position. If the electron is emitted into a vacuum, it is called a photoelectric effect. If the electron stays in the material, then it is termed a photovoltaic effect.
A photon–electron interaction results in the transfer of the entire energy of the photon to the electron. As mentioned earlier, the energy of the photon is dependent on its frequency and the quantitative relationship between the two, as shown in equation 3.5.
where ε is the energy of the photon in J, ν is its frequency in Hz (1/s), and h is the Planck’s constant (6.63 × 10⁻³⁴ J/s). If the transferred energy of the photon exceeds a threshold value—the work function ø for the electron, then it is ejected from its position. Work function is the minimum thermodynamic energy (work) needed to remove an electron from its position in the material to a point in the immediate vicinity of the material surface in a vacuum. Obviously, this energy, that is, ø, varies from material to material; however, it is not a function of properties of the bulk material. Rather, it depends on the surface characteristics, and different crystal surfaces of a material can have different work function values. The work function for silver ranges from 4.26 to 4.74 eV, while that of silicon is between 4.60 and 4.85 eV. The energy in excess of this work function threshold or barrier manifests itself as the kinetic energy of the electron. The potential or voltage created by this phenomenon can be obtained by a simple energy balance for the electron and is shown below in equation 3.6 [1].
where V is the voltage (also called stopping voltage, Vstop), and qe is the charge on the electron (1.602 × 10⁻¹⁹ C).
The response of the material to the solar radiation and the manifestation (or lack thereof) of the PV effect can be understood in terms of the arrangement of electrons in the material. Electrons in an individual atom occupy discrete energy levels according to the quantum-mechanical model of the atomic structure. Electrons in any materials consisting of an unlimited number of atoms are arranged in the discrete energy bands, with the valence band being the highest energy level occupied by the electrons. The next higher energy level, which is unoccupied, is called the conduction band. In electrically conducting materials, such as metals, the valence band and the conduction band overlap. In all other materials, the two bands are separated by an energy gap creating a forbidden zone, which cannot be occupied by an electron. A valence band electron, acquiring energy from the photon, may transition to the conduction band provided that the photon has sufficient energy (a high-frequency photon) and the energy gained is sufficient to overcome the energy gap. The electrons in the conduction band are free electrons that can carry electrical current.
The energy levels are dependent upon temperature, and the energy gap decreases with temperature. Electrical insulators are materials that are characterized by a large energy gap (>3 eV or 4.806 × 10⁻¹⁹ J) between the valence and conduction bands, which cannot be bridged by electrons at any temperature. Semiconductors, on the other hand, have a smaller energy gap that can be overcome by the valence band electrons, and this transition allows them to become electrically conductive. For example, the energy gaps for silicon and gallium arsenide (GaAs) are 1.12 and 1.42 eV, respectively, and these gaps can be overcome by the valence band electrons at high temperatures [26]. The photon–valence band electron interaction for these and such materials is sufficiently energetic for the electron to transition to the conduction band, enabling their use in PV devices.
The transition of the electron from the valence band to the conduction band also results in the creation of a hole in the valence band. Both the electrons in the conduction band and holes in the valence band can move: another electron in the valence band can fill the hole, in the process creating a hole in its former location. The movements of the electrons and holes can be random, and ultimately the electrons in the conduction band can lose their energy, returning back to the valence band. In order to obtain useful current out of the photo-induced excitation of the electron, a potential barrier is required in the PV material to keep the electrons separated from holes and induce them to move into the external circuit. This barrier is typically created by inserting trace quantities (of the order of 0.001%) of another material with a different number of valence electrons in the semiconductor material. For example, Si is doped with P in n-doping to create an excess of electrons. P has one extra electron in its band and functions as a donor atom. Doping with an element with one less electron in its valence band, such as doing Si with B, creates an excess of holes. B is an acceptor atom, and this type of doping is called p-doping [26]. When the two different types of doped materials are joined, a charge barrier is created at their junction. This barrier functions to prevent annihilation of the electron–hole pairs through their recombination. Figure 3.7 illustrates the operating principle of a simple PV cell consisting of an n–junction semiconductor [27].
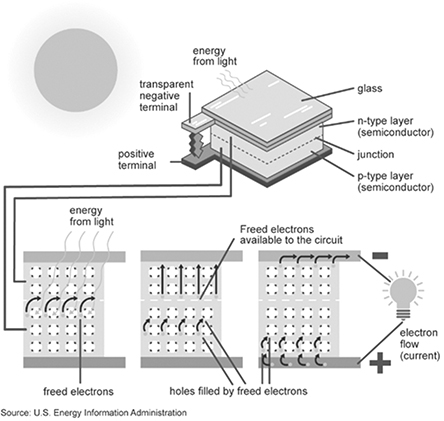
Figure 3.7 Functioning of a PV cell.
Source: https://www.eia.gov/kids/energy-sources/solar/#solar_photovoltaics-basics.
The light incident on the solar cell generates free electrons in the n-doped top emitter portion and holes in the p-doped base portion. The electrons move to the top collector and the holes to the bottom collector, and completing the external circuit allows the current to flow through the system and any load connected in the external circuit.
The basic structure of a PV cell is as shown above. A detailed description of different cell technologies and their evolution is discussed in the following section.
3.2.2 PV Cell Technology
PV cells are either wafer-based or thin-film-based, with the difference being that the thin-film-based PV cells require a substrate on which the film is deposited [28]. Wafer PV cells are predominantly made of crystalline silicon (c-Si), GaAs, or III–V multijunction (MJ) cells consisting of stacks of single junction cells made from group III and group V elements. Thin-film PV cells utilize materials, such as hydrogenated amorphous silicon (a-Si:H or H2-a-Si), cadmium telluride (CdTe), copper indium gallium selenide (CIGS), quantum dots, perovskites, and so on, deposited on glass, plastic, or metal substrates. The attractiveness of thin-film PV cells arises from more efficient light utilization by active materials in these cells than by c-Si and other wafer PV cells, reducing the material requirements. The thickness of active material in the wafer base systems is 100–200 μm, while that of thin films is at least a couple of orders of magnitude lower, in the nanometer to micrometer range [29]. Environmental costs of the thin film cells are estimated to be lower than those of wafer cells based on the life cycle assessment.
The PV cell market is dominated at the current time by wafer-based technologies, the so-called first generation of PV cells that are used in ~90% of PV systems. The evolution in the technology is expressed in terms of generations, similar to the developments in the CSP technologies, with each succeeding generation offering cost and efficiency advantages over the previous generation. Figure 3.8 illustrates the broad generation classification and the relative performance/cost metrics of PV cells in these generations [28].

Figure 3.8 Generational classification of PV cells.
Source: Jean, J., P. R. Brown, R. L. Jaffe, T. Buonassisi, and V. Bulovi, “Pathways for Solar Photovoltaics,” Energy & Environmental Science, Vol. 8, 2015, pp. 1200–1219.
It can be seen that PV technology is a dynamic field, with the technological advances increasing the efficiency and reducing the cost for all cells. Thus, all PV cells trend toward the upper-left-hand corner.
Further evolution in PV technology has seen the emergence of the so-called fourth generation of PV cells that comprise organic–inorganic hybrids, with Figure 3.9 showing the latest classification generation scheme [30].
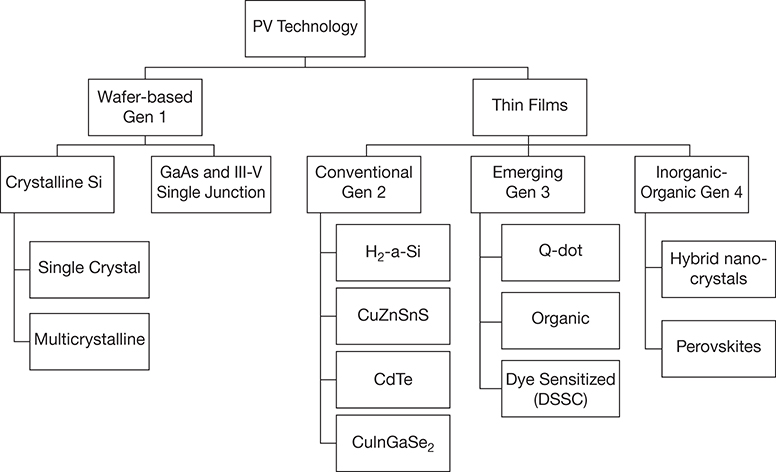
Figure 3.9 Classification of PV technology.
Source: Modified from Olaleru, S. A., J. K. Kirui, D. Wamwangi, and K. T. Roro, “Perovskite Solar Cells: The New Epoch in Photovoltaics,” Solar Energy, Vol. 196, 2020, pp. 295–309.
3.2.2.1 Efficiency of PV Cells
The performance of a PV cell can be measured by its power conversion efficiency, which can be readily defined in terms of the cell’s electrical output to solar irradiance received [31].
The typical characteristic voltage–current curve for any PV cell is as shown in Figure 3.10 [32]. The maximum voltage is the open circuit voltage VOC, when the output current is 0. At the other end of the curve is the maximum current, ISC, the short circuit current. It can be seen that the current decreases as the voltage increases, gradually at first and later precipitously. The operating point of the PV cell lies on this curve, and the power output of the cell at this point is simply the area under the curve from the origin. Also shown in the curve is the operating point (Vmpp, Impp) at which maximum power is obtained. The power conversion efficiency is defined at this point.

Figure 3.10 Typical operational curve for a PV cell.
Source: Hernández-Callejo, L., S. Gallardo-Saavedra, and V. Alphonso-Gómez, “A Review of Photovoltaic Systems: Design, Operation, and Maintenance,” Solar Energy, Vol. 188, 2019, pp. 426–440.
Figure 3.11 shows the typical power conversion efficiencies and open circuit voltages for various types of PV cells.4
4. Based on the data from references [30, 31, 33].
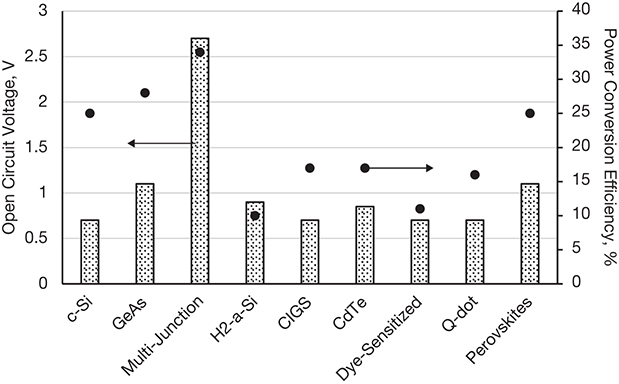
Figure 3.11 Voltage and power conversion efficiency of PV cells.
It can be seen that the open circuit voltages of most of the cells range between 0.7 and 1.2 V. The power conversion efficiency of c-Si–based Gen 1 PV cells is actually greater than many of the Gen 2 and Gen 3 thin-film cells. This certainly raises questions about the desirability of, and motivation for, moving to later generations of photovoltaics. The answer to these questions lies in the fact that the open circuit voltage and the maximum power efficiency are just two of the many factors that play a role in the economic viability of the PV system. The amount of material used in the Gen 2–4 PV cells is significantly lower than that of the Gen 1 systems, as can be deduced from the orders of magnitude differences in the active material thickness. Besides material costs, substantial savings may also be realized in the processing and formulation of PV cells. Normalizing the power generated or conversion efficiency with respect to the amount of material may lead to a better metric for evaluation of competing PV technologies. The life cycle costs, ease of operation, and maintenance requirements are a few of the other factors that play a role in the selection of PV technology. It should also be understood that PV technology is under a continuous state of development, leading to PV cells with superior performance characteristics.
3.2.2.2 Materials for PV Cells
It can be seen that a variety of materials are used in PV technology. These materials are discussed in the context of the generational evolution of PV cells.
The c-Si is the mainstay of Gen 1 systems, which dominate the PV landscape, and its importance cannot be overstated. Initial PV cells used monocrystalline silicon harvested from a single crystal ingot grown using the Czochralski (CZ) method [34]. Reduction of production costs and increasing throughput led to the development of multi- or poly-crystalline silicon, which offers additional advantages of fewer defects. Crystalline silicon is the single most important PV material that is produced in large quantities. Other Gen 1 PV cells use group III and group V elements, such as Ga and As, in single or MJ cells. Other possible group III elements used in the cells include Al and In, while N, P, and Sb from group V are also used in III–V MJ cells [28].
Gen 2 PV cells are made of either amorphous silicon (a-Si) or metallic compounds. The difference between c-Si and a-Si is in the random orientation of Si atoms in a-Si. This random orientation results in many unsaturated bonds in the structure that are passivated using hydrogen [35]. The metallic compounds feature a combination of a single or multiple transition metals with a group VII element (S, Se, and Te). The compound may also include group III elements as in CIGS. These films can be manufactured by chemical vapor deposition (CVD) techniques or deposition from solutions through spray painting or spin coating [28].
Gen 3 PV cells represent an emerging thin-film technology. Organic PV cells are based on using organic polymers and other molecules such as pentacene, polyphenylene vinylene, copper phthalocyanine and perylene tetracarboxylic derivatives, and carbon fullerenes [28, 34, 35]. The attractiveness of organic PV cells stems from the use of abundant materials that can readily be processed using established practices in the organic chemical industry. High throughput is possible, and processing conditions are not as severe for Gen 1 and Gen 2 materials. Dye-sensitized solar cells (DSSCs) utilize light-sensitive organic dyes to generate the electrons. The dyes may be metal organic complexes (e.g., Ru complexes), natural dyes (carotenoids, flavonoids, chlorophylls, etc.), porphyrin-based dyes, or other organic dyes, typically anchored to a transparent titania scaffold anode. DSSCs may use a liquid electrolyte, which may be an aqueous solution containing a triiodide/iodide couple or organic, such as acetonitrile, or ionic liquids [36]. Quantum dot solar cells utilize nanocrystals, usually of PbS, deposited from solutions or colloidal suspensions. The processing takes place at room temperature, and the ability to tune the cell to harvest photons of different wavelengths makes them extremely attractive.
Hybrid organic–inorganic solar cells also involve low-temperature, solution-based processing. Manipulating structures can allow tuning of the cells. The cells typically involve inorganic oxide combined with organic polymers such as a ZnO-polythiophene hybrid [37]. The second type of organic–inorganic hybrid solar cells involves perovskite-based compounds. The term “perovskite” refers to calcium titanate (CaTiO3), and a general formula for a perovskite-type compound can be written as ABX3, where A and B are cations and X is the anion. The cation A in the perovskite solar cells (PSCs) is a monovalent metallic or organic ion, such as Rb+, Cs+, and CH3NH2+, and B is a divalent cation, such as Pb2+ or Sn2+. The anion is a halide—chloride, bromide, or iodide [30]. A thin film of perovskite-type compound can be deposited on a substrate in a variety of ways, including spin coating, deposition from solution, and vapor deposition. The key challenge for perovskite-type compound-based solar cells is the stability of the compound and increasing the power conversion efficiency.
3.2.3 Chemistry and Processing of PV Cell Materials
The basic structure of any solar cell is as shown in Figure 3.7. It features a junction of n- and p-doped photosensitive semiconductor material at its heart. The cell is typically asymmetric, with the p-doped portion being considerably thicker than the n-doped one. As an example, the thickness of the p-doped semiconductor in the CdTe thin-film PV cell may be on the order of 5 μm, while that of the n-doped material may only be 100 nm, that is, nearly two orders of magnitude lower [38]. The semiconductor material is generally encased in a protective sheath with conducting metal oxides providing electrical contact for collection of electrons and holes. Typically, the thinner, n-doped material is exposed to the sunlight, as in Figure 3.7, and hence the conducting oxide coating is transparent and made of oxides of metals, such as Zn, Sn, In, and so on [39]. Glass forms the topmost layer of the assembly, providing insulation to prevent any unintentional electrical contact with the current collector while allowing sunlight to pass through.
There are practically an infinite number of configurations of solar cells, with myriad combinations of photosensitive materials, current collectors, and protective coatings. Furthermore, the cells come in all shapes, sizes, and geometries. Discussion of cell assembly as specific processes for synthesizing various materials is a vast area that is beyond the scope of this book, particularly in light of the continual evolution of PV cells and pathways/techniques for their formulation. The discussion in this book focuses on two aspects of the chemical processes associated with the production of PV cells: first, the production of PV-grade silicon that is used in the majority of PV cells, and second, the CVD process that is used in most of the thin-film PV cells.
3.2.3.1 PV-Grade Silicon
Silicon is second only to oxygen in terms of its abundance on earth. However, almost all of it exists as silica in various forms. Quartz sand is the source for all silicon that is produced for various industrial applications. The first step in the production of PV silicon is the reduction of silica to obtain metallurgical-grade silicon according the reaction R3.13.
The reduction is conducted in an electric arc furnace using coal at temperatures of ~1800°C, yielding silicon having a purity in excess of 98% [40]. Use of high-quality silica and charcoal can result in significantly higher purity, as practiced in Brazil, where a purity in excess of 99% is obtained [41]. Metallurgical-grade silicon is used in aluminum, steel, and chemical industries and accounts for nearly 95% of applications of silicon. However, metallurgical-grade purity is not sufficient, even for highly pure Brazilian silicon, to qualify it for use in solar cells. Solar-grade silicon is required to have at least 99.999% purity (5 nines or 5N5); the purification is achieved by a chemical route by reacting the metallurgical-grade Si with HCl to form trichlorosilane (R3.14), which decomposes to yield high-purity silicon (R3.15). Trichlorosilane is purified with repeated distillation cycles before being fed into a decomposition reactor.
5. Semiconductor-grade silicon has even more stringent purity requirements at 9N.
The reaction is conducted at high temperature (1000°C–1350°C) with silicon being deposited on an inverted U-tube in a CVD reactor. The process is called the Siemens process, and the reactor is called the Siemens reactor.
The Siemens process suffers from high-energy requirements and formation of highly volatile, toxic, and corrosive chlorinated compounds, which also present an explosion hazard. These compounds need to be recycled in a closed loop to increase recovery of silicon, as well as avert pollution. This is accomplished via one of the two pathways: a low-pressure (1–5 bar), low-temperature (300°C –350°C) multistep process or a high-pressure (20–35 bar) single-step process, which operates at a higher temperature of ~550°C [42]. Both processes are similarly competitive.
An alternative to the Siemens process involves converting the trichlorosilane to silane, as shown by the sequence R3.16–R3.17, followed by its decomposition (R3.18).
The first two reactions are catalyzed by quaternary ammonium ion exchange resins and are conducted in a fixed bed reactor. The decomposition of silane may take place in an inverted filament, as in the Siemens reactor, or in a fluidized bed reactor (FBR), as introduced by Wacker Chemie AG [41, 42]. Product silicon is harvested in the rod form (up to 0.15 m diameter × 2.5 m length) in the Siemens reactor and in a granular form (diameter ranging from 0.5 to 2 mm) from the FBR. Figure 3.12 shows the schematics of both these reactors [42].
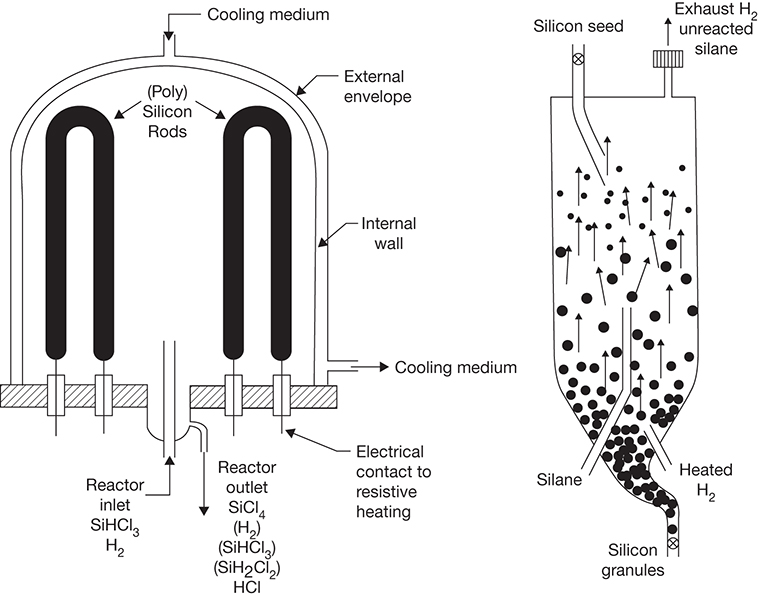
Figure 3.12 Polysilicon production reactors: Siemens (left) and fluidized bed (right).
Source: Bye, G., and B. Ceccaroli, “Solar Grade Silicon: Technology Status and Industrial Trends,” Solar Energy Materials and Solar Cells, Vol. 130, 2014, pp. 634–646.
The FBR can be operated continuously, with silane gas fed at the bottom along with hydrogen. Silicon granules grow in size, with silicon generated from the decomposition of silane coating the silicon seed continuously added from the top. The typical grain size of a seed is <300 μm. A quantitative yield of silicon can be obtained with hydrogen being the only other product formed in the process.
Other chemical variations of the silane-based process involve different reaction schemes for generating silane through fluorination or reaction with a metal, such as Mg. The complicated chemical route is altogether avoided in the metallurgical route wherein metallurgical-grade silicon is melted in liquid aluminum at 800°C. Crystals of silicon are formed upon cooling, and the silicon formed via this route is referred to as upgraded metallurgical-grade silicon (UMG-Si) [40]. Other variations of the metallurgical process include starting with high-purity raw materials and affecting carbothermic reduction to minimize the impurity levels.
The purity of silicon obtained by the Siemens process is substantially higher than that obtained through silane decomposition in an FBR. Total metallic impurities in the Siemens silicon are typically <50 ppb by weight, whereas those in the FBR and UMG-Si may be as high as 1000 ppb by weight [42]. Nonmetallic impurities, such as C and O, are also at least an order of magnitude lower in the Siemens silicon.
Polysilicon obtained from the above processes is still not pure enough to be used in solar cells and needs to be purified into monocrystalline or multicrystalline silicon. Traditionally, monocrystalline ingots are obtained by the CZ process, wherein the polysilicon is melted in a crucible at high temperature (1450°C), then a metal rod containing a seed crystal is dipped into the melt and withdrawn slowly while rotating. Molten silicon adhering to the rod is slowly crystallized into monocrystalline silicon. Rods of diameter ranging from 20 to 30 cm, length 2 m, and weight of ~150 kg are formed in the process. Impurities are preferentially left behind in the melt [43]. The float zone (FZ) process operates under similar principles, with zone melting of the silicon rod concentrating impurities in the melt, while solids gain in the purity. The impurities are concentrated at one end of the rod, which is then cut off leaving high-purity silicon suitable for solar cells. Multicrystalline silicon is prepared by direct solidification (DS) in a graphite crucible. Polysilicon pieces are loaded into the crucible and melted, following which the entire mass is cooled slowly from the bottom up. A large ingot weighing in excess of 600 kg can be obtained by this process. As the impurities concentrate in the molten liquid, and the top portion is the last one to be solidified, it has the least purity. The core material of the ingot is of the highest purity, as the material in contact with the crucible wall may have some contamination from it [43]. The crucible mass is cut into smaller cube-shaped ingots having a length between 5 and 6 inches. Figure 3.13 shows the schematic of the CZ and DS processes [43].
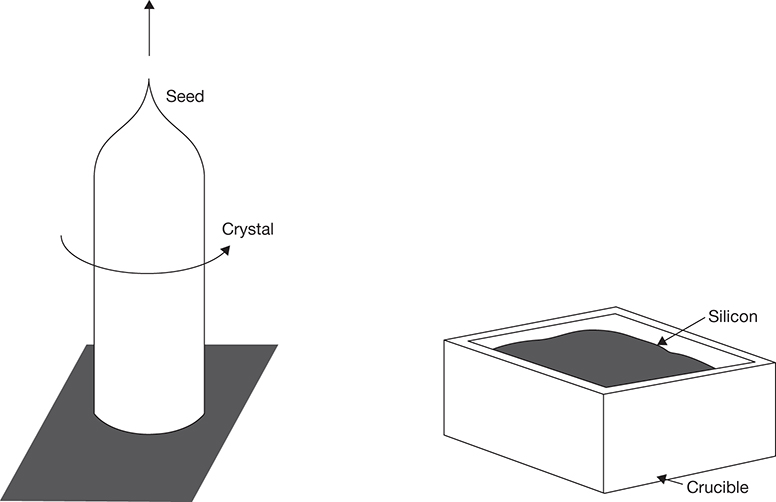
Figure 3.13 Polysilicon conversion to monocrystalline and multicrystalline silicon: CZ process (left) and DS process (right).
Source: Green, M. A., “Silicon Solar Cells: State of the Art,” Philosophical Transactions of the Royal Society A, Vol. A371, 2013, p. 20110413.
These ingots are first sliced into thin wafers of 120–160 μm thickness for further processing.
3.2.3.2 Amorphous Silicon and Gen 2 Thin Films
Although Gen 1 solar cells use c-Si, some of the Gen 2 thin-film solar cells are based on amorphous silicon. Amorphous silicon thin films are synthesized most commonly through plasma-enhanced chemical vapor deposition (PECVD). Silane (SiH4) is used as the precursor for this silicon. The deposited silicon has a higher irregular structure with a large number of unsaturated bonds, termed dangling bonds. These dangling bonds need to be passivated for the a-Si film to be used in solar cells, and this is accomplished by feeding H2 gas along with silane to the PECVD process [44]. The silane–H2 gas mixture is fed into a processing chamber operating at ~200°C under a high-frequency electric field. The high-frequency field ionizes the gases into a plasma. The highly reactive ions deposit on a substrate, forming a film that continues to grow with the continuous flow of the two feed gases. Plasma serves to lower the temperature over the normal CVD process, which requires temperatures in excess of 450°C [39]. The deposition is continued until the required thickness (~500 nm) of the film is attained. Figure 3.14 shows a schematic of the PECVD process [44].
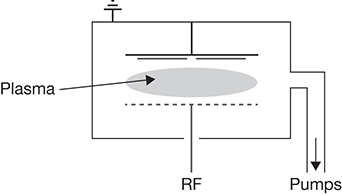
Figure 3.14 Plasma-enhanced chemical vapor deposition process for H2-a-Si.
Source: Stuckelberger, M., R. Biron, N. Wyrsch, F.-J. Haug, and C. Ballifa, “Review: Progress in Solar Cells from Hydrogenated Amorphous Silicon,” Renewable and Sustainable Energy Reviews, Vol. 76, 2017, pp. 1497–1523.
CVD is the most dominant technique for synthesizing thin-film solar cells. CVD is essentially a type of multiphase reaction where the reactants or precursors are in gas phase and one of the products is a solid under reaction conditions. The process involves volatilizing precursors in an evaporator or heated vessel and feeding the vapors into the CVD reactor. The solid product gets deposited on a substrate and the product gas mixture is removed from the reactor, typically using a vacuum. The process is semi-batch: the precursor/reactant feed and product gas withdrawal are continuous, while the thin film grows in the batch mode. The reaction is allowed to proceed until the desired thickness of the deposited film is achieved [45]. The main deposition reaction takes place first at the surface of the substrate on which the film is being deposited, and then as the film growth takes place, at the active sites on the surface of the film. This being a heterogeneous, multiphase reaction, mass transfer has an important role to play in the process. The reactants/precursor diffuse through the boundary layer formed on the surface and are adsorbed on it. There may be a surface diffusion of the precursors to the active/nucleation sites where the reaction takes place and the solid product is deposited. Any by-products formed are desorbed from the surface and diffuse through the boundary layer to the bulk gas phase, from where they are carried out of the reactor. The conceptual schematic of the process is shown in Figure 3.15 [45].
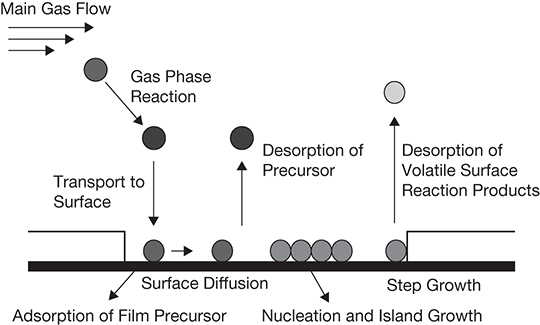
Figure 3.15 Conceptual schematic of a CVD process.
Source: Ritch, J. S., T. Chivers, M. Afzaalb, and P. O’Brien, “The Single Molecular Precursor Approach to Metal Telluride Thin Films: Imino-bis(diisopropylphosphine Tellurides) as Examples,” Chemical Society Reviews, Vol. 36, 2007, pp. 1622–1631.
CVD processes are categorized on the basis of the pressure used in the process into atmospheric pressure (APCVD), low pressure (LPCVD), and ultrahigh vacuum (UHVCVD) processes. The pressure in UHVCVD may be as low as 10−6 Pa. Depending on the nature of the precursor/reactants, the process may also be called MOCVD (metal organic CVD), DLICVD (direct liquid injection CVD), or AACVD (aerosol-assisted CVD), and so on [46]. Actual reagents/precursors used and operating conditions of the CVD process depend upon the material used in the solar cell.
CVD is often used in the formulation of thin-film solar cells. Various other techniques are also used, as stated earlier in the chapter. Some of the solar cells can also be deposited via thermal or physical vapor deposition (PVD), where the compound is simply volatilized and deposited on the substrate, without any chemical reaction [40].
3.2.3.3 Perovskites
As mentioned earlier, the term “perovskite” referred originally to the mineral calcium titanate (CaTiO3) but has more generally come to mean a compound that can be represented by the molecular formula ABX3 having a perovskite-type octahedral-layered structure [47, 48]. The A and B in the above formula represent two cations: A being larger than B, and X is an anion. This structure confers unique optical, electronic, thermal, and electromagnetic properties to perovskites, making them potentially valuable in many industrial applications including catalysis, membrane separations, and most importantly from the perspective of renewable energy, PV electricity generation.
The components present in the PSCs are typically as follows [49]:
A: Alkali ions, such as Cs+ or Rb+; complex organic cations, such as methyl ammonium (MA—); formamidinium (FA—); or a combination of these cations
B: A divalent cation, such as Pb/Sn/Ge, or their combination
X: A halide (Cl-, Br-, I-) or a combination of these halides
The perovskite in a PSC is sandwiched between a hole transport layer (HTL) and an electron transport layer (ETL). A transparent conductive oxide (TCO) layer functions as one of the electrodes (cathode), while the other electrode (anode) is metallic, consisting of Ag/Cu/Au. The entire assembly is supported on a substrate, as shown in Figure 3.16. The configuration on the left is a conventional configuration wherein the ETL is deposited on the TCO, while in the inverted configuration, the HTL is in contact with the TCO [29].
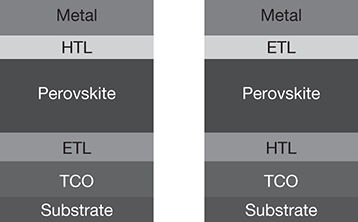
Figure 3.16 Perovskite solar cell configurations.
Source: Ansari, M. I. H., A. Qurashi, and M. K. Nazeeruddin, “Frontiers, Opportunities, and Challenges in Perovskite Solar Cells: A Critical Review,” Journal of Photochemistry and Photobiology C: Photochemistry Reviews, Vol. 35, 2018, pp. 1–24.
Typically, glass and plastic have been used as substrates for the PSCs. Both these materials are abundantly available and amenable to easy processing. However, glass is brittle and has high thermal conductivity, while plastic materials pose end-of-life disposal/recycle problems. Recent developments have included the use of optically transparent wood as the substrate for the PSCs. Wood has low thermal conductivity and low density, while also possessing much better load-bearing characteristics. Furthermore, the recyclability/renewability characteristics of wood make it a superior sustainable material for use as a substrate [50].
PSC formulation is accomplished through either solution processing (spin coating, chemical bath deposition), vapor processing, or hybrid vapor-solution processing [29, 47]. Solution processing is a low-cost option wherein the precursors of perovskites (e.g., CH3NH3I and PbI2 solutions for MAPbI3 perovskite) are spread on the surface usually through spin coating. The solvent used is typically dimethylformamide (DMF), dimethyl sulfoxide (DMSO), or gamma-butyrolactone (GBL). The deposition can be a single-step process, where a mixture of the solutions of both cations (A and B) is spread on the support, or it can be a two-step process involving deposition of cation B followed by the deposition of A. Alternatives to the spin coating technique, which can result in a heterogeneous film and is effective for a small area (100 mm × 100 mm), include blade coating, spray coating, screen printing, and so on. Perovskite films can also be deposited on the support via chemical bath deposition or dip coating.
The vapor deposition technique involves simultaneous evaporation of the precursor solutions, generally from separate vessels maintained at distinct temperatures, as necessitated by different boiling temperatures of the two solutions and exposing the substrate to these vapors in an evacuated chamber. This technique results in a highly uniform film without defects; however, the high vacuum requirements (~10−5 mbar) make scale-up challenging. Furthermore, temperature requirements for the evaporation of the solution of cation B are much higher than those of solution of cation A, and the hybrid vapor-solution process circumvents the challenge by first effecting solution deposition of cation B, followed by vapor deposition of cation A. The different methods used for deposition of the perovskite films are shown in Figure 3.17.
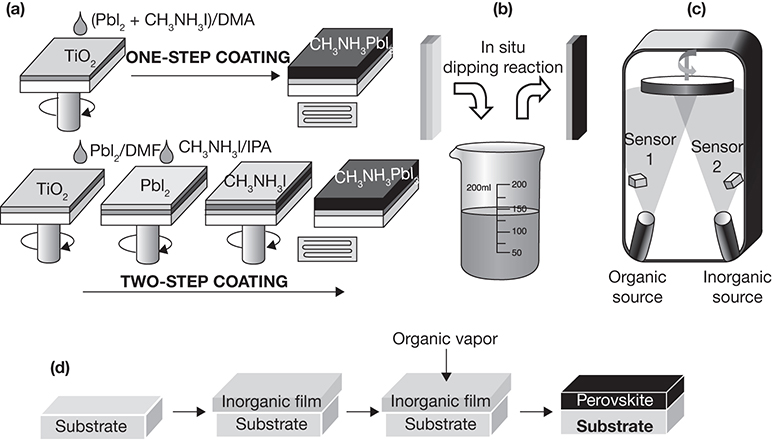
Figure 3.17 Deposition of perovskite films: (a) solution spin-coating, (b) dip-coating, (c) vapor-deposition, and (d) hybrid vapor-solution deposition.
Source: Ansari, M. I. H., A. Qurashi, and M. K. Nazeeruddin, “Frontiers, Opportunities, and Challenges in Perovskite Solar Cells: A Critical Review,” Journal of Photochemistry and Photobiology C: Photochemistry Reviews, Vol. 35, 2018, pp. 1–24.
Solar thermal and PV systems function in distinct ways to harness the sun’s energy. The devices used to capture and transform solar energy are different in the two technologies. Hybrid PV/thermal (PV/T) systems aim to accomplish solar energy transformation to provide heat and electricity in a single device. Besides having a higher energy of conversion, such a device will also have a more efficient space utilization by eliminating the need to have two distinct systems. PV/T systems can operate in nonconcentrating as well as concentrating mode. In nonconcentrating mode, the solar collector is a flat-plate type where no concentration of radiation occurs. Thermal energy harvested in such devices can be used for low-temperature applications, such as space heating, water heating, desalination, and so on [51]. Concentrator type PV/T (CPV/T) systems are extremely attractive, as relatively cheaper materials can be used, a smaller area is needed due to concentration of the sunlight, and even higher power output is possible. However, the system will have added complexity, higher capital costs are needed, and reliability/robustness of the system is yet to be determined. However, PV/T is an attractive area of research for improving the efficiency of utilization of solar energy.
3.3 Summary
CSP plants harvest solar energy through conversion to thermal energy. CSP plants use a number of different media for transferring heat to the power conversion system, as well as for energy storage. Developments in CSP systems indicate an effort to achieve higher temperatures through increasing concentration factors, using heat transfer media with better heat transfer characteristics and thermal stability at these temperatures, and employing less expensive thermal energy storage media. The evolution of the heat transfer media through the different generations of CSP plants, their chemical nature, and the processing steps for obtaining them are presented.
The PV effect provides the functional basis for the operation of the PV systems. Conversion of solar energy to electricity does not involve an intermediate mechanical energy conversion step. Materials used for PV cells are discussed in the context of the generational evolution of PV technology. Processing techniques for the production of solar-grade silicon, the dominant material in photovoltaics, are presented. Principles of CVD, a processing technique used for the production of thin-film solar cells, are presented.
Hybrid PV/thermal (PV/T) systems hold much promise for cogeneration—transforming solar energy into both electricity and heat—however, as of now they are only in developmental stages.
References
1. Chen, C. J., Physics of Solar Energy, Chapter 11, John Wiley, New York, NY, 2011.
2. Raboaca, M. S., et al., “Concentrating Solar Power Technologies,” Energies, Vol. 29, 2019, #1048 (17 pages).
3. Khan, J., and M. H. Arsalan, “Solar Power Technologies for Sustainable Electricity Generation –A Review,” Renewable and Sustainable Energy Reviews, Vol. 55, 2016, pp. 414–25.
4. International Energy Agency, Technology Roadmap: Solar Thermal Electricity, 2014 Edition, International Energy Agency, Paris, France, https://webstore.iea.org/download/direct/422, accessed August 22, 2020.
5. Kasaeian, A., et al., “Solar-Driven Polygeneration Systems: Recent Progress and Outlook,” Applied Energy, Vol. 264, 2020, #114764 (32 pages).
6. Bushra, N., and T. Hartmann, “A Review of State-of-the-Art Reflective Two-Stage Solar Concentrators: Technology Categorization and Research Trends,” Renewable and Sustainable Energy Reviews, Vol. 114, 2019, #109307 (15 pages).
7. U.S. Department of Energy, “2014: The Year of Concentrating Solar Power,” Report #DOE/EE-1101, 2014.
8. Evangelisti, L., R. De Lieto Vollaro, and F. Asdrubali, “Latest Advances on Solar Thermal Collectors: A Comprehensive Review,” Renewable and Sustainable Energy Reviews, Vol. 114, 2019, #109318 (20 pages).
9. Pelayo, U., et al., “Thermal Energy Storage Systems for Concentrated Solar Power Plants,” Renewable and Sustainable Energy Reviews, Vol. 79, 2017, pp. 82–100.
10. Srivastava, U., R. K. Malhotra, and S. C. Kaushik, “Review of Heat Transport Properties of Solar Heat Transfer Fluids,” Journal of Thermal Analysis and Calorimetry, Vol. 130, 2017, pp. 605–621.
11. Benoit, H., et al., “Review of Heat Transfer Fluids in Tube-Receivers used in Concentrating Solar Thermal Systems: Properties and Heat Transfer Coefficients,” Renewable and Sustainable Energy Reviews, Vol. 55, 2016, pp. 298–315.
12. Vignarooban, K., et al., “Heat Transfer Fluids for Concentrating Solar Power Systems–A Review,” Applied Energy, Vol. 146, 2015, pp. 383–396.
13. Srivastava, U., et al., “Analytical Assessment of a Concentrated Solar Sub-Critical Thermal Power Plant Using Low Temperature Heat Transfer Fluid,” Energy & Environment, Vol. 0(0), 2020, pp. 1–19. https://doi.org/10.1177/0958305X20921593.
14. Krishna, Y., et al., “State-of-the-Art Heat Transfer Fluids for Parabolic Trough Collector,” International Journal of Heat and Mass Transfer, Vol. 152, 2020, #119541 (34 pages).
15. Nunes, V. M. B., et al., “Molten Salts as Engineering Fluids–A Review: Part I. Molten Alkali Nitrates,” Applied Energy, Vol. 183, 2016, pp. 603–611.
16. Sötz, V. A., A. Bonk, and T. Bauer, “With a View to Elevated Operating Temperatures in Thermal Energy Storage–Reaction Chemistry of Solar Salt up to 630°C,” Solar Energy Materials and Solar Cells, Vol. 212, 2020, #110577 (9 pages).
17. Fernández, A. G., H. Galleguillos, and F. J. Pérez, “Thermal Influence in Corrosion Properties of Chilean Solar Nitrates,” Solar Energy, Vol. 109, 2014, pp. 125–134.
18. Zhang, H., et al., “Preparation and Thermal Properties of High-Purified Molten Nitrate Salt Materials with Heat Transfer and Storage,” High Temperature Materials and Processes, 2015, Vol. 34, No. 8, 2015, pp. 839–846.
19. Fernández, A. G., and L. F. Cabeza, “Corrosion Evaluation of Eutectic Chloride Molten Salt for New Generation of CSP Plants. Part 1: Thermal Treatment Assessment,” Journal of Energy Storage, Vol. 27, 2020, #101125 (7 pages).
20. Zhao, Y., and J. Vidal, “Potential Scalability of a Cost-Effective Purification Method for MgCl2-Containing Salts for Next-Generation Concentrating Solar Power Technologies,” Solar Energy Materials and Solar Cells, Vol. 215, 2020, #110663 (11 pages).
21. Mohan, G., M. B. Venkatraman, and J. Coventry, “Sensible Energy Storage Options for Concentrating Solar Power Plants Operating Above 600°C,” Renewable and Sustainable Energy Reviews, Vol. 107, 2019, pp. 319–337.
22. Welty, J. R., et al., Fundamentals of Momentum, Heat, and Mass Transfer, 5th Edition, Chapter 19, John Wiley, New York, 2008.
23. Sabharwall, P., et al., “Engineering Database of Liquid Salt Thermophysical and Thermochemical Properties,” Idaho National Laboratory (INL) Report, INL/EXT-10-18297, 2010.
24. Kandhasamy, S., et al., “Thermal Conductivity of Molten Carbonates with Dispersed Solid Oxide from Differential Scanning Calorimetry,” Materials, Vol. 12, 2019, #1486 (8 pages).
25. Solar Energy Research Institute, “Basic Photovoltaic Principles and Methods,” Solar Information Module 6213, SERI/SP-290-1448, National Technical Information Service (NTIS), U.S. Department of Commerce, Washington, DC, 1982.
26. Mertens, K., Photovoltaics: Fundamentals, Technology and Practice, Chapter 1, John Wiley, New York, 2014.
27. U.S. Energy Information Administration, “Renewable Solar.” https://www.eia.gov/kids/energy-sources/solar/#solar_photovoltaics-basics, accessed August 29, 2020.
28. Jean, J., et al., “Pathways for Solar Photovoltaics,” Energy & Environmental Science, Vol. 8, 2015, pp. 1200–1219.
29. Ansari, M. I. H., A. Qurashi, and M. K. Nazeeruddin, “Frontiers, Opportunities, and Challenges in Perovskite Solar Cells: A Critical Review,” Journal of Photochemistry and Photobiology C: Photochemistry Reviews, Vol. 35, 2018, pp. 1–24.
30. Olaleru, S. A., et al., “Perovskite Solar Cells: The New Epoch in Photovoltaics,” Solar Energy, Vol. 196, 2020, pp. 295–309.
31. Hayat, M. B., et al., “Solar Energy–A Look into Power Generation, Challenges, and a Solar-Powered Future,” International Journal of Energy Research, Vol. 43, 2019, pp. 1049–1067.
32. Hernández-Callejo, L., S. Gallardo-Saavedra, and V. Alphonso-Gómez, “A Review of Photovoltaic Systems: Design, Operation, and Maintenance,” Solar Energy, Vol. 188, 2019, pp. 426–440.
33. Kirchatz, T., “High Open Circuit Voltages in Lead-Halide Perovskite Solar Cells: Experiment, Theory, and Open Questions,” Philosophical Transactions of the Royal Society A, Vol. A377, 2019, #20180286 (17 pages).
34. El Chaar, L., L. A. Lamont, and N. El Zein, “Review of Photovoltaic Technologies,” Renewable and Sustainable Energy Reviews, Vol. 15, 2011, pp. 2165–2175.
35. Shubbak, M. M., “Advances in Solar Photovoltaics: Technology Review and Patent Trends,” Renewable and Sustainable Energy Reviews, Vol. 115, 2019, #109383 (19 pages).
36. Calbo, J., “Dye-Sensitized Solar Cells: Past, Present and Future,” Photoenergy and Thin Film Materials, edited by X.-Y. Yang, Chapter 2, John Wiley, Hoboken, New Jersey, 2019.
37. Hsu, J. W. P., and M. T. Lloyd, “Organic/Inorganic Hybrids for Solar Energy Generation,” MRS Bulletin, Vol. 35, 2011, pp. 422–428.
38. Chen, C. J., Physics of Solar Energy, Chapter 9, John Wiley, New York, 2011.
39. Chopra, K. L., P. D. Paulson, and V. Dutta, “Thin-Film Solar Cells: An Overview,” Progress in Photovoltaics: Research and Applications, Vol. 12, 2004, pp. 69–92.
40. Mertens, K., Photovoltaics: Fundamentals, Technology and Practice, Chapter 5, John Wiley, New York, 2014.
41. Braga, A. F. B., et al., “New Processes for the Production of Solar-Grade Polycrystalline Silicon: A Review,” Solar Energy Materials and Solar Cells, Vol. 92, 2008, pp. 418–424.
42. Bye, G., and B. Ceccaroli, “Solar Grade Silicon: Technology Status and Industrial Trends,” Solar Energy Materials and Solar Cells, Vol. 130, 2014, pp. 634–646.
43. Green, M. A., “Silicon Solar Cells: State of the Art,” Philosophical Transactions of the Royal Society A, Vol. A371, 2013, #20110413.
44. Stuckelberger, M., et al., “Review: Progress in Solar Cells from Hydrogenated Amorphous Silicon,” Renewable and Sustainable Energy Reviews, Vol. 76, 2017, pp. 1497–1523.
45. Ritch, J. S., et al., “The Single Molecular Precursor Approach to Metal Telluride Thin Films: Imino-bis(diisopropylphosphine Tellurides) as Examples,” Chemical Society Reviews, Vol. 36, 2007, pp. 1622–1631.
46. Liu, X., et al., “A Review of Perovskite Photovoltaic Materials’ Synthesis and Applications via Chemical Vapor Deposition Method,” Materials, Vol. 12, 2019, #3304 (17 pages).
47. Ijaz, M., et al., “Perovskite Solar Cells: Importance, Challenges, and Plasmonic Enhancement,” International Journal of Green Energy, Vol. 17, No. 15, 2020, pp. 1022–1035.
48. Snaith, H. J., “Pervoskites: The Emergence of a New Era for a Low-Cost, High-Efficiency Solar Cells,” Journal of Physical Chemistry Letters, Vol. 4, No. 21, 2013, pp. 3623–3630.
49. Li, H., and W. Zhang, “Perovskite Tandem Solar Cells: From Fundamentals to Commercial Deployment,” Chemical Reviews, Vol. 120, 2020, pp. 9835–9950.
50. Li, Y., et al., “Optically Transparent Wood–Substrate for Perovskite Solar Cells,” ACS Sustainable Chemistry and Engineering, Vol. 7, No. 6, 2019, pp. 6061–6067.
51. Jia, Y., G. Alva, and G. Fang, “Development and Applications of Photovoltaic—Thermal Systems: A Review,” Renewable and Sustainable Energy Reviews, Vol. 102, 2019, pp. 249–265.
Problems
3.1 Calculate the maximum solar thermal energy capture efficiency for the heat transfer media shown in Figure 3.6. What will be the maximum overall efficiency of electricity generation (based on the incident solar energy) for a power conversion system utilizing these media?
3.2 What is the ratio of concentration factor for each heat transfer medium if the overall power conversion efficiency (solar energy to electrical energy) for the fluid is the same as that of carbonate salt?
3.3 Compare single-stage and two-stage solar concentrators based on factors such as efficiency, capital costs, operation and maintenance, and complexity.
3.4 What are the advantages and disadvantages of water as the heat transfer medium compared to other media for CSP applications?
3.5 What precautions must be taken when fluids with high melting points are used as heat transfer media in CSP applications?
3.6 What are the properties of carnallite that make it attractive as a raw material for the NaCl-KCl-MgCl2 ternary salt for CSP applications?
3.7 The heat transfer coefficient (h) for a forced flow system, such as heat exchangers in CSP applications, is often calculated using the Dittus–Boelter correlation, shown below in its rearranged form:
where Re is the Reynolds number, D, the pipe diameter, and k, the fluid thermal conductivity.
Assuming constant Re and D, what are the ratios of h for various CSP heat transfer media to that of the carbonate salt? Thermal conductivity data for the fluids can be obtained from resources such as the NIST (National Institute of Standards and Technology), Handbook of Chemistry and Physics, Perry’s Chemical Engineering Handbook, and many other resources available on the Internet.
3.8 Heat exchanger area A needed for any heat duty Q is obtained from the equation Q = h · A · ΔT, where ΔT is the temperature difference between the fluids in the heat exchanger, for example, the CSP heat transfer medium and water/steam. Assuming the same ΔT, what will be ratios of heat transfer areas for the fluids in question 3.7? (The size and cost of the heat exchanger are directly related to the area, and these in turn feed into the capital cost and economics of the process.)
3.9 Compare the various generations of PV cells on the basis of factors such as materials requirements, efficiency, and cost.
3.10 How is the point of maximum power determined for a PV cell from its voltage–current plot?
3.11 What are the differences in the processes for manufacturing crystalline and amorphous silicon for PV cells?
3.12 Describe the CVD process for formulating PV cells.
3.13 What are the advantages of the PSCs?
3.14 What are the attractive features of PV/T systems? What are the possible challenges that may prevent it from reaching its potential?