Chapter 5
EA Maturity Models
Content
Relevance of Maturity Models in EA
A Rule of Thumb for the Architectural Maturity of an Enterprise
Architecture Capability Maturity Model of the US Department of Commerce
EA Maturity Model by MIT Center for Information System Research
In the previous chapter, we saw that the EA frameworks are meant for effective management of enterprise architecture—just like what a diet-and-exercise plan does for healthy living. Both are prescriptive in nature, yet both need to be custom tailored for individual use. If so, EA maturity assessments come as diagnostic medical tests that help detect the deficiencies in EA against some recognized benchmark and accordingly take corrective actions for the desired improvement. EA frameworks aim to bring an order to EA management, and maturity models measure that orderliness and give the direction for improving it as needed.
The notion of maturity models is not new to IT organizations. There has been a continuous urge to improve IT practices and make them increasingly effective. In the early 1990s, the Software Engineering Institute (SEI)1 established the first Capability Maturity Model (CMM) for software development. It was meant to provide a consistent basis by which software development practices can be objectively measured, benchmarked, and improved. In subsequent years, it was realized that CMM can be applied as a general model to aid in improving many other organizational practices.
Applying maturity model to EA
In this section we look at the general notion of a maturity model and how that can be leveraged in effective management of enterprise architecture.
What is a maturity model?
A maturity model can be best described with the Maturity Grid shown in Table 5-1. This grid is made up of three parts:
• Maturity level. A model typically identifies a number of maturity levels, organized in ascending order. The columns in Table 5-1 represent maturity levels.
• Capability area. To assess the maturity of an organization in a particular field, the model identifies certain capability areas that are critical for the effectiveness and success in practicing that field. The rows in Table 5-1 represent capability areas.
• Assessment criteria. The model identifies a set of criteria in each capability area at each maturity level. These criteria are nothing but the descriptions of a practice or condition that is of importance in the respective field. The cells in Table 5-1 represent the assessment criteria.
A formal maturity assessment process should be followed to objectively evaluate an enterprise against the assessment criteria. The enterprise must fulfill the criteria by demonstrating relevant characteristics and supporting the same with appropriate evidence.
Table 5-1 A Maturity Grid

Generally, maturity levels in any capability area are cumulative. The attainment of a particular maturity level in a capability area requires fulfillment of the criteria at that level plus fulfillment of the criteria at all previous, less mature levels. The outcome of the assessment process is the maturity scorecard. It tells which criteria the enterprise satisfies and which ones it does not. It gives an indication of where the enterprise currently stands with regard to practicing the concerned field. It also identifies the gaps the enterprise must address in order to achieve desired improvements and results.
Let’s assume that a qualified assessor performs the assessment of an enterprise in a field of practice by validating the policies, processes, artifacts, and other supporting evidences against the assessment criteria. Let’s also assume that the underlying maturity model defines five maturity levels and identifies six capability areas for evaluation. The results of the assessments can then be represented as shown in Table 5-2.
Table 5-2 A Maturity Assessment Result

The maturity score for this enterprise can be viewed in a number of ways. In the classical staged maturity approach, an enterprise is certified at a maturity level only if it satisfies all the criteria for that maturity level plus all the criteria for all preceding maturity levels in all capability areas (entire columns). With the assessment result in Table 5-2, the enterprise will simply be certified at maturity level 2. It will then be advised to take corrective action in capability areas 2 and 5 if it subsequently wants to reach maturity level 3. This approach creates an impression that the enterprises can be placed at a single maturity level, whereas in reality enterprises may have different maturity levels in different capability areas.
In contrast, a continuous maturity approach provides a more realistic view of maturity. Here the maturity score for the enterprise is calculated using the simple average method. For the example in Table 5.2, the maturity score of the enterprise is calculated as follows:

Or alternatively,

Yet another way of looking at maturity is the extent to which an enterprise has attained a maturity in each capability area. With the same example in Table 5-2, it is expressed in percentages as:
Thus in a continuous maturity approach it is not necessary to fulfill all the criteria at a particular maturity level and all its predecessors in order to attain that maturity level. It offers the flexibility to prioritize and focus only on specific improvements that are beneficial and cost-justified. It also allows planning and implementing the improvements in different areas at different rates, as the situation may demand.
When the enterprise advances in its maturity level over a period of time, it gradually gains control over and improves on its practices pertaining to the concerned field. The maturity model provides a formal, effective, and proven way to do that. In essence, a maturity model can be used as:
Relevance of maturity models in EA
Like many other IT practices, EA is a process-rich and contemporary field. It involves many processes; you can easily do them in the wrong way. The enterprise and its employees need to learn the processes right in the first place. In addition, EA is a nontraditional field of practice. Many of the paths are still less traveled.
EA maturity models show the possible milestones and landmarks for the EA journey. By employing a maturity model, enterprises gradually learn to introduce right policies, processes, and practices while venturing into this new unknown field. The maturity model helps them do so by periodically measuring, benchmarking, and tracking the effectiveness of the steps they have taken in their EA effort. Because the maturity model defines ascending levels of maturity for management of EA, it can be used to determine the following parameters:
• Where EA stands today. The model can be used to provide a set of benchmarks against which to determine where the enterprise stands in its progress toward the ultimate goal: having EA capabilities that effectively facilitate organizational change.
• How to proceed on EA. A maturity model can serve as a high-level basis for developing specific EA improvement plans, as well as for measuring, reporting, and overseeing progress in implementing these plans to attain the next level, if needed.
The scope of a typical EA maturity assessment entails the evaluation of the following criteria:
• The state of EA itself (work products)
• The state of EA-related activities, processes, and practices
• The state of EA capabilities (people skills, organizational construct)
• The buy-in to EA (management commitment, stakeholder participation)
At the lower maturity level, the focus of enterprise architecture is typically on creating awareness, formalizing processes, and developing architectures. At the higher maturity level, the focus shifts to the use of architectures and value measurement.
EA maturity models are available in abundance. But before we look at a few of them, let’s first have a glance at a rule of thumb for EA maturity.
A rule of thumb for the architectural maturity of an enterprise
To get a first-hand impression about the architectural maturity of an enterprise, we can look at the two ratios pertaining to IT investment patterns:
The ratio (Run-the-business IT cost / Business revenue), expressed in percentage, can be benchmarked with the industry standards or compared with the closest competitors of the enterprise. If this is lower than either industry standards or competitors, it is an indication to believe that the enterprise’s IT is at least working in a cost-effective mode.
The second ratio (Run-the-business IT cost / Change-the-business IT cost), expressed in percentage, helps identify the role that IT plays in the business. Ross et al. (2010, pp. 2, 7) suggest that the lower this ratio is, the better it is. According to their survey, a ratio of 60:40 or less tells that IT is being perceived as a business change driver. A larger chunk of IT budget is apportioned to the new IT initiatives because IT has been optimized for its day-to-day operational support. IT also seems to enjoy a trust relationship with the business for new development.
In contrast, a ratio of 70:30 or more indicates that IT plays the role of an order taker. The business looks at IT as a support function, not as an enabler. With regard to this performance indicator, you can face pretty grim situations involving enterprise IT out in the field. In one of our projects, an insurance company struggled for three years to bring down this ratio marginally, from 87:13 to 84:16.
It must also be noted that EA is not the only contributor to these ratios. Many other downstream IT practices, such as project management, service management, software development, and so forth, play an equally influential role. Nonetheless, since EA is an upstream practice in IT management, we consider these ratios indicators for the notional state of EA. They help in determining how to proceed with an elaborate EA maturity assessment for the enterprise: where the focus should be and where the expected targets can reside.
OMB EA assessment framework
The US Office of Management and Budget (OMB)2 mandates that all government agencies must effectively adopt the Federal Enterprise Architecture (FEA) in their IT management. In that context, OMB (2009) has established an EA maturity model called the OMB Enterprise Architecture Assessment Framework (OMB EAAF). It is supposed to provide government agencies with a common benchmarking tool for planning and measuring their efforts to improve enterprise architecture management as well as to provide the OMB with a means for performing the same activity government-wide. OMB EAAF is perhaps the most comprehensive, robust, and practically enforced EA maturity model.
OMB audits the government agencies for their EA maturity and then uses the scorecard as a decision tool to fund their IT initiatives. Linking IT investment to EA maturity is a smart move. It is like granting scholarships to students only if they continue to score well in their exams, year on year. With EA maturity playing a key role in the budgetary approval process, OMB signifies and enforces the strategic importance of enterprise architecture (FEA) in and across the government agencies.
OMB EAAF identifies five maturity ratings (levels 1–5) without qualifying them with names or descriptions. It then groups the capability areas in three categories: completion of enterprise architecture; use of EA to drive improved decision making; and results achieved in advancing program effectiveness.
The Completion Capability Area looks at the extent to which the architecture development is complete at the enterprise and segment3 levels.
• Target enterprise architecture and enterprise transition plan. The baseline and target architectures must be well defined, showing traceability through all architectural layers. The enterprise transition plan,4 including major IT investments, must be submitted.
• Architectural prioritization. A formal and documented process to prioritize and plan the architectural work must be in place.
• Scope of completion. The extent to which enterprise IT portfolio funding is supported by the completed segment architectures needs to be measured.
• Internet Protocol Version 6 (IPv6). The EA (including enterprise transition plan) must incorporate Internet protocol version 6 (IPv6) into the IT infrastructure’s segment architecture and IT investment portfolio. (This is an enterprise-specific mandate by the US government, so to speak.)
The Use Capability Area measures the extent to which the necessary EA management practices, processes, and policies are established and integrated with strategic planning, information resources management, IT management, and capital planning and investment control processes.
• Performance improvement integration. The extent to which the enterprise has aligned its performance improvement plans5 (on the business side) with its enterprise transition plan (on the IT side) in terms of process and outcomes.
• CPIC integration. This parameter measures the alignment between the enterprise transition plan and capital planning and investment control (CPIC).
• FEA Reference Model and Exhibit 53 data quality. This assesses the completeness and accuracy of mapping the IT investments in the IT portfolio with the base FEA reference architecture model. Exhibit 53 is the business case for the IT investments demanded, or made, in the projects.
• Collaboration and reuse. The progress in migrating to target applications and shared services portfolio and creating a services environment within the enterprise. It also measures the progress in information sharing, with a focus on reuse.
• EA governance, program management, change management, and deployment. This parameter benchmarks the degree to which the enterprise governs and manages the implementation and use of EA policies and processes. We will take a brief look at corresponding assessment criteria later in this section.
The Results Capability Area validates whether the enterprise is measuring the effectiveness and value of its EA activities by assigning performance measures to its EA and related processes and then reporting on actual results to demonstrate EA success.
• Mission performance. This figure measures the extent to which the enterprise is using EA and IT to drive program performance improvement (that is, the business results).
• Cost savings and cost avoidance. Values the extent to which the enterprise is using EA and IT to control costs. The cost savings are best reflected in steady-state spending (run-the-business IT costs), which should go down over time as legacy systems are consolidated and retired.
• IT infrastructure portfolio quality. This parameter assesses the progress toward developing a high-quality portfolio of infrastructure investments, in terms of end user performance, security, reliability, availability, extensibility, and efficiency of operations and maintenance. (This also includes innovation and new technology induction.)
• Measuring EA program value. Measures the direct benefits of EA value to the decision makers. EA value measurement tracks architecture development and use, and monitors the impact of EA products and services on IT and business investment decisions, collaboration and reuse, standards compliance, stakeholder satisfaction, and other related measurement areas and indicators.
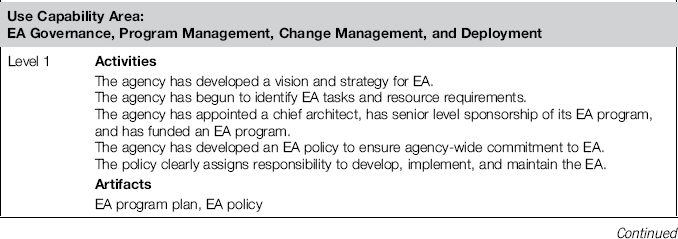
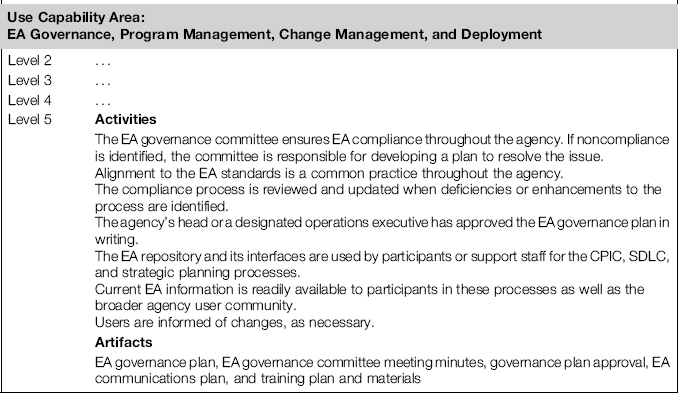
Let’s take a further glance at an example of how the assessment criteria are specified in this model. Table 5-3 is a reprint of the assessment criteria for maturity level 1 and level 5 of EA governance, program management, change management, and deployment in the Use Capability Area. Here read Agency as a synonym of Enterprise. It must be noted that each criterion is specified in a standard format. It identifies the activities that must be performed and the artifacts that are produced or used to attain that level.
Table 5-3 OMB EA Assessment Framework: Example Criteria
Looking at the structure and the content of OMB EA Assessment Framework, one can convincingly conclude that it is a complete EA maturity model. The only drawback, however, is that it is very specific and tightly aligned with OMB, FEA, and the US federal government and their terminologies.
Architecture capability maturity model of the US department of commerce
The US Department of Commerce published the Architecture Capability Maturity Model (ACMM) Version 1.2 in December 2007. We list it here because it is endorsed by the TOGAF 9.1 standard (The Open Group, 2011, p. 51). Compared to the other maturity models introduced in this chapter, however, ACMM is sketchy and less precise in documentation.
ACMM is inherited from the original SEI-CMM (see the introduction of this chapter). It determines whether appropriate EA practices are in place and are being effectively managed and used. To this effect, ACMM identifies five maturity levels that are based on the original SEI-CMM definitions:
• Level 0: None. An organization does not have an explicit architecture. (We do not really count this as a level.)
• Level 1: Initial. Limited architecture processes, documentation, and standards exist, but in a mostly ad hoc and localized form. There is a limited management awareness but no explicit governance in place.
• Level 2: Under Development. The essential architecture processes have been identified and defined. The basic current architecture and target architecture have been described. The management is aware and basic governance is in place.
• Level 3: Defined. The architecture processes are largely followed. The current and target architectures are well defined and communicated. The senior management and the other stakeholders are aware and supportive.
• Level 4: Managed. The architecture processes are part of the organizational culture. The architectures and processes are periodically assessed and revised. The senior management and the other stakeholders participate in the architecture evolution.
• Level 5: Optimizing. There is a concentrated effort to optimize and continuously improve the architecture processes, with direct contribution from senior management and key stakeholders.
ACMM broadly considers nine capability areas6 for maturity assessment:
1. Architecture Process. To what extent are the architecture processes established?
2. Architecture Development. To what degree are the development and progression of the architectures documented?
3. Business Linkage. To what extent are the architectures linked to the business strategies or drivers?
4. Senior Management Involvement. How much are the senior managers involved in the establishment and ongoing development of architecture?
5. Stakeholder (Operating Units) Participation:
• To what degree has the architecture process been accepted by the stakeholders?
• To what extent is the architecture process an effort backed by the whole organization?
6. Architecture Communication.
• To what degree are the decisions of architecture practice documented?
• What share of the architecture content is made available electronically to everybody in the organization?
• How much education is done across the business on the architecture process and contents?
7. IT Security. To what extent is IT security integrated with the architecture?
8. Governance. To what degree is an architecture governance (governing body) process in place and accepted by senior management?
9. IT Investment and Acquisition Strategy. How does the architecture influence the IT investment and acquisition strategy?
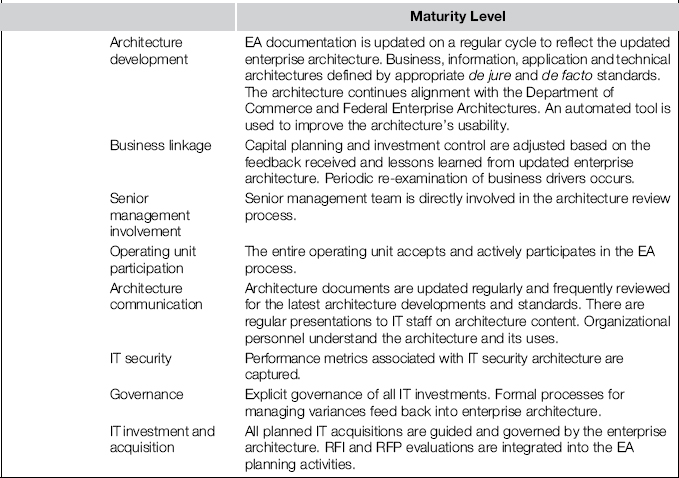
ACMM lists the criteria for each maturity level in each capability area. For example, Table 5-4 is a reprint of Maturity Level 4 criteria for all the capability areas. Here, read operating unit as a synonym for stakeholder (or business line).
Table 5-4 ACMM: Example Criteria at Maturity Level 4

EA maturity model by MIT center for information system research
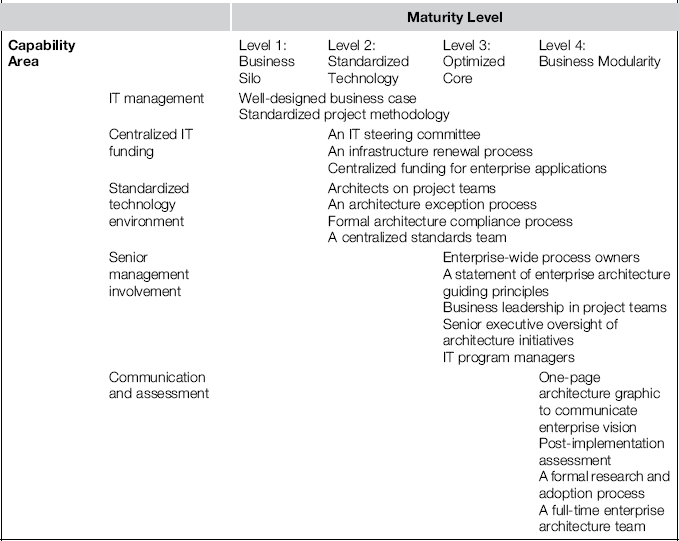
Jeanne W. Ross, from the MIT Center for Information System Research, has suggested an EA maturity model. In this model, Ross (2006) identifies four stages of architectural maturity. They are characterized by their IT investment patterns and by the management practices they are required to have. The IT investment patterns for these maturity stages are described as follows:
• Level 1: Business Silos. At this level, IT investments are put into local applications, predominantly driven by the business cases addressing local business needs of individual business units (or departments). The cost savings derived at this stage are primarily derived from the local business unit level optimization.
• Level 2: Standardized Technology. Here the enterprises begin to pull economies of scale by standardizing technology platforms and developing shared infrastructure services across their business units. The cost savings at this stage come from IT efficiencies (cost and risk reduction at the enterprise level).
• Level 3: Optimized Core. At this stage, the enterprises begin to leverage organizational synergies by sharing data and standardizing the business processes across its business units. The business benefits received at this stage come from operational efficiencies (process harmonization, data availability, and data quality at the enterprise level).
• Level 4: Business Modularity. On this last level, enterprises are focused on smaller, reusable application and process components to support a more modular and flexible operating model. The business value generated at this stage can be measured in terms of the enterprises’ strategic agility and responsiveness to market dynamics. IT enables the enterprise to respond rapidly to competitor initiatives and market opportunities. It is thereby directly contributing to business growth.
The IT investment patterns in the enterprises change as they move from one stage to the next.
The model further outlines how enterprises can progressively learn and formalize practices at each stage. This way they can benefit from the current stage and, if appropriate, move toward the next stage. It was statistically observed that at each level specific management practices contribute significant value to the enterprise. The enterprises must therefore enable new management practices as they progress from one stage to the next. These management practices need to support the investment patterns at respective maturity stages. The key management practices for each stage are summarized in Table 5-5 (Ross, 2006, p. 3).
Table 5-5 EA Maturity Model by MIT–CISR (Ross, 2006, used with kind permission)
The final word of advice by Jeanne Ross (2006, p. 3) is worth repeating:
The firms embarking on an enterprise architecture journey should plan for steady increases in IT value through gradual enhancements in IT management (architectural maturity progression from stage 1 to stage 4, step by step). We have found no shortcuts to business value from IT.
Experiences with the maturity models
The best-documented case of broad usage of the EA maturity model is the OMB EA Assessment Framework. Despite a robust EA maturity model and stringent management control by the OMB, many government agencies have not progressed well on EA. In 2005 (after eight years of the federal EA initiative), the General Accountability Office (GAO)7 criticized a number of government agencies for their failures in EA adoption. The defaulter list includes the Federal Bureau of Investigation (FBI), National Aeronautics and Space Administration (NASA), and the Departments of Defense and Homeland Security (Sessions, 2006). This probably sheds a bad light on the maturity of some US agencies in terms of their EA culture; however, the application of an EA maturity model has at least uncovered this state.
In our own experience, we have seen that the maturity models have their limitations. For instance, a telecom company in Europe that we dealt with in our work does convincingly rate itself at the highest level (Level 4) on the MIT–CISR EA Maturity Model. It has every practice in place and satisfies every condition that the maturity model demands. However, the company is still struggling to get any closer to its vision of business modularity, even after putting significant effort and investment in its EA program for the last seven years (since 2004).
Quite often, a maturity assessment has a tendency to show some (or all) of the following traits:
• Subjective. The maturity assessment is highly subjective and is influenced by assessors’ bias of perception. Although a number of measures are taken to remove subjectivity in the assessment process, it still lingers and shows.
• Academic. Often a maturity assessment is performed for the sake of compliance in accordance with the imposed letter of the law. It rarely reflects the true intent and spirit of the enterprise for excellence in the respective field.
• Manipulative. As people get acquainted with the assessment process, they learn how to create the perception of compliance without practicing it in real life. It then becomes an oversimplified, superfluous farce for the sake of certification only—an act of pseudo-certification. The maturity scorecard looks impressive on paper, but it rarely shows the true picture of the extent to which EA has actually been ingrained in the spirit and culture of the organization.
• Bureaucratic. As the maturity assessment process becomes an all-encompassing audit, it tends to be an overly complicated, strenuous, and bureaucratic process. It can lead to considerable administrative overhead and costs. Many organizations take up the assessment process as a formal project and bring a dedicated team on board (a project management office, or PMO) to pass through it smoothly.
• Superfluous. Two or more organizations might not be equal, even if they are rated at the same maturity level. In reality, they might have totally different agendas, scopes, and ways of performing EA. The abstraction of the maturity score to a single number does not necessarily give a real benchmark for comparison of the spirit, character, or personalities of two organizations, even though from the outside they seem to be akin.
• Misleading. The maturity model generally suggests a linear and unilateral path of progression toward a higher maturity. At the very least, it leaves the impression that the more you do, the better it will be. As a result, you can overdo things while chasing a desired maturity level. However, higher maturity is not a goal in itself. Not all enterprises are ambitious to reach the highest maturity level, and not all of them need to. The benefits of a higher maturity level might not justify the costs of attaining it. In addition, the formality and rigor at a higher maturity level may in fact conflict with a culture of innovation and creativity in the organization.
To overcome some of these limitations in the maturity models, we propose the EA Dashboard, as introduced in Chapter 1 as a supplement to the EA maturity models. Unlike an EA maturity model that demands a unilateral maturity progression for an EA effort, irrespective of the contextual priorities and constraints of the enterprise, the EA Dashboard helps us take a balanced view that measures the effectiveness of an EA effort in light of the ground realities in the enterprise. With a more pragmatic and broader look at EA, the EA Dashboard offers a realistic and convincing approach to govern an EA effort. This is its sole goal: We will not attempt to offer an objective list of criteria to create an industry benchmark by it. We will discuss the EA Dashboard at further length in Chapter 6.
1 SEI is a research and development center sponsored by the US Department of Defense and operated by Carnegie Mellon University.
2 The Office of Management and Budget is a part of the Executive Office of the President of the United States. It serves the function of presidential oversight on federal agencies.
3 Segment architecture is the next layer of EA for a government agency (which is seen as an enterprise). The segment architecture describes a portion of the enterprise. There are three types of segment architectures: enterprise services (e.g., knowledge management, security management, geospatial mapping, reporting), business services (human resource, financial management, direct loans, and so forth), and core mission area (e.g., health, homeland security, pollution prevention and control, energy supply, education grants). The term services here is not to be confused with service as in service-oriented architecture (SOA). The two terms have entirely different connotations.
4 The enterprise transition plan identifies a desired set of business and IT capabilities along the path to achieve the target enterprise architecture. It also identifies the logical dependencies and priorities among major activities related to project or program and investment. The enterprise transition plan supports an IT-enabled performance improvement plan to fulfill the overall mission of the government agency.
5 The performance improvement plan captures enterprise-wide improvement opportunities linked to the government agency’s mission performance and strategic goals.
6 In ACMM, capability areas are termed architecture elements.
7 The General Accountability Office (GAO) is responsible for monitoring the effectiveness of different organizations within the US federal government.
