Landing Gear Design
Abstract
An introduction to the general characteristics of commercial jet transport landing gear is presented. Requirements for the size and location of the landing gear and the associated ground handling characteristics are discussed. Operational factors considered include quasi-static loads on landing gear, dynamic loads in landing, and stability considerations in determining the location of the main gear and the nose gear. Also treated are ground clearance requirements in takeoff and landing, positioning the landing gear, maneuverability in ground operations, and powered wheel-drive systems. Methods for the selection of aircraft tires and wheels based on load requirements are covered. Landing gear configurations, shock-absorbing landing gear struts, and methods for properly sizing such struts, and dynamic landing gear analysis are discussed. Landing brake system design and sizing approaches are described.
Keywords
Landing gear
Grounding handling
Oleo struts
Tires
Wheels
Brakes
7.1 Introduction
The landing gear serves to support the aircraft while standing on the ground, to provide a stable platform during the takeoff roll, and to accommodate the stress of landing and braking. In addition, it must be capable of retracting sufficiently to be stowed aboard the aircraft within an aerodynamically streamlined contour. A detailed development of landing gear theory and practice is given by Curry (1988).
7.2 General characteristics of commercial jet transport landing gear
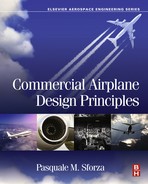
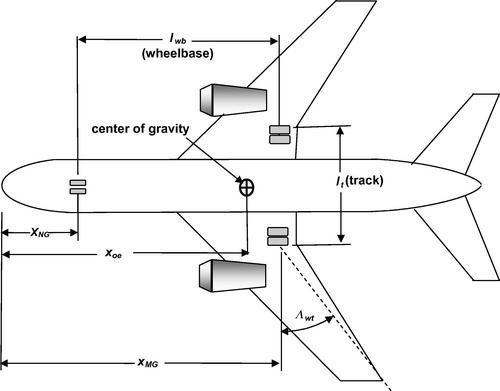
Jet transports use tricycle-type landing gear with nose gear aligned with the fuselage centerline and main gear symmetrically disposed with respect to the aircraft centerline and located aft of the aircraft center of gravity, as shown schematically in Figures 7.1 and 7.2. The basic requirement is that the landing gear safely support the aircraft weight under all static loading conditions, provide adequate stability and maneuverability during takeoff acceleration, properly retract and extend from locations within the aircraft contour, and accommodate the dynamic loads incurred in transitioning from flight to ground operation.
7.2.1 Quasi-static loads on landing gear
When the aircraft is stationary or taxiing at constant speed such that accelerations are very small, force equilibrium requires that
The symmetric disposition of the main gear about the fuselage centerline ensures that the forces on the port and starboard components of the main gear are equal, with each supporting a load equal to FMG/2. The farthest aft center of gravity location, which occurs in the operating empty weight configuration, produces the greatest static load on the main gear. Taking moments about the center of gravity in the operating empty weight configuration, and enforcing the condition that there be no net moment acting yields
From Equations (7.1) and (7.2) we find the static loads on the nose and main gear to be as follows:
Commercial aircraft typically have xoe/lf ∼ 0.45, xNG/lf ∼ 0.10, and xMG/lf ∼ 0.50 so that lwb = xMG − xNG ∼ 0.40lf. It may be expected then that about 85–90% of the static load is taken by the main gear and the remaining 10–15% by the nose gear. The loading of the payload, that is, passengers and cargo, onto the aircraft must be carried out in such a way that the center of gravity is kept forward of xoe.
7.2.2 Dynamic loads in landing
In a nominal landing the aircraft has a nose up attitude so that the main gear touch first, activating the lift dumpers, or spoilers, on the wings thereby reducing the lift. The aircraft nose is rotated down to contact the runway surface and when all wheels are firmly on the ground, reverse thrust and wheel braking are initiated. The effect of wheel braking serves to put a high load on the nose gear, as can be appreciated by first considering the schematic diagram of forces in Figure 7.3. The aircraft has a deceleration parallel to the ground but essentially no angular acceleration about its axis because of the constraint of the ground plane.
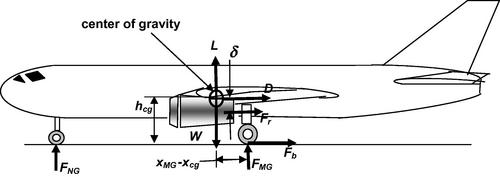
Because there is no angular acceleration about the center of gravity there can be no unbalanced moment about that point. Therefore we can consider the moments acting around the center of gravity of the aircraft as a static problem with the following result:
Equation (7.5) may be written as
Because there is also no vertical acceleration we require that
Using Equation (7.7) transforms Equation (7.6) into
The first term in Equation (7.8) is of the form of the static load on the nose gear as given previously in Equation (7.3), less the alleviating effect of lift. As shown in Equation (7.3) the furthest aft center of gravity location, xoe, provides the least static load on the nose gear. However, the second term in Equation (7.8) represents the added load due to deceleration forcing the nose down and increasing the load on the nose gear. Thus braking poses the most stressing case for the load on the nose gear. The third term in Equation (7.8) accounts for the effect of thrust reversal and is shown as providing a nose down moment for wing-mounted engines. For fuselage-mounted engines, which are generally located somewhat above the airplane’s center of gravity, the sign of the third term in Equation (7.8) should be reversed.
We see that the maximum load on the nose gear occurs during braking when L and Fr are small. The lift is dumped upon touchdown and drops to low levels once the nose gear contacts the runway. A discussion of the use of thrust reversers is given in Chapter 10, but for the present analysis one may consider the worst case, that is, Fr = 0. Commercial airline operators typically call for cut-off of the thrust reversers at a speed of 60–80 knots, according to Yetter (1995). If we characterize the braking force as Fb = (W/g)a, where a is the average deceleration, then the maximum force on the nose gear is
The important parameters here are the deceleration level, which is typically in the range of 0.33 < (a/g) < 0.45 for dry concrete runways, and the ratio of center of gravity height to wheelbase, which is generally in the range 0.16 < hcg/lwb < 0.23. The first term in the square brackets in Equation (7.9), using the approximate dimensions in Section 7.2.1, is around 0.15, while the second term can range from 0.05 to 0.1. Thus the effect of braking is to increase the load on the nose gear by a factor of 33–67% over the static load. Federal Air Regulations (FAR) require nose wheel tires to withstand a load under braking 50% greater than the static load, as will be discussed in a subsequent section.
The ratios hcg/lwb and lwb/lf are given for a number of commercial aircraft in Table 7.1. The dimensions are estimated from drawings or published data from, for example, Jackson (2010). A graphical representation of the data appears in Figure 7.4. It is clear that the variation of these ratios over a wide range of aircraft sizes is rather slight and the average value of hcg/lwb is 0.2 and that for lwb/lf is 0.42.
Landing Gear Characteristics of Operational Airliners
| Aircraft | hoe/lwb | lwb (ft) | lf (ft) | lwb/lf | Wto (lbs) | lt (ft) | lt/2lwb | b (degrees) | hoe/lt |
| B737-700 | 0.21 | 41 | 105 | 0.39 | 133,000 | 18.75 | 0.227 | 12.8 | 0.463 |
| B737-800 | 0.18 | 57 | 125 | 0.46 | 155,500 | 18.75 | 0.164 | 9.3 | 0.549 |
| B737-900 | 0.16 | 56 | 133 | 0.42 | 164,000 | 18.75 | 0.166 | 9.4 | 0.481 |
| B747-400 | 0.2 | 84a | 225 | 0.37 | 800,000 | 36.08b | 0.215 | 12.1 | 0.466 |
| B767-200 | 0.23 | 65 | 155 | 0.42 | 345,000 | 30.5 | 0.236 | 13.3 | 0.487 |
| B767-300 | 0.2 | 75 | 176 | 0.42 | 380,000 | 30.5 | 0.204 | 11.5 | 0.490 |
| B777-200 | 0.2 | 95 | 209 | 0.45 | 545,000 | 36 | 0.190 | 10.7 | 0.527 |
| B777-300 | 0.17 | 103 | 240 | 0.43 | 660,000 | 36 | 0.176 | 10.0 | 0.484 |
| B787-8 | 0.19 | 75 | 183 | 0.41 | 484,000 | 32.16 | 0.215 | 12.2 | 0.441 |
| B787-9 | 0.19 | 85 | 204 | 0.42 | 540,500 | 32.16 | 0.190 | 10.8 | 0.500 |
| A320 | 0.23 | 42 | 123 | 0.34 | 162,040 | 24.92 | 0.300 | 16.7 | 0.383 |
| A330-300 | 0.21 | 84 | 209 | 0.40 | 507,060 | 34.42 | 0.205 | 11.6 | 0.512 |
| A340-300 | 0.2 | 83 | 209 | 0.40 | 606,275 | 34.42 | 0.207 | 11.7 | 0.484 |
| A350-900 | 0.2 | 94 | 219 | 0.43 | 584,225 | 34.77 | 0.185 | 10.5 | 0.541 |
| A380 | 0.19 | 115a | 231 | 0.50 | 1,234,590 | 40.85b | 0.178 | 10.1 | 0.535 |
| E175 | 0.21 | 37 | 102 | 0.36 | 82,673 | 13.5 | 0.182 | 10.3 | 0.577 |
| CRJ700 | 0.17 | 45 | 97 | 0.46 | 72,750 | 18.76 | 0.209 | 11.8 | 0.406 |
| Average | 0.20 | 0.42 | 0.203 | 11.5 | 0.490 |
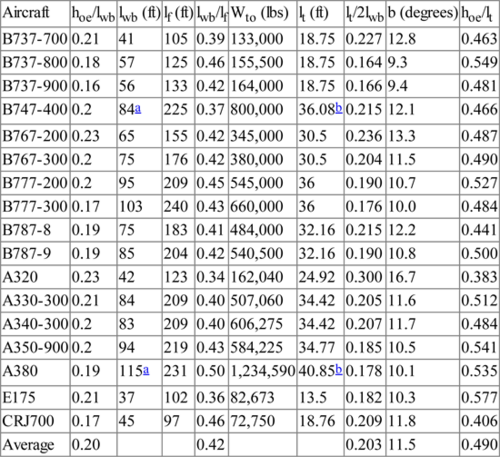
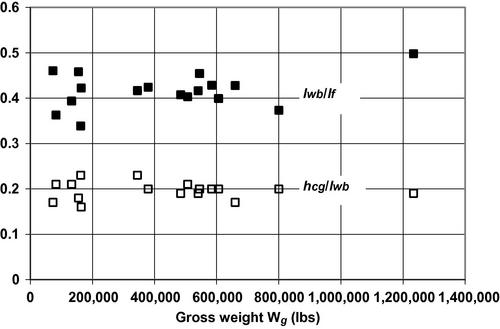
Figure 7.4 Estimated ratios of hcg/lwb (open symbols) and lwb/lf (closed symbols) are shown for 17 operational jet transports as a function of aircraft gross weight.
Impact loads occur during touchdown. The main gear touch first and the sink rate of the aircraft must be low enough to avoid high loads on the main gear which may lead to a blowout of one or more tires. The desired sink rate, or vertical velocity, is generally kept to less than 3 ft/s for commercial aircraft. The Space Shuttle Orbiter was designed for 3 ft/s, while naval carrier aircraft have allowable sink rates of 15 ft/s or more. As described in Chapter 10, the approach flight path angle γ ∼ 3° so the sink rate w ∼ Vatanγ ∼ 0.05Va. In Chapter 4 approach equivalent airspeeds for large transport aircraft were shown to be about 150 kts (173 mph = 253 ft/s) so that the corresponding sink rate is w ∼ 12.7 ft/s, a value too high for typical commercial aircraft operations. A sink rate of even 4 or 5 ft/s is considered very bumpy and uncomfortable for passengers. The flare maneuver prior to touchdown reduces the flight path angle to zero and in the process reduces the sink rate to a much more comfortable 2 or 3 ft/s. Lift is still being produced at the instant of touchdown and while the aircraft settles the lift dumpers, or spoilers, have been deployed and the lift rapidly diminishes causing the aircraft to settle more rapidly on the main gear.
The main gear struts are essentially shock absorbers, often called oleo-pneumatic struts, which operate on the principle of compressing a gas in the strut by means of a piston inside the strut to store the energy of the touchdown. Oil carried between the gas and the piston is then forced by the high-pressure gas through internal orifices to extend the duration of impact and thereby distribute the impact load over a finite time period, lessening the effect of impact. Details of the operation of the oleo-pneumatic shock strut will be discussed subsequently in Section 7.4. In addition, the nose gear is exposed to impact loads when downward rotation of the nose is complete and the nose gear wheels contact the runway surface. The horizontal tail provides control over the rotation rate.
7.2.3 Location of the main gear
The touchdown of the aircraft is in a nose-up attitude with the main gear contacting the runway first. A schematic diagram of the landing gear at this point is shown in Figure 7.5. To preserve clarity the gear legs are shown attached to a plane which is tilted at the maximum touchdown pitch angle θtd and the center of gravity is shown at its most aft and highest position. This is the worst-case situation for which we must place the main gear so that the maximum pitch angle is not exceeded. The limits on the touchdown pitch angle will be discussed in a subsequent section.
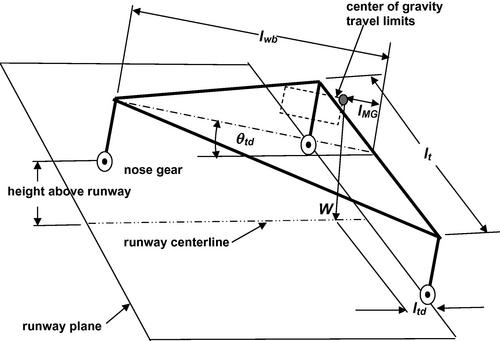
Figure 7.5 Schematic of aircraft landing gear geometry at the point of main gear touchdown where the pitch angle is θtd and the center of gravity is at the highest and most aft point.
A detailed view of the main gear in its extended position just at the point of contact with the runway surface is shown in Figure 7.6. The height of the main gear measured between the ground and the aircraft center of gravity under essentially static conditions is hMG and when the aircraft is well off the runway the oleo strut relaxes and extends a further distance, es. Note that as lMG decreases, the angle θ′td approaches θtd and the main gear wheel contact point would be directly beneath the center of gravity. In order to ensure stability it is appropriate to require that
This requirement sets the minimum distance of the main gear from the farthest aft and highest center of gravity location and the least aft position of the main gear is thereby specified. The center of gravity location is influenced by the weight and placement of the landing gear, so detailed positioning of the landing gear is part of the weight and balance analysis which will be carried out in Chapter 8.
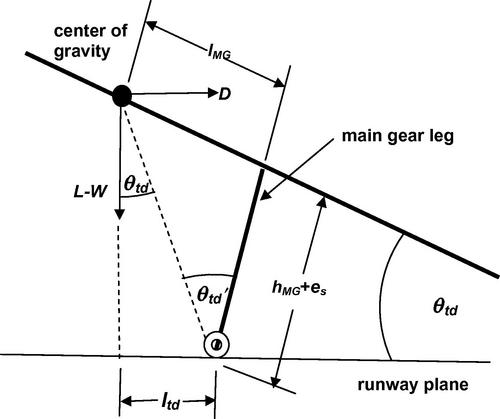
Figure 7.6 Detailed view of the main gear touchdown shown in Figure 5.
7.2.4 Location of the nose gear
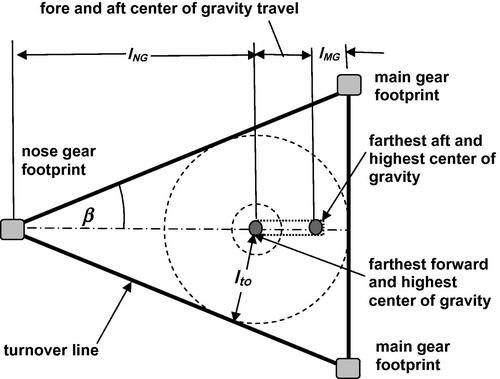
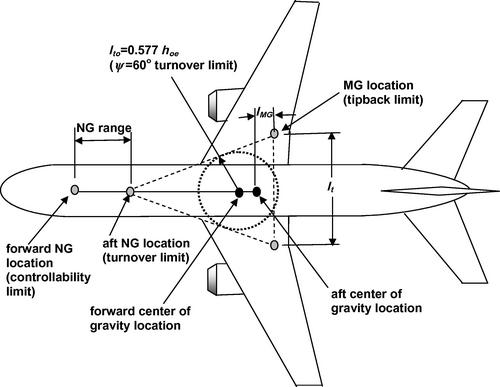
After the concern expressed in the previous section regarding a backward turnover of the aircraft, it is apparent that preventing a possible sideways turnover must also be considered. Once the aircraft is on the ground the main forces acting are those due to braking deceleration, to centrifugal acceleration in turning, and cross wind drag. A schematic diagram of the footprint the landing gear makes on the ground surface is shown in Figure 7.7.
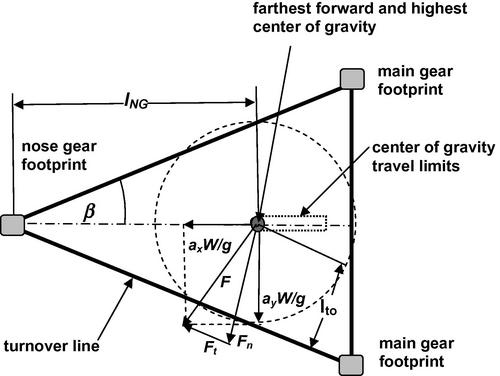
Figure 7.7 Schematic diagram of landing gear footprint showing inertia forces acting at the highest, farthest forward center of gravity location.
Sideways turnover may occur along the line joining the nose gear footprint and either main gear footprint as a result of the inertia forces that may arise, shown in Figure 7.7 as a longitudinal component axW/g and a spanwise component ayW/g, where a denotes the acceleration and g the gravitational acceleration. Because these forces are acting at the center of gravity they produce a moment about the turnover line hcgFn, where Fn is the component of the resultant force normal to the turnover line. The weight W of the aircraft resists the turnover through the moment arm lto so that the moments balance where
The quantity ψ is called the turnover angle and is typically considered to be limited to a maximum of 60° although a value of 55–57° may be considered a better choice. The turnover distance
The angle β in Equation (7.12) is defined by tanβ = lt/2lwb. The maximum acceleration load on the aircraft in landing is the braking deceleration, which may be as much as 0.5 g. Therefore, we may take the worst case, one where ax = ay = 0.5 so that Fn = 0.707Wcosβ and
We may estimate β = 11.5° from the average value of lt/2lwb = 0.203 given in Table 7.1. Thus, Equation (7.13) yields ψ = 55.3°, which is approximately the value suggested as a rule of thumb at the start of the discussion of the turnover condition. Using a value for ψ and knowing the highest and farthest forward location of the center of gravity, Equation (7.11) defines the distance lto. The axial location of the main gear lMG is fixed by Equation (7.10) for the farthest aft and highest center of gravity location so that the track lt can be determined for any nose gear position lNG, as illustrated in Figure 7.8. The static load on the nose gear, discussed in Section 7.2.1, should be greater than about 0.09Wg to ensure adequate controllability during the ground roll and is typically around 0.15Woe, where Woe is the empty operating weight.
The previous discussion assumes that the main gear is rigid, but the shock absorbing nature of the struts permits some degree of roll and that case is illustrated (with an exaggerated roll angle for clarity) in Figure 7.9. Here we see that for a given turnover line the roll-induced movement of the center of gravity toward the turnover line reduces the moment arm for turnover while also reducing the moment arm for the restoring effect of the aircraft weight W. It is clear that to maintain the same line of action of the resultant force Fn,roll < Fn so that the case with roll is more susceptible to turnover. Additional detail on the case with roll is given by Torenbeek (1982).
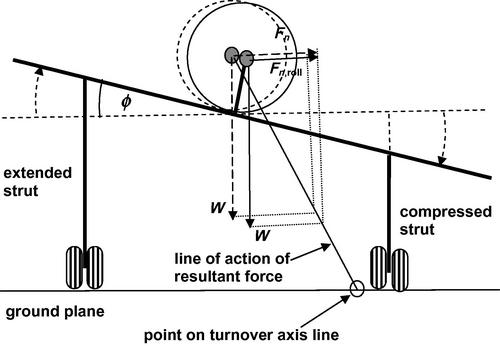
Figure 7.9 Schematic diagram of force structure with and without a roll angle looking at the aircraft from the front. The roll angle is exaggerated for clarity.
7.2.5 Ground clearance in takeoff and landing
During flight operations close to the ground, adequate clearance between aircraft components and the ground must be maintained. Therefore, limits on pitch and bank angles must be prescribed and it is preferable that ground clearance limits are outside the performance limits required for safe aircraft performance. In Chapter 3 the need for a kick-up of the aft underside of the fuselage is necessary to avoid tail strikes when operating at high angles of attack typical of landing and takeoff. The geometry to be considered is shown in Figure 7.10. It is desirable for the clearance angle θ to be larger than the maximum angle of attack αmax of the aircraft during the takeoff or landing operation. In takeoff, as the aircraft nose is rotated up at a rate dθ/dt, which is typically around 3 or 4 deg/s, the aft fuselage rotates downward as the aircraft begins to rise above the runway. As the airplane climbs the rear of the fuselage is still moving down toward the runway so that the clearance angle may be estimated by
Here the characteristic time interval Δt is estimated by Torenbeek (1982) to be given by
The subscript off in Equation (7.11) refers to the condition when the landing gear struts are fully extended and a denotes the lift curve slope for the aircraft. Torenbeek (1982) presents an approach for calculating the terms in Equation (7.11). However, at this point in the design process we may estimate a global value for Δt by first rewriting Equation (7.15) as
For jet transports the lift curve slope a is around 4.5 per radian, the takeoff wing loading (W/S)to is around 125 lb/ft2, and at sea level ρg = 0.076 lb/ft3. Furthermore, la/lb is typically around 15% so that
In Equation (7.17) we have assumed that lb ∼ lf/2 ∼ 100 ft so that the characteristic time is about 1.5 s and θ = αmax + (4 deg/s)(1.5 s) = αmax + 6°. For aircraft with the usual high lift devices αmax is usually around 8° or 9° so θ should be about 15°.
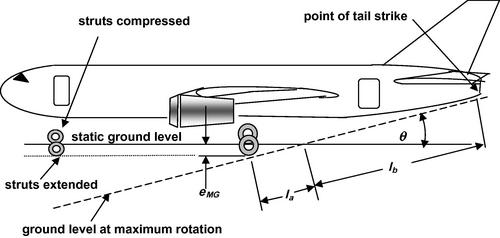
In the same manner the bank angle limit during takeoff may be estimated. The geometry of this situation is shown in Figure 7.11. Banking of the aircraft due to, for example, crosswinds might cause the wingtip to strike the ground. Though not apparent from the geometry shown in Figure 7.10, it may also be the case that before the wingtip strikes the ground the nacelle lip might do so. The bank angle must be limited so that neither event occurs. The maximum bank angle allowable is

Here we account for the furthest aft point on the wingtip, defined by Λwt and illustrated in Figure 7.1, touching the ground at any time during the rotation through the pitch angle θ shown in Figure 7.10.
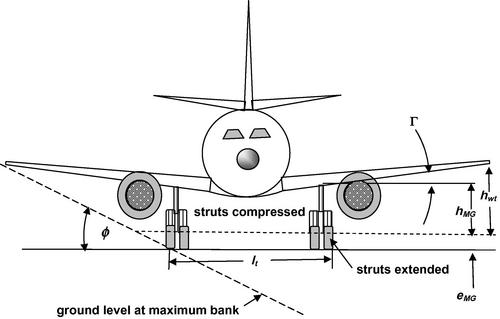
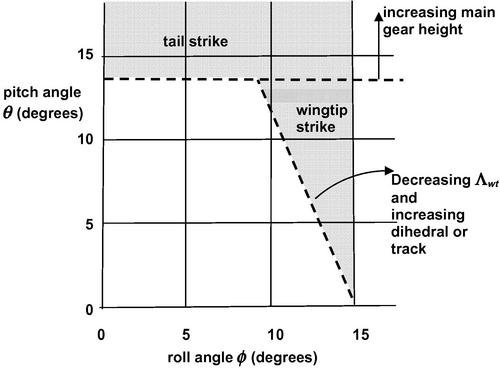
For a given aircraft configuration the allowable bank angle has the form tanφ = c1 − c2tanθ and one may construct an envelope for allowable bank angle as a function of pitch angle, as shown in Figure 7.12. As mentioned in the discussion following Equation (7.17) the largest value of θ for jet transports is about 15° and since the expansion for small θ is tanθ = θ + θ3/3! + ⋯ ∼ θ. The roll angle φ is similarly small so that we may write φ = c1 − c2θ. Note that the envelope for fuselage ground clearance may be increased by increasing the main gear height hMG and the fuselage tail cone kick-up angle θTC. The ground clearance envelope for wingtip clearance may be increased by widening the track of the main gear lt, increasing the dihedral, and/or decreasing the wing sweepback. All these factors are influenced by other aspects of the airplane design goals of weight and performance so they cannot be freely altered. It is more likely that they will be set by other issues and the ground clearance limitation will be only marginally alterable. It should be noted that in designs using four wing-mounted engines, the ground clearance for the outboard nacelles will be the limiting factor rather than the wingtips. These limits may be determined using the approach developed for the wingtips.
7.2.6 Operational considerations for positioning the landing gear
When the aircraft is in motion on the ground, the nose gear must be capable of providing adequate control of the aircraft heading in spite of possible runway surface irregularities. This requirement favors placing the nose gear far forward because lengthening the wheelbase lwb increases directional stability and reduces the possibility of turnover, as discussed in Section 7.2.4. On the other hand, at the same time there must be sufficient load on the nose gear to ensure maintenance of contact and the ability to provide appropriate steering forces but the additional loads due to braking would increase, as shown in Section 7.2.2. This requirement would seem to favor positioning the nose wheel to a more aft position but not beyond the point at which turnover becomes a critical consideration. Thus there is a range of nose gear locations that takes these factors into account, as illustrated in Figure 7.13, and a suitable point in this range must be selected.
The main gear must be positioned aft of the rearmost center of gravity to ensure that the fuselage does not tip backwards and strike the ground. Moving the main gear far aft would ensure that tipping is not a problem. However, in takeoff the aircraft must be rotated in exactly the same manner and this is achieved by downward force exerted by the horizontal tail. This force acts through a moment arm connecting the aerodynamic center of the horizontal tail and the main gear contact point with the runway surface. If the main gear is moved farther aft, the moment arm just described will be shortened and the moment available to rotate the aircraft to the takeoff attitude reduced. Once again there is a tradeoff, now in the main gear location, that takes the competing requirements into consideration. The basic requirement that the main gear be set at lMG, as shown in Figure 7.13, was developed in Section 7.2.3.
The disposition of the landing gear in Figure 7.13 defines the wheelbase and track of the landing gear and the remaining global factor is the height of the landing gear. This dimension is primarily a function of ground clearance considerations as discussed in Section 7.2.5. Generally, the designer would select the shortest landing gear that satisfies all the clearance problems since that would be the lightest weight system possible. However, there are additional constraints on the landing gear height, For example, with the selected track and the shortest landing gear, will there be sufficient space for complete retraction of the landing gear? For example, Flottau and Norris (2012) report that the lengthened nose gear required for the B737MAX, an increased range version of the B737, resulted in the designers considering a bulge, or chin fairing, on the nose to accommodate the increased length. In a similar fashion, if a future stretched version of the design aircraft is desired the landing may not be able to tolerate the same degree of pitch rotation, θ. It is also possible that the available length for the shock absorber portion of the landing gear strut may be insufficient.
7.2.7 Maneuverability in ground operations
The aircraft must be able to execute turns in order to proceed from the gate to the runway and this will require a prescribed level of maneuverability because the layouts of runways and taxiways are existing features of airports. The basic maneuver is a circular turn, which takes place by steering the nose wheel about one of the main gear legs as shown in Figure 7.14.
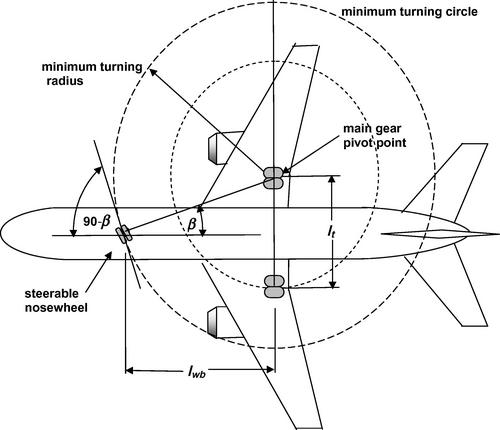
Figure 7.14 Minimum turning radius of a jet transport showing rotation about one main gear leg using steerable nose wheel.
The turning circle shown in Figure 7.14 assumes that the steering angle χ achievable by the nose wheel is given by 90° − β where tanβ = lt/2lwb. As mentioned in Section 7.2.4, the average value of β is 11.5° which suggests a steering angle of 78.5°. Most jet transports have steering angles around in the range 65° < χ < 75° and so the minimum turning radius is less than the track of the aircraft. Therefore to execute a complete 180° turn the runway must be wider than twice the track of the aircraft. The turn radius achievable as a function of nose wheel steering angle is schematically illustrated in Figure 7.15. The locus of centers of rotation is the main gear axis and the path of the nose wheel and main gear are indicated. To execute a 180° turn the diameter of the turn is larger than the track and is given by
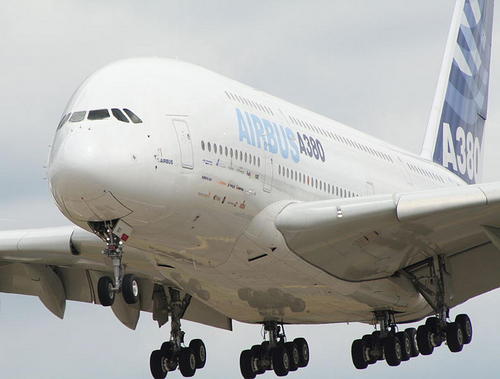
The use of nose wheel steering alone results in some degree of scuffing of the tires and newer, larger aircraft, like the B747, B777, and the A380 have steering capability built into the main gear as well as in the nose wheel. The elaborate nature of the A380 main gear, which has 20 wheels, in fuselage and wing mountings, is shown in Figure 7.16. This reduces scrubbing wear on the tires and improved maneuverability, but at the expense of extra weight. Equation (7.19) should be sufficient for preliminary design studies.
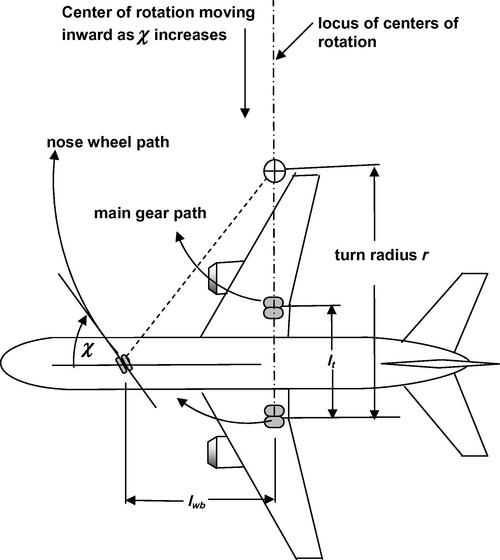
Figure 7.15 Turning radius r of a jet transport showing the path of the nose wheel and the main gear leg and the steering angle χ.
7.2.8 Powered wheel-drive systems
In the attempt to curtail fuel consumption, serious attention is being paid to mounting electric motors on the landing gear to drive the wheels during taxiing operations. Such systems can reduce noise, exhaust emissions, and fuel usage by permitting the turbofans to be idling during ground movements. Wall (2012) reports that current testing of electric wheel-drive systems includes those driving the main gear wheels and those driving the nose gear wheels alone, with power coming from the onboard auxiliary power unit (APU). Because weight is such an important driver, two approaches are under consideration: a push back only system with a 3 mph speed capability and a full taxiing system with 30 mph capability. The tradeoff is between the weight of the electric wheel-drive system and the weight of fuel that can be offloaded because of fuel savings. Minimum fuel burn for a B737 taxiing on one engine is reported to be about 15 lb/min and crews typically add 30 min of fuel (about 450 lbs) for contingencies. Powering the electric wheel-drive with the APU cuts fuel burn during taxiing by up to 85% and permits the loading of only 60 lbs of contingency fuel yet retaining the same degree of operational flexibility. Manufacturers of electric wheel-drive systems project savings of up to 130 tons of fuel per year for the average A320 or B737 operator.
7.3 Aircraft tires and wheels
Aircraft operating conditions require a wide variety of tire sizes and constructions. The modern aircraft tire is a complex composite structure designed to carry heavy loads at high rolling speeds while being as light in weight and small in size as is economically practical. By weight, an aircraft tire is approximately 50% rubber, 45% fabric, and 5% steel and different types of nylon and rubber compounds are combined in a tire so as to best achieve the operational extremes required. Their composite construction is classified as either of bias-type or radial-type, the former using plies of material arranged at angles of 30° and 60° and the latter using plies arranged at 90°.
Tires must be able to take the loads imposed by the stressful conditions of landing and takeoff as well as maintain appropriate “flotation” on the airport runway surfaces. Flotation refers to the footprint of the tire on the runway surface; the larger the footprint, the lower the load per unit area on the runway surface. The load capacity of a tire depends directly upon the inflation pressure, the number of plies used in the construction, and on the size of the tire and the wheel. The load rating of the tire is the maximum permissible load carried by the tire at rest. The maximum load under braking is generally designed by the tire manufacturer to be 1.5 times the maximum static load in order to comply with the FAA regulations which are discussed subsequently in Section 7.3.1.
Consider, for example, specifying an H40 × 14.5-19 tire with a ply rating of 22. The first number indicates the nominal tire diameter d (40 in.), the next is the nominal tire width w (14.5 in.), and the last is the wheel diameter (19 in.); there are sometimes additional notations providing additional detail, such as the “H” in the example cited, which refers to a higher flotation, or greater deflection and therefore larger footprint than usual for that size tire. The ply rating refers to the load the tire is capable of supporting, and isn’t necessarily equal to the actual number of plies used in the lay-up of the tire carcass. The general relationship between the number of plies and the rated load is illustrated in Figure 7.17. One may make a reasonable estimate of the tire weight, in pounds, in terms of the tire diameter dti, the tire width bti, and the number of plies Nplies by calculating the following relation:
This correlation, which is in reasonable agreement with actual tire weights, is based on the idea that the tire weight is proportional to the volume of tire material used in its construction. Using this estimate one may get an appreciation for the relationship between load-carrying capability and weight as shown in Figure 7.18.
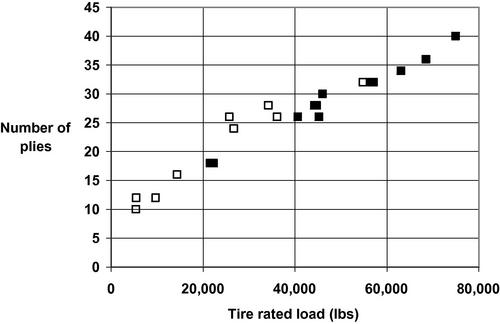
Figure 7.17 Relationship between the number of plies and the tire load rating as given by the data in Table 7.2. Closed symbols denote main gear tires and open symbols denote nose gear tires.
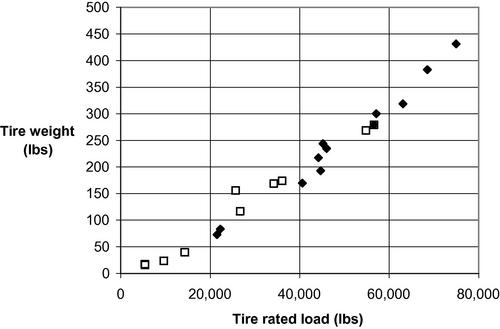
Figure 7.18 Approximate tire weight calculated using Equation (7.20) as a function of tire load rating data in Table 7.2. Closed symbols denote main gear tires and open symbols denote nose gear tires.
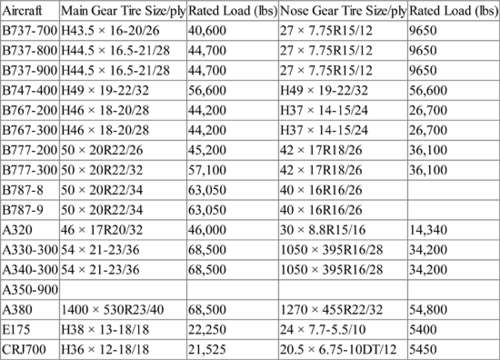
Detailed engineering data are available from tire manufacturers, e.g., Goodyear (2002) and Michelin (2012). For the example tire quoted above, the 22 ply rating indicates a maximum load-carrying capacity of 30,100 lb. If the tire is of radial construction the letter (R) appears in place of the hyphen (-) in the tire designation. Bias ply construction offers good high-speed performance and high load capacity with versatility for different runway types and a wide range of operating conditions. Radial tires have greater dimensional stability which contributes to long tire life. Radial construction generally provides more landings and reduced weight compared to radial ply tires. Typical tires used on some current airliners and their load ratings are given in Table 7.2.
Typical Tires used on some Current Airliners, from Goodyear (2002) and Michelin (2012)
| Aircraft | Main Gear Tire Size/ply | Rated Load (lbs) | Nose Gear Tire Size/ply | Rated Load (lbs) |
| B737-700 | H43.5 × 16-20/26 | 40,600 | 27 × 7.75R15/12 | 9650 |
| B737-800 | H44.5 × 16.5-21/28 | 44,700 | 27 × 7.75R15/12 | 9650 |
| B737-900 | H44.5 × 16.5-21/28 | 44,700 | 27 × 7.75R15/12 | 9650 |
| B747-400 | H49 × 19-22/32 | 56,600 | H49 × 19-22/32 | 56,600 |
| B767-200 | H46 × 18-20/28 | 44,200 | H37 × 14-15/24 | 26,700 |
| B767-300 | H46 × 18-20/28 | 44,200 | H37 × 14-15/24 | 26,700 |
| B777-200 | 50 × 20R22/26 | 45,200 | 42 × 17R18/26 | 36,100 |
| B777-300 | 50 × 20R22/32 | 57,100 | 42 × 17R18/26 | 36,100 |
| B787-8 | 50 × 20R22/34 | 63,050 | 40 × 16R16/26 | |
| B787-9 | 50 × 20R22/34 | 63,050 | 40 × 16R16/26 | |
| A320 | 46 × 17R20/32 | 46,000 | 30 × 8.8R15/16 | 14,340 |
| A330-300 | 54 × 21-23/36 | 68,500 | 1050 × 395R16/28 | 34,200 |
| A340-300 | 54 × 21-23/36 | 68,500 | 1050 × 395R16/28 | 34,200 |
| A350-900 | ||||
| A380 | 1400 × 530R23/40 | 68,500 | 1270 × 455R22/32 | 54,800 |
| E175 | H38 × 13-18/18 | 22,250 | 24 × 7.7-5.5/10 | 5400 |
| CRJ700 | H36 × 12-18/18 | 21,525 | 20.5 × 6.75-10DT/12 | 5450 |
a Metric notation given in mm except for wheel diameter, which remains in inches.
b This is an older Type VII designation where wheel diameter is not given.
c Notation DT refers to a deflector tire which has a chine molded into the shoulder of the tire to deflect runway splash away from rear-mounted engines.
The wheel diameter is also related to tire rated load, as shown in Figure 7.19. An estimate for the wheel diameter, in inches, may be made from the following relation: dw ∼ 1.4(tire rated load)1/4, where the tire rated load is in pounds. Data on wheel weights are not readily available in the open literature, but an approximation based on the tire information may be written as follows:
This estimate assumes that the wheel weight depends upon the sum of the wheel web area, which is proportional to the square of the wheel diameter dw, and the area of the wheel barrel, which is proportional to the product of the wheel circumference πdw and the tire width bti. The results given by Equation (7.21) for the aircraft tires in Table 7.2 are shown in Figure 7.20. The few data shown for reported wheel weight seem consistent with the estimates from Equation (7.21).
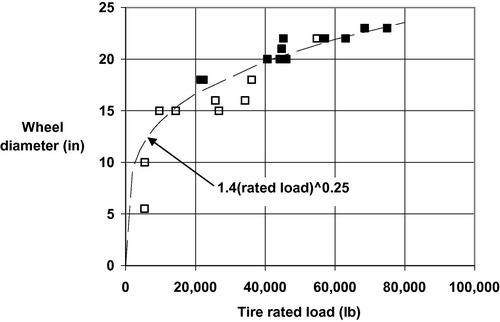
Figure 7.19 Wheel diameters as a function of tire load rating data as given in Table 7.2. Closed symbols denote main gear tires and open symbols denote nose gear tires. The dashed line represents a curve faired through the data.
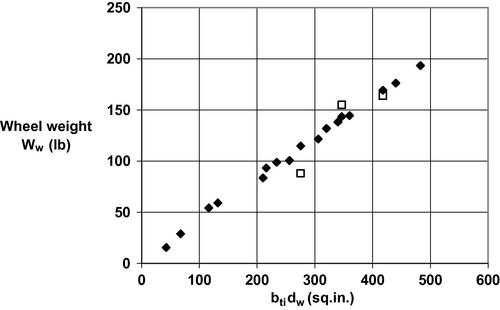
Figure 7.20 Wheel weight for the tires in Table 7.2 as a function of the product of tire width and wheel diameter as estimated by Equation (7.21) is shown by the closed symbols. The open symbols denote published data for main gear wheels.
7.3.1 Load requirements
A part 25.733 specifies that “when a landing gear axle is fitted with more than one wheel and tire assembly, such as dual or dual-tandem, each wheel must be fitted with a suitable tire of proper fit with a speed rating approved by the Administrator that is not exceeded under critical conditions, and with a load rating approved by the Administrator that is not exceeded by the loads on each main wheel tire, corresponding to the most critical combination of airplane weight (up to the maximum weight) and center of gravity position, when multiplied by a factor of 1.07.” Thus, for example, an H40 × 14.5-19 tire with a ply rating of 22, which has a maximum load of 30,100 lb, can be used to carry a maximum load of 28,131 lb, that is, 30,100 lb/1.07.
The applicable ground reactions for nose wheel tires, as given by FAA part 25.733, are as follows:
1 The static ground reaction for the tire corresponding to the most critical combination of airplane weight (up to maximum gross weight) and center of gravity position with a force of 1.0 g acting downward at the center of gravity. This load may not exceed the load rating of the tire.
2 The ground reaction of the tire corresponding to the most critical combination of airplane weight (up to maximum landing weight) and center of gravity position combined with forces of 1.0 g downward and 0.31 g forward acting at the center of gravity. The reactions in this case must be distributed to the nose and main wheels by the principles of statics with a drag reaction equal to 0.31 times the vertical load at each wheel with brakes capable of producing this ground reaction. This nose tire load may not exceed 1.5 times the load rating of the tire.
3 The ground reaction of the tire corresponding to the most critical combination of airplane weight (up to maximum gross weight) and center of gravity position combined with forces of 1.0 g downward and 0.20 g forward acting at the center of gravity. The reactions in this case must be distributed to the nose and main wheels by the principles of statics with a drag reaction equal to 0.20 times the vertical load at each wheel with brakes capable of producing this ground reaction. This nose tire load may not exceed 1.5 times the load rating of the tire.
FAA part 25.733 goes on to state that the tires must be mounted on wheels large enough to carry suitably sized brakes. In addition, for an airplane with a maximum certificated takeoff weight of more than 75,000 lbs, tires mounted on braked wheels must be inflated with dry nitrogen or other gases shown to be inert so that the gas mixture in the tire does not contain oxygen in excess of 5% by volume, unless it can be shown that the tire liner material will not produce a volatile gas when heated or that means are provided to prevent tire temperatures from reaching unsafe levels.
FAA part 25.733 also requires that each tire installed in a retractable landing gear system must, at the maximum size of the tire type expected in service, have a clearance to surrounding structure and systems that is adequate to prevent unintended contact between the tire and any part of the structure or systems. Because tires must fit within the aircraft over the life of the tire, provision must be made for their “growth” as use causes the tire carcass to stretch over time. One first calculates the grown tire envelope and then one may compute the radial clearance for a stationary and a spinning tire as well as the lateral clearance. The stowing of the main gear in the fuselage is clearly visualized in Figure 7.21 which shows a Boeing B737 model that leaves the tires and wheels exposed.
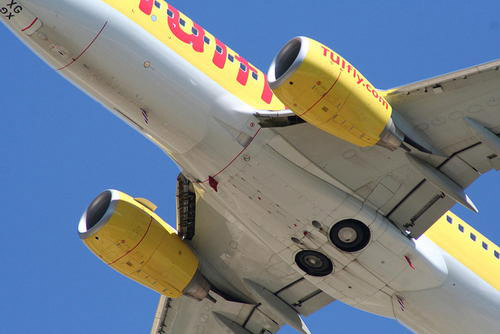
Figure 7.21 A Boeing B737 version which stows the main gear in the fuselage but leaves the wheels exposed.
7.3.2 Landing gear configurations
The relatively low load-carrying capacity of tires of a size practical for retracting into an airliner fuselage, as indicated by Table 7.2, requires the use of multiple tire and wheel assemblies. At the same time, considerations of weight, volume, and reliability favor the use of the least number of landing gear supports, or struts, typically three: the nose gear strut and the two main gear struts. Each strut of the smaller airliners carries dual wheels, such as may be seen in the photograph of a Boeing B737-300 in Figure 7.22.
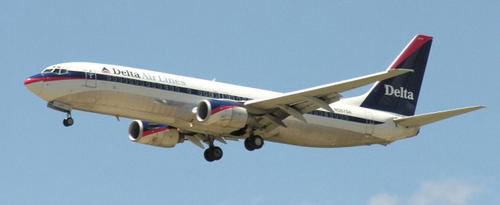
Figure 7.22 Boeing B737-300 in landing configuration illustrating dual wheels on the main and nose landing gear struts.
In order to support the load, heavier aircraft can require more than two wheels on each main gear strut, such as the four wheels in dual tandem arrangement on each main gear strut shown on the Airbus A330-300 in Figure 7.23. A wheel arrangement involving more than two wheels on a single strut is called a bogie. Larger and even heavier aircraft must resort to additional wheels as illustrated in Figure 7.24, where a Boeing 777-200ER is shown with a six-wheel bogie on each main gear strut, although the nose gear maintains a dual-wheel configuration.
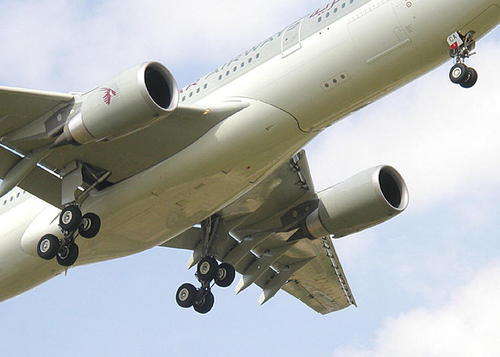
Figure 7.23 An Airbus A330-300 in landing configuration showing four wheels in a dual tandem arrangement (or bogie) on each main gear strut and a dual wheel assembly on the nose gear strut.
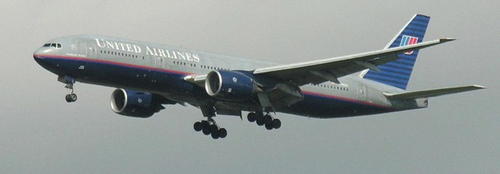
Figure 7.24 A Boeing B777-200ER in landing configuration showing four wheels in a dual tandem arrangement (or bogie) on each main gear strut and a dual wheel assembly on the nose gear strut.
The heaviest aircraft, like the Boeing B747 and the Airbus A380, employ an additional pair of main gear struts with multiple wheel bogies on each. The A380 shown in Figure 7.16 has two four-wheel bogies and two six-wheel bogies as well as the usual two-wheel nose gear. Table 7.2 indicates that the tires and wheels used on the main gear are essentially the same size as those used on the nose gear for these jumbo jets, unlike the smaller airliners for which the nose wheels and tires are usually considerably smaller than those of the main gear.
7.4 Shock absorbing landing gear struts
The dynamic loads in landing must be absorbed by the landing gear struts and tires and thereby transmitted to the airframe. The situation at the start and the end of the touchdown process is described schematically in Figure 7.25. A simplified oleo-pneumatic shock-absorbing strut is shown for clarity. The oleo-pneumatic strut combines gas compression, the pressure drop and turbulence attending the forcing of hydraulic oil through a small orifice, and the deflection of the tire in order to absorb the energy of the dropping process.
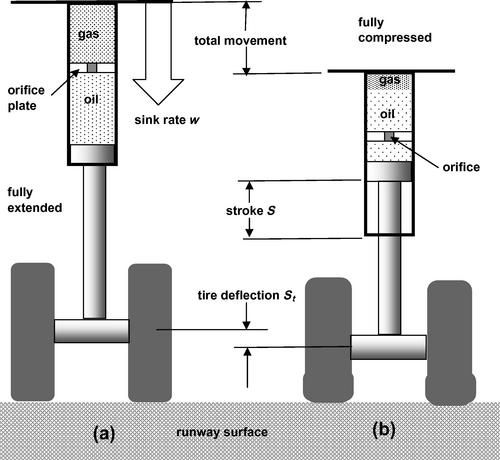
Figure 7.25 (a) The start of the touchdown process where the gear is fully extended and (b) the end of the touchdown process where the gear is fully compressed. A simplified shock-absorbing strut is shown here for clarity.
A schematic diagram of an oleo-pneumatic strut is shown in Figure 7.26. The cylinder is attached to the airframe and the outer wall of the hollow cylinder supports a bearing over which the piston can slide. The cylinder also supports an inner perforated cylindrical tube that terminates in an orifice plate. The piston is also a hollow cylinder that slides along the inner surface of the cylinder between the cylinder bearing and the orifice plate and has a bearing at its upper end. As the piston slides up from its extended position it forces oil through the orifice into the gas chamber of the cylinder thereby compressing the gas. The size of the orifice effectively determines the rate of filling of the cylinder and therefore the degree of shock absorption. Some pistons carry a cylindrical rod of variable cross-sectional area concentric with the cylinder axis. The rod, called a metering rod, changes the flow area of the orifice during the stroke to provide a desired shock absorption characteristic.
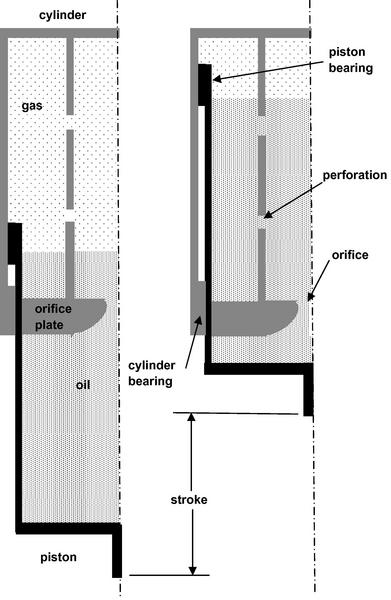
Figure 7.26 Schematic cross-sectional diagram of a typical oleo-pneumatic strut is shown in the extended position on the left and in the compressed position on the right.
The total of the kinetic and potential energy to be absorbed during the touchdown is given by
Here the velocity is reduced to 0 from initial sink rate w while the aircraft height drops by the amount S + Sti. Although some lift may be acting during touchdown, it ultimately reduces to zero as the lift dumpers, or spoilers are deployed and as the forward speed of the aircraft decreases. There is work done on the gas and hydraulic fluid in the strut and on the gas in the tire and on the deflection of its carcass. These contributions may be expressed as the product of a force, considered here to be the product of a load factor n and the weight W, and the distance through which the force travels modified by an efficiency factor for the process. For the strut the distance traveled is the stroke S and the process efficiency is η, while for the tire the distance traveled is the tire deflection Sti and the process efficiency is ηti. Such an expression may be written as follows:
Equating the change in energy to the work done yields
The stroke required is obtained from Equation (7.23) as
The FAR25.723 requires demonstration that the landing gear system of a commercial jet transport will not fail at a sink rate of w = 12 ft/s at the design landing weight. Note that this is approximately the vertical speed in approach, as discussed in Section 7.2.2. Using this value for sink rate and typical values for the efficiencies η = 0.8 and ηti = 0.5 the equation for the strut stroke becomes
We may estimate the tire deflection to be
Here dti and dw are the nominal tire and wheel diameters, respectively, as quoted by the manufacturer. Daugherty (2003) points out that statically supporting the rated load of a bias ply tire at its rated pressure will cause a deflection to approximately 35% of its available deflection before it bottoms out on the wheel, while a radial tire’s deflection is more approximately 24–33% of the available deflection. If actual tire deflection data are unavailable a reasonable approximation is given by Equation (7.35) and with typical tires and wheels 0.08 < Sti/dti < 0.09. The effect of load factor, lift to weight ratio, and tire deflection on the stroke is illustrated in Figure 7.27 for the representative case where L/W = 0.5 and the least stressing case, L/W = 1. Nominal tire and wheel diameters of 44.5 in. and 21 in., respectively, were selected as representative.
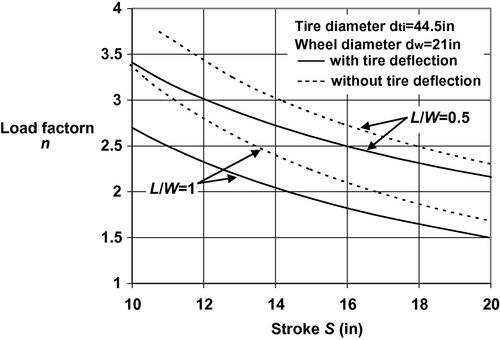
Figure 7.27 Variation of the stroke required as a function of the load factor n for the cases where L/W = 0.5 and L/W = 1 and a sink rate of 12 ft/s. The effect of tire deflection is based on representative tire and wheel diameters of 44.5 in. and 21 in., respectively.
According to Figure 7.27, the deflection response of the tires, which may have diameters in the range of 20–50 in. (see Table 7.2), decreases the stroke required of the shock strut by 10–15%. Note that the stroke doesn’t depend upon the weight of the aircraft, but mainly on the sink rate and the load factor considered. For example, a sink rate of 5 ft/s and a load factor of 1.5 would require approximately the same stroke as the case shown for a sink rate of 12 ft/s and a load factor n = 3. The difference is that the force developed in the strut F = nW = 1.5W rather than 3W. The effective pressure in the strut p = nW/A so that accepting a higher load factor requires a higher pressure in the strut or a larger piston area and therefore greater weight.
7.4.1 Sizing the landing gear struts
In normal ground handling operations, where the aircraft is nominally at rest at the static loading due to the weight of the aircraft, the pressure of the compressed gas in a strut would be about 1500 psia. Dry nitrogen is readily available commercially in standard cylinders at 2000 psia so that charging the gas side of a strut is easily carried out. The ratio of the static load pressure to the pressure in the fully extended strut is usually set at about 4. Thus, in the fully extended position the gas pressure would drop by a factor of 4, to about 375 psia. The gas compression may be considered to be a polytropic process with exponent k that is nearly isothermal (k = 1.1) and may be expressed as follows:
If we denote the hydraulic piston diameter as Ah, then υ1 = Ahl is the volume occupied by the gas when the strut is fully extended and υ2 = Ah(l − x2) is the volume occupied by the gas when the aircraft is at rest with a static load on the landing gear. These situations are shown schematically in Figure 7.28a and c. Using the nominal pressure levels described previously, p1 = 375 psia and p2 = 1500 psia, the ratio x2/l = 0.716. With the airplane at rest the force acting on the piston in the strut is Fs = p2Ah. For a given aircraft weight and center of gravity location the force on each main gear strut and on the nose wheel strut may be calculated. The maximum static main gear strut load occurs at maximum gross weight and farthest aft center of gravity. Using the static load pressure, say p2 = 1500 psia, the required piston area is Ah = Fs,max/p2.
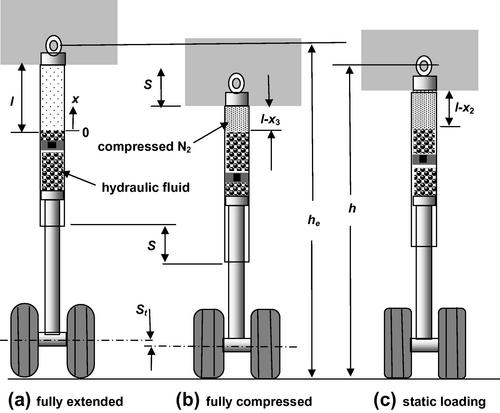
Figure 7.28 Position of the landing gear strut under (a) fully extended just at the point of touchdown, (b) fully compressed as a result of the impact at the sink rate, and (c) static loading at the gate or in slow taxiing.
In the most stressing touchdown case, that is, when L = 0, the internal force supported by the strut is nFs and therefore the pressure p3 = np2 and, for a polytropic process with exponent k, we have
Now the volume of gas υ3 = Ahl(1 − x3/l) and may be found from Equation (7.28) to be
With n = 3 the pressure p3=4500 psia and, using k = 1.1, the final volume is υ3 = 0.264Al and x3/l = 0.895. The remaining volume is available for additional compression of the gas and acts as a safety margin. In the same spirit the calculated maximum stroke is generally increased by a small amount, about an inch, to be available for overstressed situations.
One may then use Equation (7.25) to determine the stroke required for the load factor of n = 3. Figure 7.27 shows that for this load factor and the most stressing case of w = 12 ft/s and L/W = 0.5 the stroke required is approximately 12 in. Adding on an extra inch as a safety margin yields a maximum stroke of 13 in. The height of the gear in the fully compressed static condition, h in Figure 7.28c, is set by the ground clearance requirements while the height of the fully extended gear he is slightly less than h + S; the exact value can be obtained when the details of the piston motion have been collected. The outside diameter of the strut may be approximated as being 30% larger than the piston diameter so ds = 1.46Ah1/2.
An appreciation for the relative size of the tire, wheel, main gear strut, axle, and integral brake unit for a large aircraft is well illustrated in Figure 7.29. The airplane, a Lockheed Martin PC-3 Orion patrol and reconnaissance aircraft, is of substantial size, having a takeoff weight of around 140,000 lb.

Figure 7.29 Aircraft mechanics replacing a main landing gear tire on a U.S. Navy Lockheed P-3C Orion aircraft (Wto = 140,00 lb). The relative size of the tire, wheel, main gear strut, axle, and integral brake unit is well illustrated.
7.4.2 Dynamic landing gear analysis
Milwitzky and Cook (1953) carry out a detailed analysis of landing gear behavior. They consider a two-degree of freedom system where the upper mass is the aircraft and the oleo-pneumatic cylinder while the lower mass is the oleo-pneumatic piston, strut, axle, and wheel. The hydraulic fluid effectively acts as a damper and the compressed gas as a spring. Tire deflection behavior is accounted for and time histories of the motion are presented for various conditions. After evaluating the effects of the parameters involved they arrive at a simplified set of non-dimensional equations which give quite reasonable results compared to the original equations. In particular, they present a solution for the normalized maximum stroke as a function of the normalized vertical velocity that may be approximated by
Here the normalized maximum stroke of the landing gear piston is given by
The quantities ρh, Ah, and Ao denote the hydraulic fluid density, the hydraulic piston area, and the orifice area, respectively. The hydraulic fluid used in landing gear shock struts is a mineral-based fluid with a specific gravity of about 0.88. The area of the piston may be determined by the methods of the previous section. The orifice diameter is the most important independent parameter affecting the shock-absorbing capability of the landing gear strut. The discharge coefficient of the orifice is cd and for a rounded entry orifice it is reasonable to take cd = 0.9. The quantity φ is the angle the landing gear strut makes with the vertical and for commercial jet transports φ is small enough to permit the approximation cosφ ∼ 1. The quantity W is the weight carried by the strut. Therefore everything but the orifice area is known for the coefficient of the strut stroke. Using the strut stroke obtained in the previous section permits us to write the normalized stroke solely as a function of the piston orifice diameter, that is, Sn = Sn(Ao).
The non-dimensional vertical velocity is defined as
The quantity τ is a tire constant equal to the slope of the vertical force versus the tire deflection. Making a linear approximation, we may put τ ⋍ W/Sti so that the non-dimensional vertical velocity becomes
The quantity W/gA′ has the units of length and A′ has the units of mass/length. Because the tires are already selected on the basis of the load-carrying capacity required of the strut, we may write the normalized vertical velocity as a function of the piston orifice diameter alone, that is, wn = wn(Ao). We may then use this result and Sn = Sn(Ao) in Equation (7.30) to find the required orifice area Ao.
7.4.3 Landing gear strut design example
Assume that the design airplane has a gross weight of 155,000 lb, similar to that of the Boeing B737-800 listed in Table 7.1 Using the midpoints of the weight distribution approximation of Section 7.2.1, we may calculate the load on the main gear to be about 88% of the total weight and that on the nose gear to be about 12% of the weight. Assuming one main strut on each side of the aircraft, each must support 68,200 lb, while the nose gear strut must support 18,600 lb. The maximum static main gear strut load occurs at maximum gross weight and farthest aft center of gravity. Using the static load pressure, say p2 = 1500 psia, the required piston area is Ah = Fs,max/p2. Thus the area of the piston for the main gear is Ah,MG = 45.4 in.2 and for the nose gear Ah,NG = 12.4 in.2. The corresponding piston diameters are dh,MG = 7.60 in. and dh,NG = 3.97 in. The outside diameter of the strut may be approximated as being 30% larger than the piston diameter so ds,MG = 9.49 in. and ds,NG = 5.16 in.
Assuming a load factor of n = 3 one may then use Equation (7.25) to determine the stroke required. For this load factor and the most stressing case of w = 12 ft/s, Sti=0, and L = 0, the stroke required is approximately 19 in. Adding on an extra inch as a safety margin yields a maximum stroke of Smax = 20 in. The height of the gear in the static condition, h in Figure 7.28c, is set by the ground clearance requirements while the height of the fully extended gear he is slightly less than h + S; the exact value can be obtained when the details of the piston motion have been collected. At this stage of the design we do not yet know the exact location of either the landing gear or the center of gravity of the airplane. However, we may start by using estimates given in Table 7.1 and choose the value given for the B737-800, that is, hoe/lwb = 0.18 and lwb = 57 ft, resulting in a center of gravity location hoe = 9.8 ft. Based on three-view drawings and photographs of the aircraft listed in Table 7.1 we may estimate the static height of both the main and nose gear to be approximately 2 < h/dti < 3.
The dynamics of the landing gear operation were discussed in Section 7.4.2 and we may first determine the normalized stroke given in Equation (7.31). Using the assumptions described in Section 7.4.2 we may write the product Ag in Equation (7.31) as follows:
The normalized maximum stroke in Equation (7.31) may then be written as
In the same manner we may write the normalized velocity of Equation (7.33) as follows:
Substituting for Sn,max and wn in Equation (7.30) and solving for the effective orifice area yields
The numerical coefficients shown assume lengths in ft, areas in ft2, and weights in lb. We determined that for a load W = Fs,max = 68,200 lb on a main gear strut the area of the piston for that strut is Ah,MG = 45.4 in.2 = 0.315 ft2. Similarly, with load W = Fs,max = 18,600 lb on the nose gear strut the area of the piston for that strut is Ah,NG = 12.4 in.2 = 0.086 ft2. We also found, from our previous calculation using Equation (7.25) that for a sink rate of wo = 12 ft/s and a load factor n = 3 the stroke required was 20 in. = 1.67 ft. This leads to the result that Ao,MG = 0.0051/dti0.345 and Ao,NG = 0.0014/dti0.345. The tire sizes are not yet known, though they will be considered in a subsequent section. We may use the tire sizes for the B737-800 from Table 7.2 to finish the calculation of the oleo strut orifice sizes: main gear dti,MG = 44.5 in. = 3.71 ft and nose gear dti,NG = 27 in. = 2.25 ft. Thus, Ao,MG = 0.0051/dti0.345 = 0.0032 ft2 = 0.467 in.2 and the diameter of the orifice is do,MG = 0.77 in. Finally, Ao,NG = 0.0014/dti0.345 = 0.00106 ft2 = 0.152 in.2 and the diameter of the orifice is doNG = 0.44 in.
The landing gear struts are typically made of high-strength steel and the associated structure may be roughly approximated by considering the weight of a solid piece of steel of length h ∼ 2dti and the corresponding calculated diameter. In this case each of the main gear strut assemblies would have h = 2dti,MG = 89 in. and ds,MG = 9.49 in. so that WMG = 3.64 ft3(489 lb/ft3) = 1780 lb. The nose gear h = 2dti,NG = 54 in. and ds,NG = 5.16 in. so that WNG = 0.648 ft3(489 lb/ft3) = 317 lb. The total weight of the strut assemblies is therefore about 3,880 lb. As efforts to reduce weight escalate there is an increasing interest in expanding the use of titanium as well as composite materials in landing gear components.
A schematic diagram of one of the main gear assemblies developed in this section, drawn approximately to scale, is shown in Figure 7.30. A similar figure would be drawn for the nose gear. During retraction of the main gear the strut pivots about the trunnion and is drawn into the fuselage whereupon the landing gear doors are closed. Further details about landing gear retraction are described in Section 7.6.
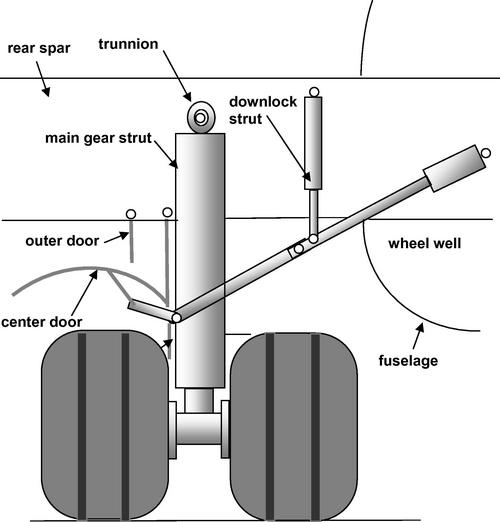
Figure 7.30 A schematic diagram of one of the main gear assemblies for the design example is shown, drawn approximately to scale.
7.5 Landing gear brake systems
The major portion of the deceleration of the aircraft is borne by the wheel brakes. Yetter (1995) indicates that airlines typically use thrust reversers on all landings, but their greatest contribution is in landings on wet or icy runways. Aerodynamic drag also accounts for some deceleration, but its magnitude drops off as the square of the velocity, which is already at a low level in terminal operations. Therefore, it is the wheel brakes that bear the brunt of the burden of stopping the aircraft safely in a reasonable distance. The brakes are applied once the aircraft is on the ground and they transform the kinetic energy Ek of the aircraft into heat Q which must be safely dissipated. The most stressing case is that of a refused takeoff where the aircraft is at about its maximum weight, Wto ⋍ Wg, and at the critical velocity, typically 90% of the takeoff velocity. If instead of the critical velocity we take the more conservative case of V = Vto, the kinetic energy of the aircraft is
This may also be written as
A nominal case for a jet transport taking off at sea level with a wing loading of 125 lb/ft2 and maximum lift coefficient of 2.5 has a kinetic energy of about Ek = 941Wto ft-lb or about Ek = 1.21Wto Btu. The equivalent of this energy in heat Q must be dissipated by the brakes during the time of the braking process without excessive temperature buildup in the brakes, wheels, and tires.
The simplest heat transfer situation is that in which the thermal conductivity κ of the material is very high, that is, the thermally diffusivity κ/ρcp ≫ 1, such that heat passes so rapidly through the solid material that the temperature is essentially spatially uniform but varying with time. Assuming that an amount of heat Q is generated within the mass of the brake unit over the braking time interval Δtb, the thermal conduction equation reduces to
Setting Q = Ek = (W/g)(V2/2) in Equation (7.36) leads to the following result for the bulk temperature of the brake material:
The total weight of brake material available in the brake assembly needed to absorb all the heat and rise to a final allowable brake temperature Tb is
Characteristics of some brake materials are shown in Table 7.3. From the standpoint of brake assembly weight Wb, materials with the highest heat capacity cp are to be favored, and this suggests the use of carbon or beryllium. However, because the brakes must be contained within the confines of the wheel, the volume of brake material required is also of importance. In that case, materials with the highest heat capacity per unit volume, ρcp, are attractive, and that favors the use of steel. From the standpoint of high temperature capability all those mentioned in Table 7.3 are acceptable. However, steel brakes are the least expensive, while beryllium is expensive, as well as being a toxic material. Carbon brake material has become more popular in recent years as costs have been reduced. One must also consider the wear characteristics as part of the economic issue and carbon brakes tend to last longer.
Properties of Several Brake Materials
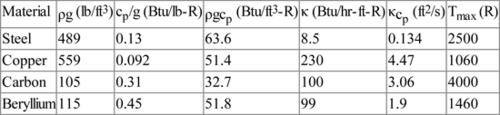
| Material | ρg (lb/ft3) | cp/g (Btu/lb-R) | ρgcp (Btu/ft3-R) | κ (Btu/hr-ft-R) | κcp (ft2/s) | Tmax (R) |
| Steel | 489 | 0.13 | 63.6 | 8.5 | 0.134 | 2500 |
| Copper | 559 | 0.092 | 51.4 | 230 | 4.47 | 1060 |
| Carbon | 105 | 0.31 | 32.7 | 100 | 3.06 | 4000 |
| Beryllium | 115 | 0.45 | 51.8 | 99 | 1.9 | 1460 |
As may be seen in Table 7.3, carbon brake material is low in weight and high in thermal conductivity and specific heat. In addition, the wear characteristics of carbon brakes provide more landings between overhauls than do steel brakes and this makes the life cycle costs of carbon brakes comparable to those of steel brakes. They are basic equipment on new aircraft like the Boeing B787 and may be retro-fitted to older aircraft. Steel brake wear is proportional to the kinetic energy absorbed by the brakes. Therefore, steel brake life is extended by light brake applications with time for cooling between each application. On the other hand, carbon brake wear mainly depends on the number of brake applications so that fewer, but firmer, brake applications help reduce wear.
Equation (7.38) shows that the higher the brake temperature is permitted to be, the lower the brake weight. However, there are other issues to be considered, particularly safety, reliability, and economics, and satisfying them favors lower brake temperatures. A realistic engineering compromise must be met to allow for a design of practical weight. The deciding factor is the allowable brake temperature, which may be permitted to be close to the maximum allowable temperature for the brake material or the surrounding structure, wheels, and tires, whichever is lower. In the case of steel brakes a temperature around 2300R (1840 F or 1000 °C), which is close to the maximum given in Table 7.3, can be acceptable for a one-time emergency application like a rejected takeoff at maximum gross weight. A relatively low temperature of around 1400R (940 F or 500 °C) should be acceptable for regular service. An intermediate temperature of about 1900R (1440 F or 780 °C) is likely to safely accommodate several high deceleration stops at the maximum landing weight. Using these guidelines, a plot of the weight of steel brake assemblies is shown in Figure 7.31 as a function of the kinetic energy that must be dissipated as heat. Also indicated on the plot are the intersection points of three levels of kinetic energy with the three brake temperature curves mentioned previously. The intersection points show three different required weights and one would have to choose the heaviest among them, that is, the 325 lb assembly, to assure safety. The kinetic energy levels shown in Figure 7.31 are those associated with different braking conditions for a B737-800 steel heat sink brake assembly weighing 363.4 lb described in Honeywell (2008).
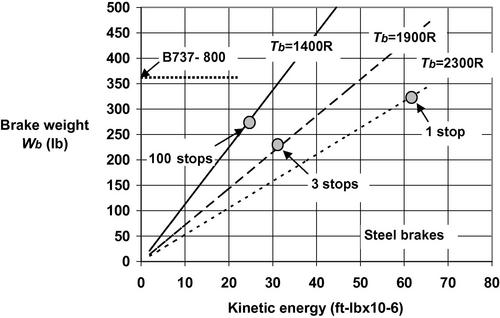
Figure 7.31 Weight of steel brake assemblies required is shown as a function of the kinetic energy that must be dissipated as heat for three levels of brake temperature Tb. Also shown are predicted values for three levels of usage.
The use of carbon brake material leads to the results shown in Figure 7.32. It is clear that for the same conditions the weight of the brake assembly is about 150 lb, less than half that of the steel brakes described previously. It would seem that carbon would be the material of choice, but the volume occupied by the weight of carbon heat sink material is about twice that needed for steel brake assemblies as shown in Figure 7.33, which assumes the most stressing case of a rejected takeoff, that is, Tb = 2300R.
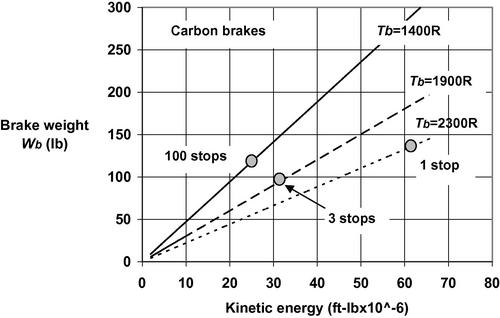
Figure 7.32 Weight of carbon brake assemblies required is shown as a function of the kinetic energy that must be dissipated as heat for three levels of brake temperature Tb. Also shown are predicted values for three levels of usage.
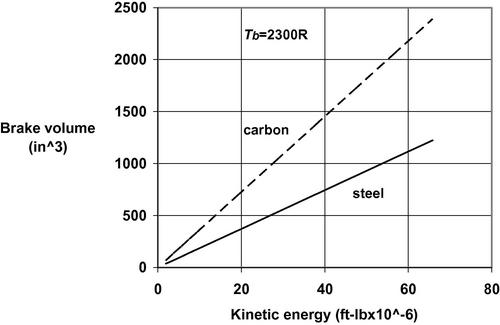
Figure 7.33 The volume of brake material, steel or carbon, required to keep the brake temperature to a maximum of 2300R (1840 F) or 1278K (1005 °C), is shown as a function of kinetic energy that must be dissipated.
It is apparent that carbon brake material requires more space than steel brake material for the same performance. This volume of material is distributed among the individual wheels and is generally confined within a circular cylindrical space of diameter less than that of the wheel diameter dw and a length lb so that appropriate account of the space available is required. A schematic diagram of the brake assembly nested within the wheel drum is given in Figure 7.34. One part of a typical brake is comprised of a series of rotor disks attached to a wheel shaft on which they rotate, together with the wheel. The other part is a set of stator disks which are attached to the brake housing which, in turn, is attached to the landing gear strut by a backing plate. A piston assembly forces the rotor and stator disk to rub against one another to dissipate the kinetic energy of the rotating wheel. The photograph in Figure 7.29 shows the compact brake assembly clearly. More detail regarding the configuration of a brake assembly is given by Curry (1988).
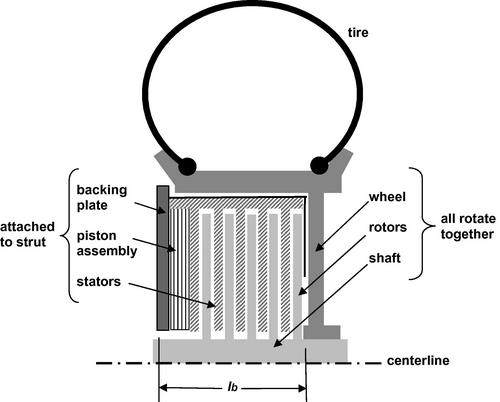
Figure 7.34 Schematic cross-sectional diagram of brake assembly nested in wheel drum showing the nominal brake length lb.
The volume available for the compact brake system is essentially that within the wheel drum and therefore is proportional to the square of the wheel diameter. An approximate relation for the data presented by Curry (1988) for the available cross-sectional area is
The area Aavail and wheel diameter dw given in Equation (7.39) are in square inches and inches, respectively. Considering the brake assembly to be an annular cylinder with cross-sectional area Aavail and length lb the brake material volume is υb = Aavaillb. Using Equation (7.39) we may find the total length of the brake assembly, lb, which is illustrated in Figure 7.34, required for a given wheel as follows:
To gain an idea of the dimensions of the brake assembly, consider the case of a rejected takeoff where about 60 million ft-lb of kinetic energy must be dissipated. For a steel brake Figure 7.31 suggests about 1150 in.3 of brake heat sink material is required. For a typical wheel of a B737, which is about 20 in. diameter, Equation (7.40) suggests that the length of the brake lb should be about 8.85 in. This is reasonably consistent with an actual B737 brake, as described in Honeywell (2008). The volumetric heat capacity of carbon, as illustrated in Table 7.3, is only 51.4% that of steel so that carbon brakes require 94.5% more volume for equivalent thermal performance and the required volume, from Figure 7.33, is about 2200 in.3 Because the available cross-sectional area of the brake is dependent only on the wheel diameter, the length of the multiple disk carbon brake assembly would be 17.2 in. for the B737-like case being examined. Another advantage of carbon brakes is the higher temperature capability, which may be employed to reduce weight and therefore required volume. Of course, final dimensions are dependent on detail design issues, but it should be clear that the substantial weight savings accruing to carbon brakes come at a price in volume as well as initial cost.
7.5.1 Tire, wheel, and brake selection example
Assume that the design airplane has a gross weight of 155,000 lb, similar to that of the Boeing B737-800 listed in Table 7.1. Using the midpoints of the weight distribution approximation of Section 7.2.1, we may calculate the load on the main gear to be about 88% of the total weight and that on the nose gear to be about 12% of the weight. Assuming one main strut on each side of the aircraft, each must support 68,200 lb, while the nose gear strut must support 18,600 lb. We consider each strut to carry at least two wheels so that the load on each main gear tire is 34,100 lb and on each nose gear tire 9300 lb. According to the FAA requirements discussed in Section 7.3.1, the main gear tires load rating should be at least 107% of the maximum load to be carried. Thus the tire rating for the main gear should be at least 36,500 lb. Examining Figure 7.17a we see that the main gear tires should have a ply rating of at least 24. Specifying a greater number of plies must be done with caution because Figure 7.17b shows that the weight of the tire increases essentially linearly with the rated load, and therefore the number of plies. Based on the data shown in Figure 17.18 the wheel diameter should be around 25 in. Then we may consult a tire handbook for a tire that is approximately of the size dti × bti-20/24 with a rated load of at least 36,500 lb. Goodyear (2002) shows an H44.5 × 16.5-20/24 which has a rated load of 36,200 lb, which is 300 lb shy of the required value. Moving up to an H44.5 × 16.5-20/26 tire provides a rated load of 39,600 lb and would weigh, according to Equation (7.20), 178 lb. The wheel diameter is 20 in. and the width of the wheel between the flanges which support the tire is 10.5 in. This dimension will be important for housing the necessary brake size which will be determined subsequently. According to Equation (7.21) this wheel would weigh 135 lb. There are other combinations that will meet the load rating requirement, but at this stage the selected tire and wheel will be adequate. Note that Table 7.2 shows that the B737-800 typically uses an H44.5 × 16.58-21/28 tire, which has a rated load of 44,700 lb.
The FAA load requirements on nose gear tires were outlined in Section 7.3.1. The nose gear static load is 18,600 lb so that with two wheels each must support 9300 lb. FAR25.731 requires that this load not exceed the rating of the tire. From the dynamic load requirements discussed in Section 7.3.1 we know that the nose gear load under braking must not exceed 1.5 times the load rating of the tires. At this stage of the design we do not know the exact location of either the landing gear or the center of gravity of the airplane. Therefore we may start by using the estimates given in Section 7.2.1 and the data in Table 7.1 and find that (xMG − xoe)/lwb ∼ 1/8 and hoe/lwb = 1/5.
First, for the case of a maximum ramp, or gross weight of 155,000 lb Equation (7.9) yields
In the case of maximum landing weight, FAR25.731 requires a/g = 0.21, and therefore FNG = 25,900 lb. Thus each tire is subjected to a dynamic load of 12,950 lb and this may not exceed 1.5 times the tire rated load. Therefore the load rating of the tire must exceed 8,633 lb. Second, we consider the case of maximum landing weight, which may be approximated using the correlation shown in Chapter 4, Figure 4.7:
Assuming, as usual, that gross weight and takeoff weight are approximately equal, we find the maximum landing weight for the design aircraft to be about 130,000 lb and therefore Equation (7.9) becomes
In the case of maximum landing weight, FAR25.731 requires a/g = 0.31, for which FNG = 24,310 lb so that each tire is subjected to 12,160 lb and therefore the load rating of the tire must exceed 8100 lb.
Recall that under the static loading condition the nose wheel tire load rating must be greater than 9300 lb and this is greater than the mandates under dynamic loading conditions. Therefore we may seek nose gear tires that are rated above 9300 lb. From Figure 7.17 we see that a tire with a 12 ply rating, or better, is suggested. Using the correlation in Figure 7.18 a wheel diameter of dw = 1.4(9300)0.25 = 13.75 in. is calculated. We are therefore searching for a tire of approximate size dti × wti − 14/12 that has a rated load greater than 9300 lb. Goodyear (2002) shows a 26.5 × 8.0-13/12 tire with a rated load of 9475 lb and a weight, according to Equation (7.20), of 24 lb. The 13 in. wheel has a width between flanges of 6.5 in. and according to Equation (7.21) this wheel would weigh 46 lb. Note that Table 7.2 shows the B737-800 using a nose wheel tire of size 27 × 7.75R15/12 with a rated load of 9650 lb. This is a radial ply tire which would also satisfy the requirement.
In considering the brake requirements we note that the nose wheels generally carry no brakes because their application would increase the structural load on the nose gear strut. Furthermore they only support about 12% of the weight of the aircraft and thus handle the same small fraction of the kinetic energy dissipation. Therefore, the main gear brakes are sized to accommodate the entire braking requirement. Solving Equation (7.39) for the available cross-sectional brake area for one 20 in. wheel yields Aavail = 135.6 in.2 For a rejected takeoff speed of about 190 kts and a maximum weight of 155,000 lb the kinetic energy to be dissipated is about 248 million ft-lb. Using Equation (7.38) for a maximum brake temperature of 2300R yields the required total brake weight for steel to be Wb = 1380 lb and therefore each of the four wheel brakes weighs 345 lb. Each brake requires a volume of about 0.706 ft3 = 1220 in.3. The required brake unit length is therefore lb = υ/Aavail = 1070 in.3/135.6 in.2 = 9.00 in. The width between the flanges of a 20 in. wheel is about 10.5 in., which suggests that there is sufficient room for a steel brake system to be at least partially shrouded by those wheels. A carbon brake unit for one main gear wheel weighs less than half that of a steel brake unit, about 176 lb as opposed to 345 lb. Carbon brakes, on the other hand, require about twice as much brake volume and therefore the brake unit length would be approximately 17.5 in., unless higher temperatures can be safely used.
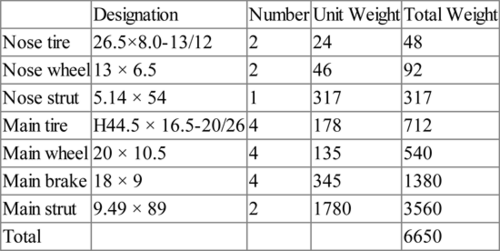
The results for the landing gear components designed in Section 7.4.3 and the brake system designed in this section are collected in Table 7.4. The landing gear weight as calculated here is about 4.3% of the maximum gross weight, which is consistent with typical commercial airliner data, as will be discussed in Chapter 8.
Design Example Landing Gear Components
| Designation | Number | Unit Weight | Total Weight | |
| Nose tire | 26.5×8.0-13/12 | 2 | 24 | 48 |
| Nose wheel | 13 × 6.5 | 2 | 46 | 92 |
| Nose strut | 5.14 × 54 | 1 | 317 | 317 |
| Main tire | H44.5 × 16.5-20/26 | 4 | 178 | 712 |
| Main wheel | 20 × 10.5 | 4 | 135 | 540 |
| Main brake | 18 × 9 | 4 | 345 | 1380 |
| Main strut | 9.49 × 89 | 2 | 1780 | 3560 |
| Total | 6650 |
7.6 Landing gear retraction
The landing gear struts transmit their load to the airframe through the trunnion mounted on the rear spar of the wing and pivot about the trunnion for stowage within the wing and fuselage, as shown in Figure 7.35. Landing retraction mechanisms are often quite different in configuration, as can be seen in Figures 7.16 and 7.21–7.24, but are usually based on the four-bar linkage of kinematics. The schematic diagram in Figure 7.35 is presented to provide a general idea of the landing gear arrangement in the down and stowed positions.
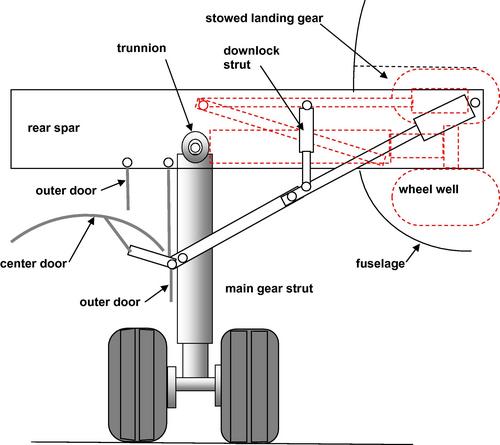
Figure 7.35 A schematic diagram of the general arrangement of landing gear components in the down and in the stowed positions (dashed lines).
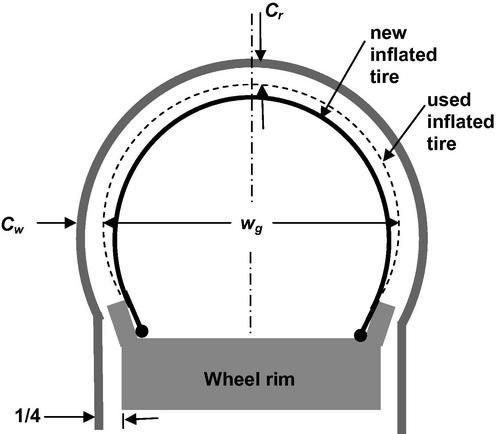
Clearance must be allowanced between the tires and nearby components or housings. The maximum overall tire dimensions given in the manufacturer’s tire data tables must include a growth allowance due to use. In the case of a rotating tire allowance must be made for the diameter increase due to centrifugal force. Clearances between the tire and adjacent parts of the aircraft are determined by first computing the new tire envelope due to service according to the manufacturer’s specifications. The new envelope is denoted by the dashed line called the used inflated tire in Figure 7.36. This expanded outer envelope of the tire is usually called the “grown” tire. The lateral clearance denoted by Cw may be found from the equation
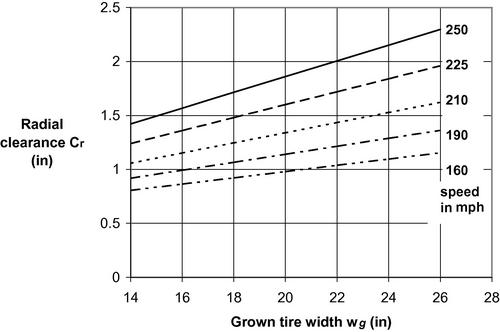
This side clearance is given in inches, as is the width of the grown tire, wg. The radial clearance depends upon the speed of the aircraft and the size of the tire and is shown in Figure 7.37 for rolling speeds up to 250 mph.
7.7 Design summary
Using the configuration drawings and weight information for the design aircraft the landing gear layout and specifications can be estimated. The exact location of the wing on the fuselage will be determined after a refined weight estimate and center of gravity location is carried out as described in Chapter 8. However, using an estimated longitudinal center of gravity location of xcg/lf = 0.44 for aircraft with wing-mounted engines and xcg/lf = 0.42 for aircraft with fuselage-mounted engines one may use the methods of Section 7.2 to find the quasi-static loads which must be supported by the main and nose gear. Continuing with the methods of that section and the aircraft database of Table 7.1 one may find the dynamic load on the nose gear, approximately locate the main and nose gear so as to avoid the turnover condition, and determine the required ground clearance in pitch and roll for takeoff and landing. The provisional position of the main and nose gear may be shown on a planform view of the design aircraft, as illustrated in Figure 7.13, and the maneuverability in ground operations may be demonstrated.
Having determined the loads on the landing gear, the methods of Section 7.3 are used to specify the tires and wheels appropriate for the design aircraft. Then the landing gear struts may be sized as well as the necessary braking system. When estimating landing gear height, note that the extended height he of the main gear must be less than half the track so that the gear may be stowed within the fuselage. This is best illustrated by Figure 7.19 where it is clear that there is a noticeable distance between the stowed tires. The total weight of the landing gear system can then be developed and presented as in Table 7.4.
Knowing the layout and dimensions of the landing gear, provisions for retracting the landing gear into the fuselage may be determined. A scaled diagram, like that in Figure 7.35, can show the vertical location of the wing with respect to the fuselage, the location of the trunnion pivot on the rear spar of the wing, and the wheel well sufficient in size to accept the wheels upon retraction.
7.8 Nomenclature
A orifice area
A′ coefficient defined in Equation (7.31)
Ah hydraulic piston cross-sectional area
a acceleration or lift curve slope
b wingspan or width
CL lift coefficient
Cw lateral tire clearance
Cr radial tire clearance
cd orifice discharge coefficient
cp specific heat
D drag
Ek energy
e extension
F force
g acceleration of gravity
h height
k polytropic exponent
L lift
l length
la see Figure 7.10
lb see Figure 7.10
m mass
N number
n load factor
p pressure
Q heat
r radius
S stroke or wing planform area
Sn normalized piston stroke, Equation (7.31)
T temperature
t time
V velocity
W weight
Wk work
w vertical velocity or tire width
wn normalized vertical velocity, Equation (7.32)
wg width of grown tire
x longitudinal distance
α angle of attack
β angle defined by arctan(lt/2lwb)
δ vertical distance between CG and line of action of Frev
Γ wing dihedral angle
γ flight path angle
κ thermal conductivity
ρ density
η strut compression efficiency
ηt tire compression efficiency
Λ sweepback angle
φ roll angle
θ pitch angle
σ stress or atmospheric density ratio
ψ turnover angle, Equation (7.11)
τ tire constant, see Equation (7.32)
χ steering angle
7.8.1 Subscripts
a approach
b brake
cg center of gravity
f fuselage
MG main gear
max maximum
n normal
NG nose gear
plies tire plies
oe operating empty
off tires just off the ground
r reverse
s strut
st static conditions
t track
td touchdown
ti tire
to turnover or takeoff
w wheel
wb wheelbase
wt wingtip
180 180° turn
References
1. Curry NS. Aircraft Landing Gear Design: Principles and Practices. Reston, VA: American Institute of Aeronautics and Astronautics; 1988.
2. Daugherty, R.H., 2003. A Study of the Mechanical Properties of Modern Radial Aircraft Tires, NASA TM-2003-212415.
3. Flottau, J., Norris, G., 2012. In Sync. Aviation Week & Space Technology, July 16, pp. 26–27.
4. Goodyear, 2002. Goodyear Aircraft Tire Data Book, Goodyear Aviation Tires, Akron, OH, <www.goodyearaviation.com>![]() .
.
5. Honeywell, 2008. Boeing 737NG Wheel and Cerametalix Brake, Honeywell Aerospace C61–0810-000-000.
6. Jackson P, ed. Jane’s All the World’s Aircraft 2009–2010. Coulsdon, Surrey, UK: IHS (Global) Ltd.; 2010
7. Michelin, 2012. Michelin Aircraft Tires, <www.airmichelin.com>![]() .
.
8. Milwitzky, B., Cook, F.E. 1953. Analysis of Landing Gear Behavior, NACA Report 1154.
9. Torenbeek E. Synthesis of Subsonic Aircraft Design. Dordrecht, The Netherlands: Kluwer Academic Press; 1982.
10. Wall, R., 2012. Taxi Electric. Aviation Week & Space Technology, February 27, pp. 47–48.
11. Yetter, J.A., 1995. Why Do Airlines Want and Use Thrust Reversers? NASA Technical Memorandum 109158.