
Preliminary Weight Estimation
Abstract
Methods for performing a preliminary weight estimate for the proposed aircraft are covered, illustrating how the aircraft is sized in terms of total weight, empty weight, fuel weight, number of passengers, etc. The mission specification and the profile of the individual flight segments are described in detail. Analytical techniques and historical correlation methods for estimating the various weight components including gross, takeoff, and operating empty weights, passenger and crew weights, cargo weight, and fuel weight are described. Determination of fuel consumption in each of the mission segments is discussed. Selection of desirable cruise performance characteristics, illustration of empty weight trends, characteristics of jet fuel, estimation of the takeoff and empty weights of turbofan-powered aircraft, and new materials for weight reduction are considered. Similar weight estimation procedures are presented for turboprop-powered aircraft including fuel weight and empty weight estimation for turboprop airliners.
Keywords
Preliminary weight estimation
Fuel weight
Take off weight
Empty weight
Jet fuel
Cruise performance
Turbofan and turboprop aircraft
2.1 The mission specification
The basic mission specifies that an airplane be designed to carry NP passengers at a cruising speed of V nautical miles per hour (knots) over a range of R nautical miles using turboprop or turbofan engines. This specification actually contains all the major economic information which will decide whether or not a particular commercial design will be successful. The airplane itself will have an empty weight We which may be thought of as the “showroom” weight at the time of purchase. This is the weight of the aircraft that the original equipment manufacturer (OEM) presents to the buyer, which, as we shall see in Chapter 11, is proportional to the capital cost of the airplane to the buyer. On the other hand, the operating cost, i.e., the expense incurred by the operator in flying the airplane, is made up of several parts including fuel expense, crew expense, and maintenance expense. The first item is a function of airplane design and engine performance while the last two items are influenced by FAA requirements and tend to be dependent on the size of the airplane. As mentioned in the previous chapter, fuel has become the major operating expense item for airline operators. Therefore, at this first step in the design process, major attention will be paid to determining the amount of fuel necessary to operate the airplane in accomplishing the mission specification safely. This is readily expressed as Wf, the weight of fuel which must be carried by the airplane. Finally, there is the positive factor of income generation by the airplane which is accomplished by charging a fee for each passenger. The transport of cargo by the aircraft is also a source of revenue for the operator and passenger aircraft usually have cargo space for freight in addition to the baggage requirements of the passengers. Of course, there are freighter aircraft dedicated solely to carrying cargo for revenue. These aircraft are either converted passenger aircraft or derivatives of passenger aircraft. The carriage of passengers and/or cargo constitutes the payload weight Wpl. This is the portion of the aircraft weight which contributes revenue and is proportional to the number of passengers that can be accommodated, Np.
As pointed out in USDOT (2004), accurately calculating an aircraft’s weight and center of gravity location before flight is essential to comply with the FAA certification limits established for the aircraft. These limits specifically include both weight and center of gravity location. By complying with these limits and operating under the procedures established by the airplane manufacturer, an operator is able to meet the weight and balance requirements specified in the aircraft flight manual. Typically, an operator calculates takeoff weight by adding the operational empty weight of the aircraft, the weight of the passenger and cargo payload, and the weight of fuel. The objective is to calculate the takeoff weight and center of gravity location of an aircraft as accurately as possible so as to ensure safe operation. In this chapter we will form a preliminary estimate of the maximum gross weight of the aircraft and the contributions to that weight from various components.
2.2 The mission profile
It is useful to consider the flight to progress as a series of distinct segments: engine start and warm-up, taxi, take off, climb, cruise to full range, 1 h additional flight at cruise conditions, descent to destination and refused landing, climb, diversion to alternate airport 200 nautical miles distant, descent, landing. These stages are numbered and appear in Figure 2.1 and Table 2.1.
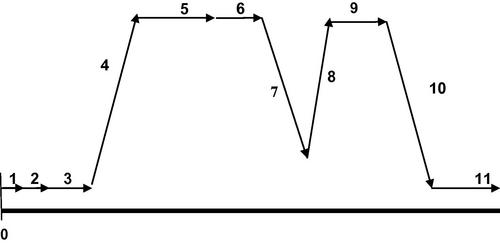
Figure 2.1 Mission profile showing the 11 flight stages for a domestic flight (R < 3000 nm). International flights have an additional segment between 10 and 11 calling for a 30 min hold at 15,000 ft altitude and segment 6 is calculated at 10% of the normal cruise time, rather than a blanket 1 h.
Mission Segments
| Segment | Description |
| 1 | Engine start and warm-up |
| 2 | Taxi |
| 3 | Takeoff |
| 4 | Climb |
| 5 | Cruise to full range |
| 6a | Additional flight time at cruise conditions |
| 7a | Descent to destination and refused landing |
| 8a | Climb |
| 9a,b | Diversion to alternate airport 200 nm distant |
| 10 | Descent |
| 11 | Landing |
a Denotes flight diversion stages requiring reserve fuel.
b International flights include hold time at the alternate airport.
The normal flight plan starts at 0 with the aircraft standing at the gate, fueled and boarded and ready to push back and begin taxiing to the runway. The flight plan then proceeds through stages 1–5 plus stages 10 and 11, while stages 6–9 represent possible flight diversions due to poor weather or other such situations. These extra stages require the use of the reserve fuel which must always be carried by the aircraft. Operational rules for determining fuel reserve requirements are set by the airline operator to equal or exceed the reserves required by the FAA. The notional mission profile shown in Figure 2.1 is based on general operational rules suggested in ATA (1967). The Air Transportation Association of America (ATA) is now Airlines for America (A4A).
2.3 Weight components
There are many weight definitions that appear in the description of aircraft operations and they are not always entirely consistent between manufacturers, operators, and regulators. We will attempt to keep to the minimum number of weight classifications necessary for carrying out the design process.
2.3.1 Gross, takeoff, and operating empty weights
At the start of the mission the total weight of the aircraft W0 is often called the maximum gross weight of the aircraft, Wg,max, and may be written as the sum of the major weight components as follows:
After taxiing and waiting in a queue for permission to take off some fuel will have been used and the aircraft weight has diminished. When calculating takeoff performance the aircraft is considered to be at the takeoff weight Wto, which is defined as the weight of the aircraft at the point of the start of the takeoff ground roll. The difference between the maximum gross and takeoff weights is typically around 2%. Though imprecise, it is common for Wg,max and Wto to be used interchangeably in the literature. During the remainder of the flight more fuel will be used until finally the aircraft will touch down at landing weight Wl. These weights are mentioned here because they generally will have maximum values that are not to be exceeded and these values can be determined for a given aircraft. Of course, other weight definitions arise and they will be treated in subsequent sections as they arise.
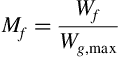
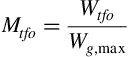
The fuel weight Wf and the payload weight Wpl appearing in Equation (2.1) have been broadly defined previously and it only remains to define the operating empty weight Woe of the airplane as follows:
![]()
The operating empty weight of the airplane is the weight of the airplane in a condition ready to fly, but with no fuel or payload yet taken on board. It therefore includes the empty weight of the airplane We, the weight of the trapped fuel and oil (that is, the fuel and oil left in lines and at the bottom of tanks, etc., and therefore necessary but unusable) Wtfo, and the weight of the crew, Wc. This last term includes the weight of the flight crew, the flight attendants, and all their baggage and this may be determined by the methods described in the following Section 2.3.2.
2.3.2 Passenger and crew weights
The US Department of Transportation in USDOT (2004) gives a chart for estimating the average weight of passengers, and it is reproduced here as Table 2.2. As reported in USDOT (2004), the average passenger weights in Table 2.2 include a 16-pound allowance for personal items and carry-on bags, based on the assumption that:
(a) One-third of passengers carry one personal item and one carry-on bag.
(b) One-third of passengers carry one personal item or carry-on bag.
(c) One-third of passengers carry neither a personal item nor a carry-on bag.
(d) The average weight allowance of a personal item or a carry-on bag is 16 pounds.
Standard Average Passenger Weights from USDOT (2004)
| Standard Average Passenger Weight | Weight per Passenger (lb) | |
| Summer weights | ||
| Average adult passenger weight | 190 | |
| Average adult male | 200 | |
| Average adult female | 179 | |
| Average child (2–13 years old) | 82 | |
| Winter weights | ||
| Average adult passenger | 195 | |
| Average adult male | 205 | |
| Average adult female | 184 | |
| Average child (2–13 years old) | 87 | |
Standard average weights for checked bags should be at least 30 pounds. It is reasonable to assume that the one-third of passengers that carry neither a personal item nor a carry-on bag [item (c) above], will have checked a bag.
The number of crew members is usually set by the operator, observing the minimum requirements stipulated by the FAA, while the baggage allowance is set by the operator. The USDOT (2004) gives a chart for estimating the average weight of crew members and their baggage and it is given here as Table 2.3. When the number of crew members is determined, their total weight may be found by using this table. Consideration of the weight of additional payload in the form of cargo freight will be given subsequently. The number of pilots is typically two, with a third pilot required for flights that are likely to last more than 8 h, and these are typically international flights. For ultra-long-duration flights, which are 12 or more hours in duration, four pilots will be necessary. In addition, rest areas for the flight deck officers must be incorporated into long-range aircraft design. FAA regulations stipulate that there must be at least one flight attendant for every 50 seats on an airliner, although the actual number depends upon the operator’s preferences. Flight attendants constitute part of the indirect (or overhead) costs of operation so their number on any flight is subject to considerations of economics and competition. It is not unusual to have an average number of 20–30 seats per flight attendant, with the lower range more common on long-range flights and on flights with several levels of service.
Average Crew Member Weights from USDOT (2004)
| Crew Member | Average Weight (lb) | Average Weight with Bags (lb) |
| Flight crew member | 190 | 240 |
| Flight attendant | 170 | 220 |
| Male flight attendant | 180 | 220 |
| Female flight attendant | 160 | 200 |
| Crew member roller bag | 30 | NA |
| Pilot flight bag | 20 | NA |
| Flight attendant kit | 10 | NA |
2.3.3 Cargo weight
Revenue may also be produced by cargo carried as part of the payload, but this is difficult to specify in the initial design, being dependent upon the priorities placed on cargo by different airline operators. Therefore the payload in the initial design phase will be set by the passenger load alone as described previously. Once the fuselage design is accomplished the volume available in the cargo hold, over and above that necessary to accommodate the checked luggage, can be estimated. Then the additional payload due to freight can be estimated and included in the refined weight estimate which will be carried out in Chapter 8.
2.3.4 Fuel weight
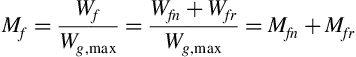
The total usable fuel weight, Wf, may be considered to be the sum of two parts, the nominal weight of fuel, Wfn, necessary for the mission range R, and the fuel reserve, Wfr, or Wf = Wfn + Wfr. The quantity of reserve fuel carried is generally set by the operator, within the requirements posted by the FAA. The maximum gross weight may then be expressed as follows:
We introduce the following definitions for the weight fractions of the various components:
![]()
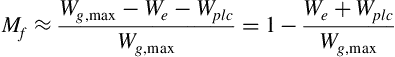
Equation (2.2) may be solved for We and the result written as
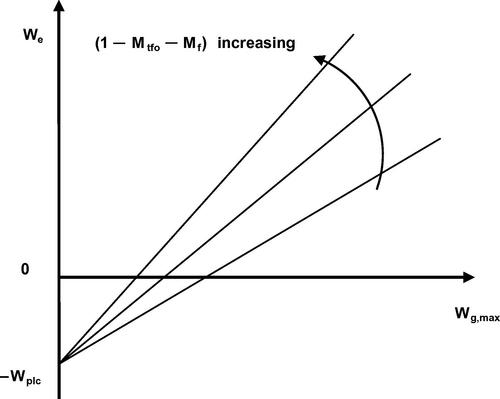
Thus, the equation for the empty weight is that of a straight line, i.e., We = aWg,max + b. This result is shown schematically in Figure 2.2 where it is seen that the quantity Wplc is the anchor point for the design of the airplane. All the possible results for We radiate out from the point (0, −Wplc) and depend upon the slope, a, of the straight line, and this is primarily dependent upon the fraction of fuel carried by the aircraft.
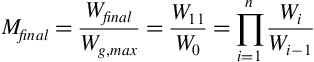
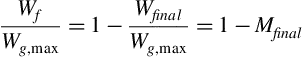
The remaining problem in the weight estimation process is the determination of the coefficient of the takeoff weight in the equation for empty weight, which is the slope a = 1 – (Mf + Mtfo). The term Mf clearly depends upon the amount of fuel used in carrying out the mission specification, including the reserve requirements. The total weight of fuel actually used in a nominal flight is the difference between the maximum gross weight and the landing weight, or Wfn = Wg,max − Wfinal and therefore
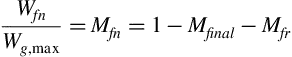
This means that the fraction of maximum gross weight that is usable fuel on a nominal flight is given by Mf = 1 − Mfinal. During the flight the only weight change comes about from fuel consumption. Thus each stage shows a certain change in aircraft weight between that at the start of the segment and that at the end of the segment. The fuel fraction Mf may be found by applying a chain product of the weight fractions of each of the n stages as follows:
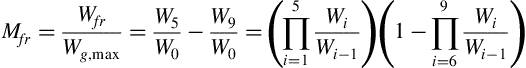
To calculate the portion of fuel used for the nominal mission and the portion of fuel kept in reserve, we note that the former is given by
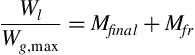
Then the landing weight fraction for a nominal mission, i.e., one where no reserve fuel is used, is as follows:
The second term on the right-hand side of Equation (2.7) is given by
The total fuel, it will be recalled, is given by
Recall that the normalized maximum fuel load is given by
For purposes of illustration, this term may be approximated using information on empty weights and numbers of passengers that have been compiled from information in the open literature for 50 operational airliners. First, we make the following approximation:
Data using his approximation are shown in Figure 2.3 along with a trend line given by ![]() , where R is measured in statute miles. Note that for very long-range aircraft the total fuel fraction approaches half the take off weight. This information provides a check on the estimates being made for the fuel requirements of the aircraft being designed.
, where R is measured in statute miles. Note that for very long-range aircraft the total fuel fraction approaches half the take off weight. This information provides a check on the estimates being made for the fuel requirements of the aircraft being designed.
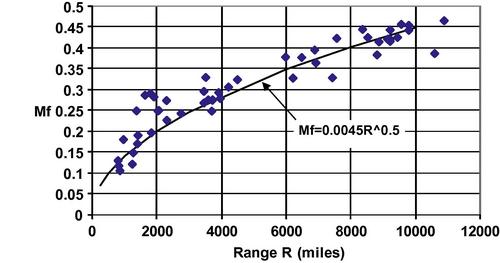
Figure 2.3 The total fuel fraction Mf is shown as a function of range as estimated from available information on 50 airliners. The solid line is an approximate curve fit to the data shown.
2.3.5 Fuel consumption by mission segment
The 11 general mission stages are described in Table 2.4, along with Roskam’s (1986) suggestions for applicable average weight fractions for turbofan-powered aircraft; turboprop-powered aircraft are treated in a subsequent section. Recall that stages 6 through 9, inclusive, correspond to flight diversions requiring reserve fuel and that the nominal flight includes only stages 1–5, plus 10 and 11. In addition, for long-range international flights, stage 6 is calculated not for 1 h, but for 10% of the nominal flight time. In addition, in stage 9 for international flights there would be included with the diversion to an alternate airport 200 nm away a 30 min hold at 15,000 ft altitude at the alternate airport. The terms used in Table 2.4 are explained more fully later in this chapter.
Weight Fractions for the Mission Segments for Turbofan Aircraft (R in nm, V in kts, and Cj in hr−1)
| Stage | Description | Wi/Wi−1 |
| 1 | Engine start and warm-up | 0.990 |
| 2 | Taxi | 0.990 |
| 3 | Takeoff | 0.995 |
| 4 | Climb | 0.980 |
| 5 | Cruise to full range | exp [−RCj/V(L/D)] |
| 6a | One hour additional flight at cruise conditions | exp [−Cj/(L/D)] |
| 6b | Ten percent nominal flight time additional | exp[−RCj/10V(L/D)] |
| 7a | Descent to destination and refused landing | 0.990 |
| 8a | Climb | 0.980 |
| 9a | Diversion to alternate airport 200 nm distant | exp [−200Cj/V(L/D) |
| 9b | Diversion to alternate airport 200 nm distant plus 0.5 h hold at 15,000 ft altitude at alternate airport | exp[−200Cj/V(L/D) + exp[0.5Cj/V(L/D)] |
| 10 | Descent | 0.990 |
| 11 | Landing | 0.992 |
2.3.6 Fuel consumption in segments other than cruise
The quantity Wi/Wi−1 is the ratio of the weight of the aircraft at the end of stage i to the weight at the start of stage i (i.e., the end of the previous stage). The weight fractions for segments of the flight which involve acceleration, like stages 1–4 and 10–11, are generally very close to unity because commercial flights spend most of the flight time at essentially constant velocity cruise conditions. Compilations of representative values for these weight fractions for all stages except the cruising stages are those given by Roskam (1986) and are included in Table 2.4 along with cruise-related equations. It may be noted that once the characteristics of the airplane are known in greater detail it will be possible to more accurately determine the weight of fuel used during climb and descent and this is carried out as part of the refined weight estimates discussed in Chapter 8.
For example, Figure 2.4 shows the ratio of the weight at the end of climb to that at the start of climb as a function of the weight at start of climb; that is, the ratio W4/W3 in Table 2.4. The values shown are taken from Shevell (1989), and refer to the fuel to climb for the Douglas DC-10-10 airliner for the particular case of climb to 35,000 ft. In Table 2.4 Roskam’s (1986) generic value, W4/W3 = 0.98, is specified, and this is reasonably close to the more accurate values in Figure 2.4. A discussion of the climb and descent segments of the mission profile is presented in Chapter 10.
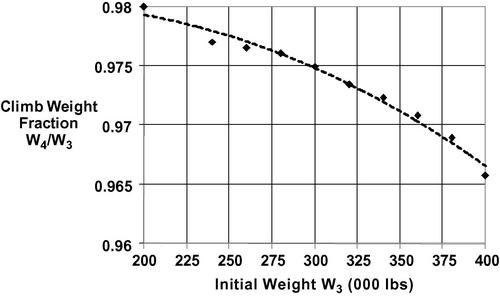
Figure 2.4 The weight fraction W4/W3 of Table 2.1 for the Douglas DC-10-10 airliner in a climb to 35,000 ft as given by Shevell (1989). Dotted line is added to indicate the trend.
2.3.7 Fuel consumption in cruise
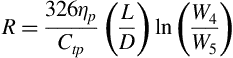
A detailed discussion of the Breguet range equation suitable for this stage of the investigation appears in Chapter 10; here it is written as follows:
This form is applicable to aircraft powered by turbofan or turbojet engines; here R is the range, V is the cruise speed, L/D is the lift to drag ratio, and Cj is the thrust specific fuel consumption. The corresponding relation for turboprop aircraft is given in Section 2.7. All the variables in Equation (2.12) are to be evaluated under cruise conditions.
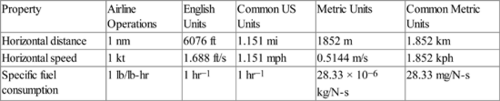
Note that the quantity V/Cj must have the same units as does the range R for Equation (2.12) to be consistent. There are variations in the choice of units between different sectors of the aerospace industry, in spite of the trend toward metrification in many other industries. The common units of horizontal distance and speed in airline operations are still nautical miles, abbreviated nm, and knots, or nautical miles per hour, abbreviated kts, respectively. Vertical distance, that is, altitude, is commonly referred to in feet and the specific fuel consumption Cj is typically given in the units of pounds of fuel burned per hour per pound of thrust. The units for Cj are convenient because they reduce to solely inverse hours or hr−1. Thus, using this set of units the ratio of V/Cj has the unit of nautical miles. Some typical units are shown in Table 2.5. The units used in airline operations, like common US units, make RCj/V dimensionless with no corrections. The metric version of specific fuel consumption is often clumsy to use in the present context because it is a ratio of a mass flow rate to a force.
Some Units in Use for Range, Speed, and Specific Fuel Consumption
| Property | Airline Operations | English Units | Common US Units | Metric Units | Common Metric Units |
| Horizontal distance | 1 nm | 6076 ft | 1.151 mi | 1852 m | 1.852 km |
| Horizontal speed | 1 kt | 1.688 ft/s | 1.151 mph | 0.5144 m/s | 1.852 kph |
| Specific fuel consumption | 1 lb/lb-hr | 1 hr−1 | 1 hr−1 | 28.33 × 10⁻⁶ kg/N-s | 28.33 mg/N-s |
Solving for the fuel weight fraction expended during cruise from Equation (2.12) yields
In this equation the units must be consistent, for example, R in nautical miles (or miles), V in knots (or miles per hour), and Cj in pounds fuel per hour per pound of thrust, so that the argument of the exponential function is dimensionless. One may now determine a value for W5 / W4, W6 / W5, and W9 / W8 and therefore Mf for the prescribed range if one picks a set of values for the airplane’s performance parameters V, Cj, and L /D. A range of representative values for some of these parameters is described in the next section. Of course, wherever possible, it is preferable to use information from the research carried out on the market survey aircraft to improve the estimates for these values.
2.3.8 Selection of cruise performance characteristics
The cruise speed V should be as high as is reasonable, remembering that the drag rises with the square of the speed and the engines selected later on in the design process must be able to provide the thrust necessary to overcome this drag. At the speeds considered for jet transports it is preferable to deal with the Mach number M = V/a rather than the velocity because it is the appropriate similarity variable for the force and moment coefficients. Furthermore, the commercial jet transports considered here generally cruise around the tropopause, the altitude where the stratosphere begins (around 36,000 ft or 11 km) and where the atmospheric temperature, and therefore the speed of sound a, is approximately constant (at 574 kts or 660 mph), so it is also convenient to work with the cruise Mach number. Standard atmospheric profiles may be used in the design process, as shown in Appendix B. Typical cruise Mach numbers are in the range of 0.76 < M < 0.86 and the actual values for the market survey aircraft may be used as a guide for the present design.
Similarly, the assumed cruise value of the specific fuel consumption should be as low as possible, but should be in keeping with existing or planned engine characteristics. Current turbofan technology has provided cruise-specific fuel consumptions in the range 0.5 < Cj < 0.6, in the units of pounds of fuel consumed per hour per pound of thrust produced. Again, published data for the engines used by the market survey aircraft can provide a guide for representative values to be used for the current aircraft design. It should be noted that most published engine data show values for takeoff-specific fuel consumption which are in the range of 0.3–0.4 pounds of fuel per hour per pound of thrust, but this applies only to takeoff conditions and should not be used for cruise calculations. To repeat, the value of specific fuel consumption for cruise is considerably larger, namely 0.5–0.6 for current high bypass turbofan engines.
The lift to drag ratio L/D represents the aerodynamic efficiency of the airplane and should be as high as possible. Current commercial jetliners have lift to drag ratios in the range of 14 < L/D < 19, with the higher values associated with long-range versions. The actual L/D for the design aircraft will ultimately be calculated so it is wise, as usual, to try to make reasonable estimates at every stage of the design. Though the cruise lift for an aircraft is easily determined since it is merely equal to the weight of the aircraft at any stage of the cruise, the drag is not as easily determined. Indeed, the drag is a closely guarded secret of aircraft manufacturers and great efforts are expended to continually reduce the drag of new designs. Some of the most modern techniques used for developing reduced drag designs are quite sophisticated and beyond the scope of this book. Thus the lift to drag ratios to be determined later in the design process will not be as high as achieved in current practice, so it is advisable to be somewhat conservative in the choice of the cruise lift to drag ratio, probably confining the maximum value to 16 or so.
Loftin (1985) discusses the estimated L/D for the Boeing B707 and the Douglas DC-8, which he gives as 19.0–19.5 and 17.9, respectively. He argues that the additional length of the DC-8 fuselage increased the total wetted area of the airplane and therefore the profile drag coefficient CD0, thereby bringing down L/D. The later Boeing B767-200 is said to have L/D = 18. Once again, the reduction from the 19 or so of the B707 is attributed to the fact that the ratio of wetted surface area to wing planform area, Swet/S, is larger for the B767-200, although S is comparable for both.
The Boeing B747 is estimated to have L/D = 18, like the B767-200. Other wide-body airliners, like the older Lockheed L1011-200 and the McDonnell-Douglas MD 10–30, are estimated to have L/D values between 17 and 17.5. Heffley and Jewell (1972) present data on the characteristics of a number of aircraft in cruise, as well as in power approach and landing configurations. A particular case is that of the Convair CV-880, a medium-size four-jet airliner, similar to and contemporaneous with the B 707 and DC-8 airplanes. The L/D and ML/D behavior with Mach number is shown in Figure 2.5. Note that although the L/D drops quite rapidly with Mach number, the more important quantity for the range equation, ML/D ∼ VL/D, drops much more slowly.
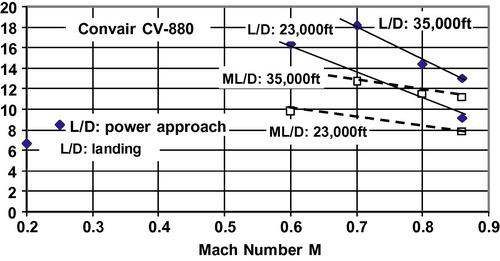
Figure 2.5 Data from Heffley and Jewell (1972) show the variation of L/D and ML/D as a function of M for the Convair CV-880 jetliner at two altitudes. The L/D for typical power approach and landing at sea level are also shown.
2.4 Empty weight trends
Our objective at this point is to develop a reasonable estimate for the empty weight of the design aircraft We and in this regard it is instructive to first see what historical precedents apply. In keeping with common usage, Wto will be considered to be equal to Wg,max in the following discussion. Roskam (1986) collected a substantial database on existing aircraft and generated curve fits describing the relationship between We and Wto and offered a correlation equation of the form
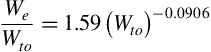
In Equation (2.14) the values of A and B are constants that are different for different classes of aircraft. For jet transport aircraft Roskam (1986) suggests A = 0.0833 and B = 1.0383, which results in a curve that is very close to a straight line and may be approximated by the equation ![]() . A database for 50 commercial airliners provides the results shown in Figure 2.5 which support this simplified result.
. A database for 50 commercial airliners provides the results shown in Figure 2.5 which support this simplified result.
It must be kept in mind that this simple correlation is based on a wide variety of commercial aircraft built over a fairly long period of time and the scatter, though appearing small on Figure 2.6, is in the range of up to tens of thousands of pounds. When the focus is narrowed to the particular class of market survey aircraft considered, the scale of the graph of We vs. Wto will be larger and deviations from the historical curve more evident. The utility of a correlation of this type is in its ability to provide a guideline for the development of a new design. There is a slight nonlinearity in the relationship of empty weight to takeoff weight that is not apparent in Figure 2.6, but is made clearer in Figure 2.7. There the correlation
is shown to fit the actual data better than the simple approximation ![]() .
.
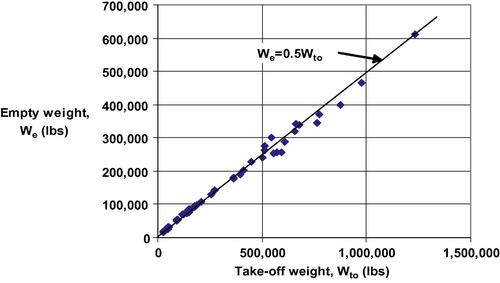
Figure 2.7 Variation of the empty weight fraction We/Wto with Wto for 50 commercial airliners illustrating the slight nonlinearity of the relationship.
As mentioned previously the scale of Figure 2.6 is large enough to obscure deviations from the proposed variation of We with Wto. This should be clear from the results shown in Figure 2.7 where the deviation of the We from the average of 0.5Wto is substantial for Wto < 100,000 lb. This is the domain of regional jets and turboprop aircraft which will be discussed subsequently. As an additional indicator of the design range for the new aircraft under consideration one may make use of the characteristics of the three or four market survey aircraft that have a mission similar to that of the proposed aircraft. Since the empty and take off weights are known for these aircraft they may be represented as discrete points on the plot of We as a function of Wto. Those points, which represent the aircraft most like the design aircraft, serve to further limit the probable region of the design plot where the new aircraft will fall. This is illustrated in Figure 2.8.
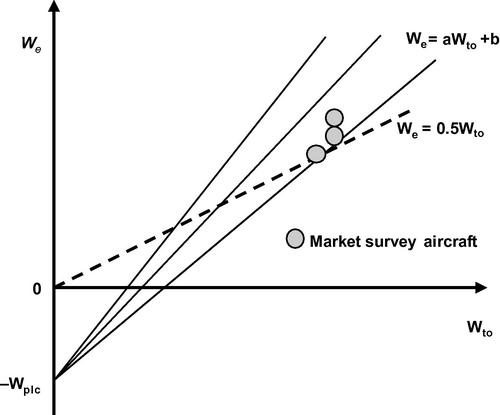
Figure 2.8 Estimation of empty weight using empirical weight relations and characteristics of market survey aircraft which are shown as circular symbols.
2.5 Fuel characteristics
Jet fuel is a hydrocarbon fuel composed primarily of paraffin (approximately 70%) and aromatic (approximately 20%) petroleum compounds. Some characteristics are shown in Table 2.6 as given by Chevron (2000). The most commonly used fuel in the US is Jet A and that fuel will be used in developing the aircraft design. Fuel density is variable and fuel is sold on a volumetric rather than a weight basis, and for our purposes it will be considered sufficient to use the standard density shown. Some of the fuel (and lubricating oil) carried on the aircraft will not be drainable from the tanks and therefore is unusable. The weight of this component has been denoted by Wtfo and we need an estimate of this value to calculate the term Mtfo used in the relation between We and Wto used to generate Figure 2.9.
Characteristics of Commonly Used Jet Fuels
| General Designation | US Commercial Designation | US Military Designation | Density at 15C in lb/gal | Freezing Point in degrees (C) | Energy Content (Btu/lb) | Energy Content (Btu/gal) |
| Wide-cut gasoline | Jet B | JP-4 | 6.36 | −50 to −58 | 18,720 | 119,000 |
| Kerosene | Jet A, Jet A-1 | JP-8 | 6.76 | −40 to −50 | 18,610 | 125,800 |
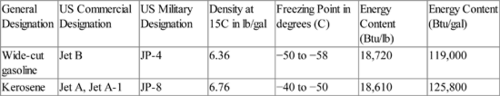
Torenbeek (1982) provides an expression for the weight of trapped fuel and oil in terms of the volume of the fuel tanks on the aircraft. That expression can be converted into an expression involving the weight of the fuel by using the value for the density of Jet A in Table 2.6 which results in the following relation:
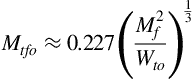
Applying Equation (2.16) to the database of 50 commercial airliners results in the data shown in Figure 2.9. Also shown on the figure is an approximation given by
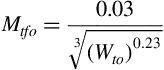
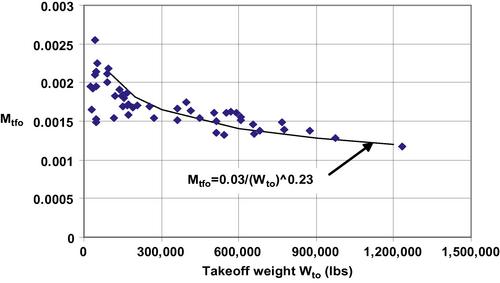
Figure 2.9 Data points show results for trapped fuel and oil fraction Mtfo for Equation (2.16) when using database for 50 commercial airliners. Also shown is a curve-fit describing the trend of the results.
This expression for Mtfo depends upon Wto (in pounds) while in the equation for We it was assumed that it is a constant. However, it is seen that Mtfo will be small, lying in the range 0.001 < Mtfo < 0.005. Therefore it is suggested that Mtfo be estimated using the value of Mf calculated and an approximate value for Wto based on the values for the market survey aircraft.
2.6 Estimation of the takeoff and empty weights
Equipped with a small set of reasonable performance estimates (V, D/L, and Cj) for the design aircraft, a number of design lines can be entered on the We vs Wto plot. The confluence of design lines, the historical data correlation, and the market survey data constitute the basic design region and this is illustrated in Figure 2.10. It is within this design region that the design choice exists and in order to continue the design a specific point must be selected. That choice will be one which best defines the initial estimate of the empty weight and the takeoff weight of the design aircraft. These weights will influence the subsequent development of the design and if they are chosen poorly may require substantial alteration and iteration later on. Nevertheless a choice must be made and the major result of this chapter of the design report is the design plot of Figure 2.10 with all its information and the final values for We and Wto and the associated assumed performance data.
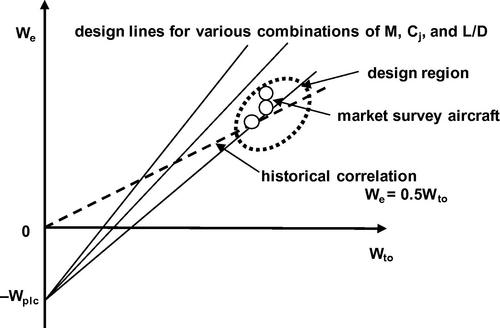
Figure 2.10 General design curve illustrates the manner in which the design region is determined for jet aircraft. The final choice for We and Wto is set by the appropriate combination of values of V, Cj, and L/D for the proposed aircraft.
The design lines for the different sets of Cj, V, and L/D should appear and be identified on the design chart as should the market survey aircraft points. The design point chosen for the new aircraft should be clearly shown and a discussion illustrating the criteria by which this choice was made should be included in the final design report. In addition, a weight breakdown table showing the relevant weight components for the market survey aircraft and for the design aircraft should be provided. Of course, all of the work carried out should be used to form a clear narrative of this phase of the design process.
2.6.1 New materials for weight reduction
As mentioned in Chapter 1, the pressure to reduce aircraft weight has manufacturers on a quest for new materials that can outperform conventional airplane construction materials at lower weight. There is extensive work underway to incorporate ever-greater percentages of composite materials into the aircraft structure in particular and such efforts were assiduously pursued in the new Airbus A380 and Boeing 787, as well as aircraft under development, like the Airbus A350, among others. There is still concern about material lifetime, particularly with regard to fatigue, as well as to the ability to affordably accommodate repair and maintenance work. There are other issues surrounding the use of composite regarding porosity, environmental robustness, effect of lightning strikes, and the like. The rapidly growing use of composites in aircraft is demonstrated by the A380 using it for around 25% and the B787 using it for up to 50% of the airframe weight. The material of choice for the Airbus A380 is glass-fiber-reinforced aluminum while that for the Boeing 787 is carbon-fiber-reinforced plastic, known as CFRP. More details are available in the literature; see, for example, NRC (1996). As might be expected, military aircraft are leading the way in this regard with the Bell Boeing V-22 and the Eurofighter already using composites for about 75% of the airframe weight and the F/A-22 and F/A-18E/F using between 50% and 60%. It is imprudent, at this stage of the design, to make optimistic assumptions about the extent to which new composite materials may reduce the empty weight of the design aircraft. One may be guided by the weight trends shown by the later model aircraft in the market survey. The cultivation of an even-handed approach to estimation is important because overly conservative estimates are as burdensome in their own way as overly optimistic ones.
2.7 Weight estimation for turboprop-powered aircraft
The recent rapid rise in fuel prices has forced a revaluation of turboprop-powered aircraft, particularly for regional airline service. As pointed out in Chapter 1, manufacturers of regional jets have been targeting larger aircraft of around 100 or more seats, underscoring the prediction that turbofan-powered airliners will ultimately abandon the regional market to turboprop aircraft. In general, the public has been moved to consider jet aircraft to be the preferred mode of travel, even for regional distances, so that the question remains as to how much emphasis will be placed on returning turboprops to a major role in airline service. At the moment the high and uncertain fuel prices are moving airline operators to seriously consider asking aircraft manufacturers for advanced-design turboprop aircraft.
For short-range applications cruise speed is not as important in keeping travel time brief as it is for longer-range flight. This becomes apparent when one considers that most of the time in a short-range flight is spent in taxiing from the gate, waiting in a queue for takeoff, climbing, descending, and once again taxiing to the gate. The best time advantage for a turbofan compared to a turboprop may be assumed to be in the ratio of the cruise speeds, that is, about 500 mph/350 mph = 1.43, so that a 60-min flight in a turbofan would be about an 80–90-min flight in a turboprop. Of course, a transcontinental flight would be quite different, with a 6-h flight in a turbofan becoming a 9-h flight in a turboprop. Thus for ranges of up to 500 or 600 miles the turboprop can deliver its good fuel economy with relatively little passenger inconvenience.
2.7.1 Fuel weight estimation for turboprop airliners
The determination of the fuel consumption for turboprop airliners follows the procedures discussed previously for turbofan airliners. However, the stage weight fractions now depend on two new variables, Ctp and ηp, rather than Cj and V. The Brequet range equation for jet aircraft given in Equation (2.12) is slightly different for propeller aircraft, now being given by
All the variables in Equation (2.17) are to be evaluated under cruise conditions. The fuel weight fraction expended during cruise may be obtained from the above equation in the following form:
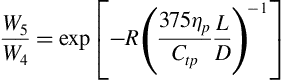
Table 2.4 showing the weight fractions for different mission segments for jet engines is modified for turboprop applications and appears in Table 2.7. The quantity Ctp is the specific fuel consumption of the turboprop engine which has the units of pounds of fuel per hour per shaft horsepower (lbs/hr-hp) and the quantity ηp is the propeller efficiency and is dimensionless. The numerical coefficient 326 incorporates unit conversions. Note that the range R is still in nautical miles and the velocity V is the cruise velocity in knots. The cruise speeds of turboprop commercial aircraft are in the range of 250– 300kts while the ratios of lift to drag are in the range of 14–18. Propeller efficiencies are in the range of 82–92% while specific fuel consumption is in the range of 0.5–0.7 lbs/hp-hr. The numerical values for the weight fractions in the other flight stages are taken from Roskam’s (1986) suggestions for turboprop aircraft.
Weight Fractions for the Mission Segments for Turboprop Aircraft (R in nm, V in kts, and Ctp in lb/hp-hr)
| Stage | Description | Wi/Wi−1 |
| 1 | Engine start and warm-up | 0.990 |
| 2 | Taxi | 0.995 |
| 3 | Takeoff | 0.995 |
| 4 | Climb | 0.985 |
| 5 | Cruise to full range | exp {−RCtp/[326ηp(L/D)]} |
| 6 | One hour added flight at cruise conditions | exp {−(1hr)(V)Ctp/[326ηp(L/D)]} |
| 7 | Descent to destination and refused landing | 0.985 |
| 8 | Climb | 0.985 |
| 9 | Diversion to alternate airport 200 nm distant | exp [−200Cp/326ηp(L/D)] |
| 10 | Descent | 0.990 |
| 11 | Landing | 0.995 |
2.7.2 Empty weight estimation for turboprop airliners
The weight estimation procedures in Section 2.2 are still applicable with some minor changes specific to regional airliners. At the lower takeoff weights typical of regional airliners the nonlinearity of the relationship between We and Wto shown in Figure 2.7 must be taken into account. Empty weights for regional turbofan and turboprop airliners are described more closely in Figure 2.11 and it is seen that the correlation equation is now given more accurately by ![]() in this weight class. Also shown on Figure 2.11 are turbofan aircraft with takeoff weights approaching 100,000 lb, illustrating the start of the deviation of the slope from the 0.6 value. In estimating the empty weight for regional turbofan aircraft the design chart in Figure 2.10 is constructed as before and only the historical empty weight curve changes from We = 0.5Wto to We = 0.6Wto. However for turboprop regional airliners the factors to deal with are Cp, ηp, L/D, and V rather than Cj, L/D, and M. Thus the design chart in Figure 2.10 changes slightly to that shown in Figure 2.12.
in this weight class. Also shown on Figure 2.11 are turbofan aircraft with takeoff weights approaching 100,000 lb, illustrating the start of the deviation of the slope from the 0.6 value. In estimating the empty weight for regional turbofan aircraft the design chart in Figure 2.10 is constructed as before and only the historical empty weight curve changes from We = 0.5Wto to We = 0.6Wto. However for turboprop regional airliners the factors to deal with are Cp, ηp, L/D, and V rather than Cj, L/D, and M. Thus the design chart in Figure 2.10 changes slightly to that shown in Figure 2.12.
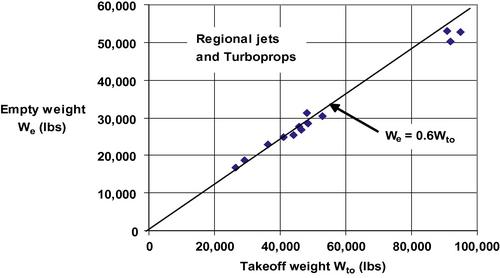
Figure 2.11 Empty weights as a function of takeoff weight for 11 regional jet and turboprop airliners. Three heavier commercial airliners are shown to illustrate the initial deviation from the linear correlation.
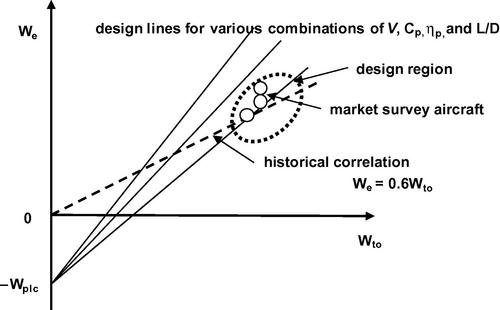
Figure 2.12 General design curve illustrates the manner in which the design region is determined for turboprops. The final choice for We and Wto is set by the appropriate combination of values of V, Cp, ηp, and L/D for the proposed aircraft.
2.8 Design summary
The design choice developed through the steps of this chapter may be best summarized by filling in a table like that shown in Table 2.8. In this fashion, the weights that may be needed in subsequent design developments are readily available.
Preliminary Weight Estimates for the Design Aircraft
| Range R (nm) | Number of seats Np | Cruise speed V (kts) | Cruise Cj or Ctp (hr−1 or lb/hp-hr) | Cruise L/D | |
| Mission requirement | |||||
| Segment Weight | Definition | Weight (lb) | |||
| W0 | Maximum gross weight Wg,max | ||||
| W1 | Weight at start of pushback | ||||
| W2 | Takeoff weight Wto | ||||
| W3 | Climb weight | ||||
| W4 | Weight at start of cruise | ||||
| W5 | Weight at end of cruise | ||||
| W6 | Weight at end of 1 h of additional cruise | ||||
| W6a | Weight at end of 10% additional cruise time | ||||
| W7 | Weight at end of descent to descent to destination | ||||
| W8 | Weight at end of climb from refused landing | ||||
| W9 | Weight at end of diversion to alternate airport | ||||
| W9a | Weight at end of diversion to alternate airport plus 0.5 h hold at alternate airport | ||||
| W10 | Landing weight Wl | ||||
| W11 | Final weight Wfinal | ||||
| We | Empty weight | ||||
| Woe | Operating empty weight | ||||
| Wc | Weight of crew | ||||
| Wpl | Weight of payload | ||||
| Wplc | Weight of payload and crew | ||||
| Wtfo | Weight of trapped fuel and oil | ||||
| Wf | Weight of total fuel | ||||
| Wfn | Weight of nominal mission fuel | ||||
| Wfr | Weight of reserve fuel | ||||
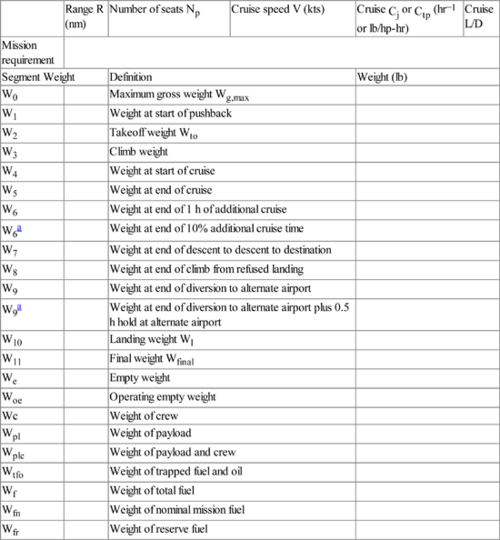
In addition, the mission profile for the design aircraft should be illustrated. A design graph showing the variation of empty weight We as a function of the maximum gross weight Wg,max, like that in Figure 2.10 or 2.12, should be presented. The market survey aircraft data points and the proposed aircraft design point should be clearly identified on the graph.
2.9 Nomenclature
A constant
a sound speed
B constant
Cj turbofan thrust specific fuel consumption
Ctp turboprop-power specific fuel consumption
D drag
L lift
M Mach number
Mfinal final weight ratio
Mf fuel weight ratio
Mtfo trapped fuel and oil ratio
R range
V velocity
Wc weight of full flight crew
We aircraft empty weight
Wf total fuel weight
Wfinal weight of aircraft at end of flight
Wfn fuel weight used in nominal mission
Wfr reserve fuel weight
Wg,max maximum gross weight
Wln aircraft weight at end of nominal mission
Woe operating empty weight
Wpl payload weight
Wplc weight of payload plus flight crew
Wtfo weight of trapped fuel and oil
Wto takeoff weight
W weight
ηp propeller efficiency
2.9.1 Subscript
i index denoting stage number
References
1. Chevron, 2000. Aviation Fuels Technical Review. Chevron Products Company FTR-3, Chapter 2, <www.chevron.com/products/prodserv/fuels/aviationfuel/toc.shtm![]() >.
>.
2. Heffley, R.K., Jewell, W.F., 1972. Aircraft Handling Qualities Data, NASA CR-2144, December.
3. Loftin, K., 1985. Quest for Performance – The Evolution of Modern Aircraft, NASA SP-468.
4. NRC. New Materials for Next-Generation Commercial Transports. National Research Council, National Academy Press; 1996 <www.nap.edu/openbook/0309053900/html/R1.html![]() >.
>.
5. Roskam J. Rapid sizing method for airplanes. Journal of Aircraft. 1986;23(7):554-560.
6. Shevell R. Fundamentals of Flight. Englewood Cliffs, NJ: Prentice-Hall; 1989.
7. Torenbeek E. Synthesis of Subsonic Airplane Design. Dordrecht, The Netherlands: Kluwer Academic Publishers; 1982.
8. USDOT, 2004. US Department of Transportation Advisory Circular AC120-27D, August 11.