
Chapter 6
Data Analytics Tools
Analytics professionals use a wide variety of tools in their work. From simple spreadsheets to complex business intelligence suites, we have many different tools available to help us meet both generalized and specialized analytics needs.
When you're selecting a tool, there are a few important considerations. First, you need the right tool for the job. Just as a carpenter wouldn't use a screwdriver to drive a nail, an analytics professional wouldn't use a spreadsheet to create a machine learning model. Second, you need to choose from the tools available to you. Many analytics tools come with hefty price tags and organizations only license a small subset of them to control costs. Standardizing on a subset of tools also helps improve the ability of teams to work together. If every team in an organization uses different analytics tools, it makes it very difficult for them to collaborate!
Spreadsheets
The spreadsheet is the most widely used tool in the world of analytics. It's hard to imagine anyone who doesn't use spreadsheets as part of their work because they provide an intuitive way to organize our data into rows and columns. Spreadsheet software is installed on pretty much every computer in the modern work environment, and web-based spreadsheets are freely available to anyone.
Spreadsheets are productivity software packages that allow users to create documents that organize any type of data into rows and columns. Users may place any data they like in the spreadsheet and then quickly and easily perform mathematical calculations, such as finding the sum of the values in a row or searching out the minimum, maximum, mean, and median values in a dataset.
Spreadsheets lack any of the constraints of a relational database. While you can certainly organize data in a spreadsheet, there's no requirement that you do so. If you'd like, you can mix numbers, text, dates, and other data elements all in the same column. That does, of course, reduce the usefulness of the spreadsheet, but the user of spreadsheet software has total flexibility in how they organize their data.
The power of spreadsheets comes from the fact that virtually anybody can use one. The barrier to entry is low because they're readily accessible and easy to use. If you need to perform a quick ad hoc data analysis on a fairly small set of data, spreadsheets offer an easy way to do that and then share your work with others.
More formal business needs often stress the capabilities of a spreadsheet. Once the number of people needing to access data grows and you have the desire to keep a centralized and managed data store, these requirements often drive a move of that application from a spreadsheet to a relational database.
Microsoft Excel
Microsoft Excel is the most commonly used desktop spreadsheet application. It's available as a component of the widely deployed Microsoft Office productivity suite and most modern knowledge workers have access to it.
As with any spreadsheet, you can store data of any kind in an Excel spreadsheet. Figure 6.1 shows an example of an Excel spreadsheet containing data on restaurant inspections conducted by the city of Chicago. This spreadsheet is organized in the same way you might organize a database table—each column represents a particular data element recorded about each inspection and each row represents a single inspection event.
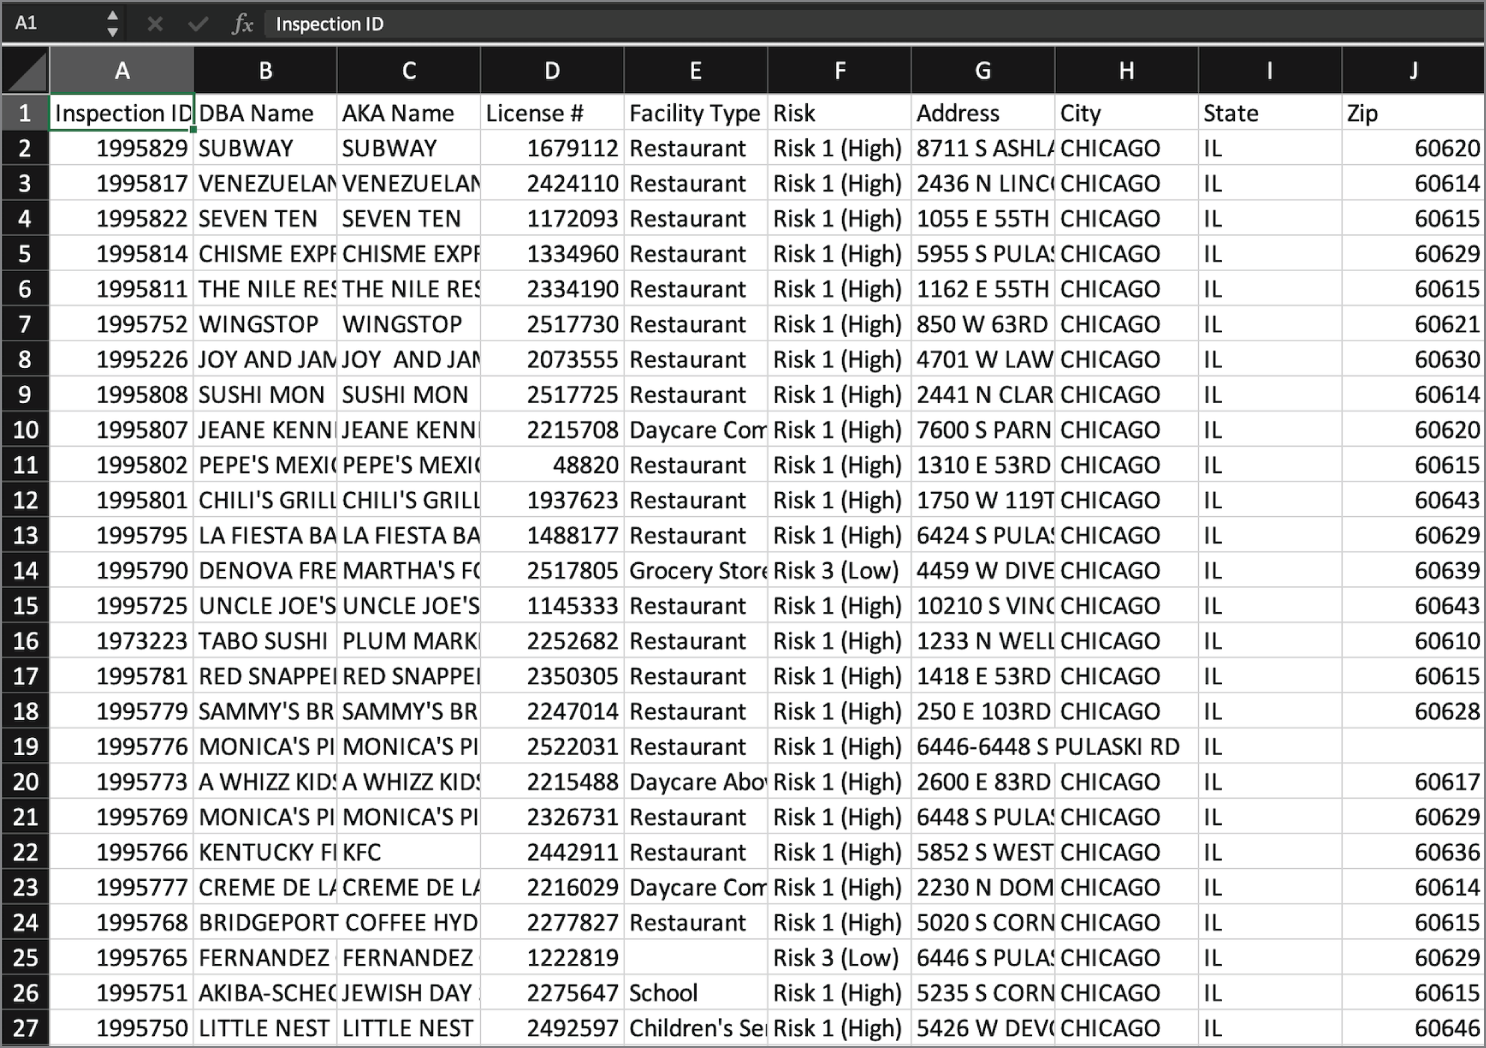
FIGURE 6.1 Table of data in Microsoft Excel
Excel then allows users to perform calculations and visualizations on their data. You might want to count the total number of restaurant inspections, determine the average length of time that an inspection takes, or compute the number of inspections conducted each day. You can perform almost any simple analysis you might need right in the Excel spreadsheet. Figure 6.2 shows an example of a quick visualization showing the results of inspections conducted by the city.

FIGURE 6.2 Data visualization in Microsoft Excel
Programming Languages
In many cases, business analysts and data scientists need a way to be able to load, manipulate, and analyze data outside of the constraints of software written by another organization. In those cases, they might develop their own software to meet a specific need. In fact, many skilled analysts find it easier to write their own code to perform many analytics tasks than to work within another analytics package.
Programming languages allow skilled software developers to write their own instructions to the computer, allowing them to directly specify the actions that should take place during the analytics process.
R
The R programming language is extremely popular among data analysts because it is focused on creating analytics applications. R originally appeared in the 1990s as a statistical programming language that was popular among a niche audience. More than two decades later, the language has evolved into one of the most popular languages used by statisticians, data scientists, and business analysts around the world.
R gained rapid traction as a popular language for several reasons. First, it is available to everyone as a free, open source language developed by a community of committed developers. This approach broke the mold of past approaches to analytic tools that relied on proprietary, commercial software that was often out of the financial reach of many individuals and organizations.
R also continues to grow in popularity because of its adoption by the creators of machine learning methods. Almost any new machine learning technique created today quickly becomes available to R users in a redistributable package, offered as open source code on the Comprehensive R Archive Network (CRAN), a worldwide repository of popular R code.
One of the most important advances in the R language was the creation of a set of R packages known as the tidyverse by Hadley Wickham and other developers. The tidyverse approach to data analysis simplifies the use of the language and makes it accessible to anyone willing to invest a few hours in learning some basic syntax.
Most modern R developers choose to write, test, and deploy their code using an integrated development environment (IDE) called RStudio. This graphical interface, shown in Figure 6.3, provides a well-designed environment to manage your code, monitor its progress, and troubleshoot issues that might arise in your R scripts.

FIGURE 6.3 Data analysis using R and RStudio
Python
The Python programming language is arguably the most popular programming language in use today. Python is about the same age as R, but the major difference between Python and R is that Python is a general-purpose programming language. This means that it is capable of creating software to meet just about any need you might imagine. You can do everything from code a video game to perform a complex data analysis in Python.
With that flexibility, however, comes some complexity. While R is quite popular because of its ease of use, writing software in Python requires some more expertise. Python developers usually have a more formal background in computer science and are familiar with many coding concepts, such as looping and branching, that aren't necessary in most R code.
Python also has specialized libraries that focus on the needs of analysts and data scientists. In particular, the Python Data Analysis Library (pandas) provides a set of tools for structuring and analyzing data. Figure 6.4 shows an example of Python code performing data analysis.
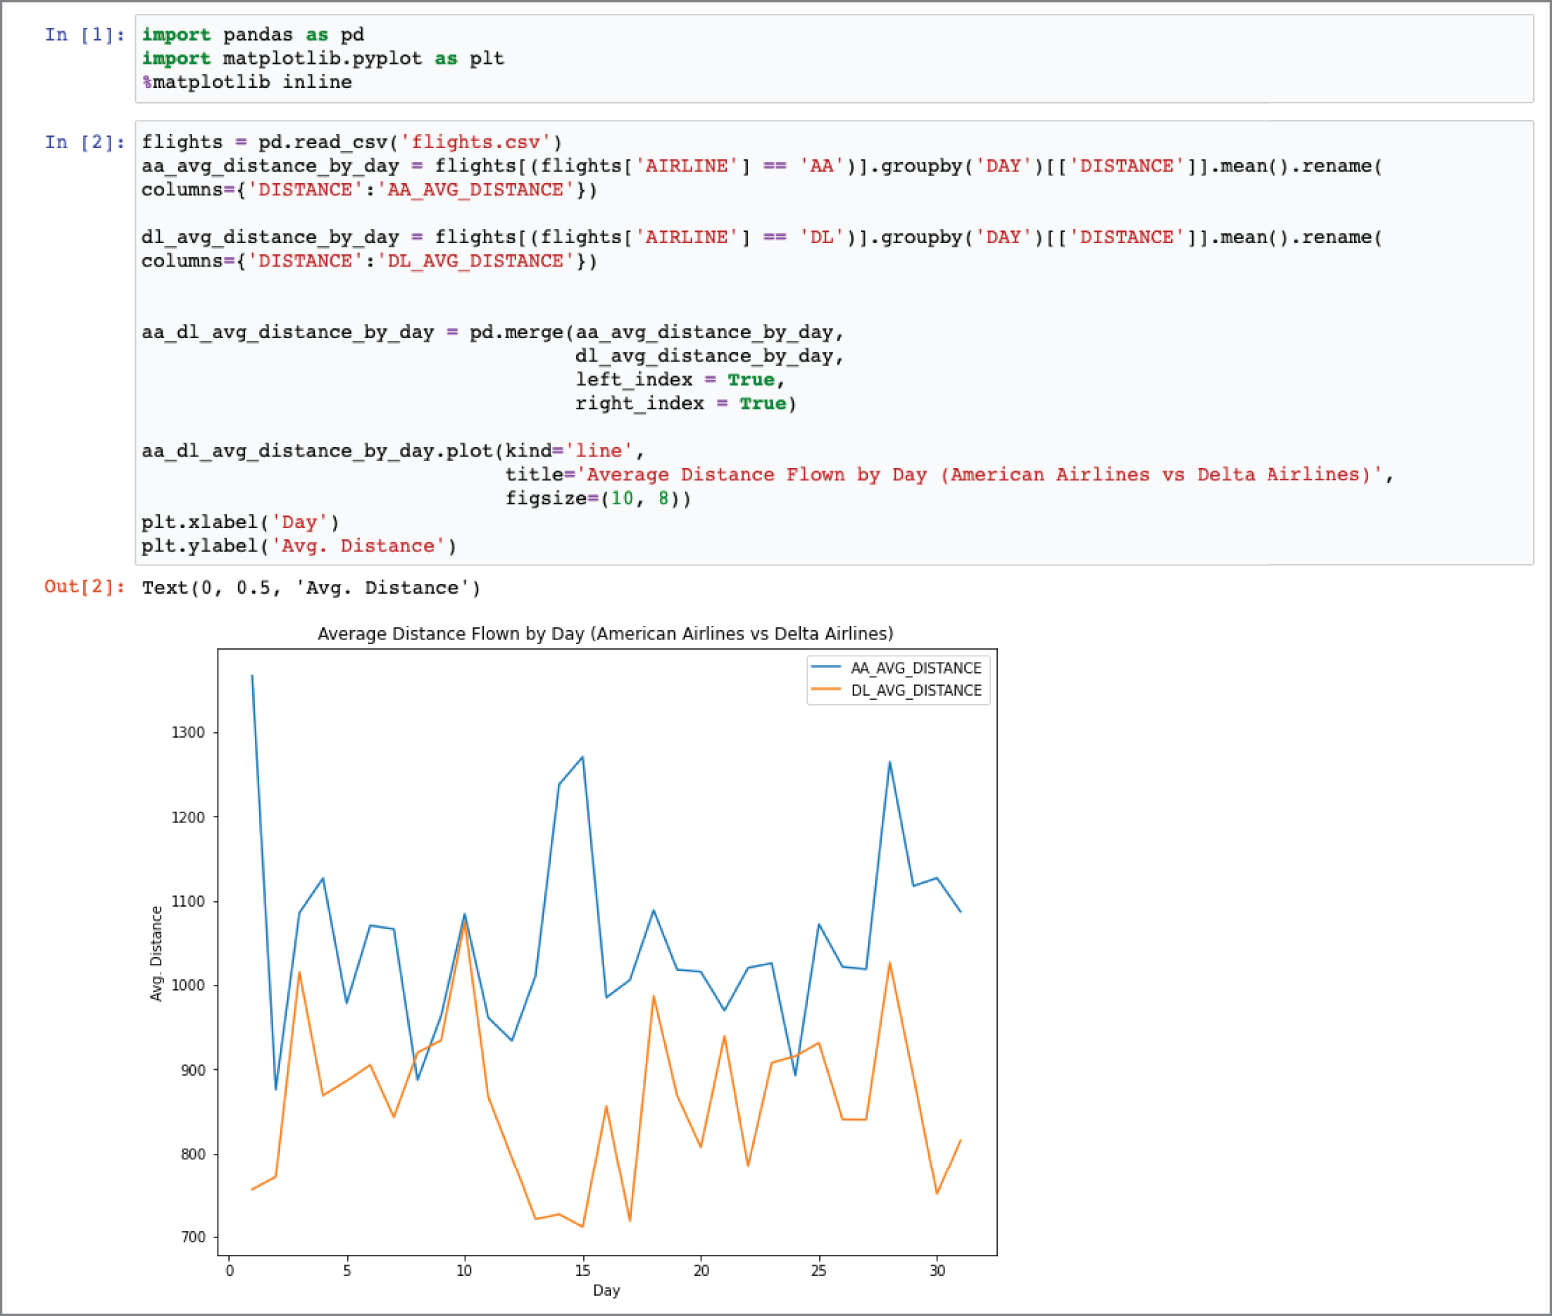
FIGURE 6.4 Data analysis using Python and pandas
Structured Query Language (SQL)
The Structured Query Language (SQL) is the language of databases. Any time a developer, administrator, or end user interacts with a database, that interaction happens through the use of a SQL command. SQL is divided into two major sublanguages:
- The Data Definition Language (DDL) is used mainly by developers and administrators. It's used to define the structure of the database itself. It doesn't work with the data inside a database, but it sets the ground rules for the database to function.
- The Data Manipulation Language (DML) is the subset of SQL commands that are used to work with the data inside of a database. They don't change the database structure, but they add, remove, and change the data inside a database.
As you prepare for the exam, you'll need to be familiar with the major commands used in SQL. It's important to understand that you're not responsible for writing or reading SQL commands. You just need to know what the major commands are and when you would use them.
There are three DDL commands that you should know:
- The CREATE command is used to create a new table within your database or a new database on your server.
- The ALTER command is used to change the structure of a table that you've already created. If you want to modify your database or table, the
ALTERcommand lets you make those modifications. - The DROP command deletes an entire table or database from your server. It's definitely a command that you'll want to use with caution!
There are also four DML commands that you should know:
- The SELECT command is used to retrieve information from a database. It's the most commonly used command in SQL as it is used to pose queries to the database and retrieve the data that you're interested in working with.
- The INSERT command is used to add new records to a database table. If you're adding a new employee, customer order, or marketing activity, the
INSERTcommand allows you to add one or more rows to your database. - The UPDATE command is used to modify rows in the database. If you need to change something that is already stored in your database, the
UPDATEcommand will do that. - The DELETE command is used to delete rows from a database table. Don't confuse this command with the
DROPcommand. TheDROPcommand deletes an entire database table, whereas theDELETEcommand just deletes certain rows from the table.
Users, administrators, and developers access databases in different ways. First, a developer, administrator, or power user who knows SQL might directly access the database server and send it a SQL command for execution. This often happens through a graphical user interface, such as the Azure Data Studio interface shown in Figure 6.5. This tool allows you to write database queries in SQL, send them to the database, and then view the results.
Utilities like Azure Data Studio can do more than just retrieve data. They also offer a graphical way for database administrators to reconfigure a database. You can click through a series of menus to choose the changes you'd like to make to the database and the utility writes SQL commands that carry out your requests and sends them to the database.

FIGURE 6.5 SQL query using Azure Data Studio
Similarly, many query and report builder tools are available that simplify database access for end users, allowing them to click through a series of menus and drag objects around on the screen to retrieve data from a database. The tool then translates those actions into a SELECT statement that retrieves the desired information from the database.
Finally, computer software can interact with databases programmatically. This just means that software can send SQL commands to the database as part of its activity. For example, when you fill out a form on a company's website, chances are that software is processing that form and then storing a record of your activity in a database.
Statistics Packages
Of course, not everyone has the ability or desire to write their own software. It's often far simpler to work within software packages that provide the capabilities that we need. Statistics packages are a great example of this. These software packages go beyond the simple statistical analyses that are possible in spreadsheets and provide access to advanced statistical environments that are accessible through a graphical user interface and/or a built-in scripting language.
These software packages may be used by anyone interested in data analysis, but the reality is that they are mainly the domain of professional statisticians. Generally, data analysts with a computer science background tend to prefer using programming languages to write their own code, while those who do not have a strong background in statistics generally prefer some of the more visually oriented tools discussed later in this chapter.
IBM SPSS
One of the most popular pieces of statistical software is IBM's SPSS package. SPSS is one of the oldest statistical software packages, first released in 1968, but it continues to be used today by many statisticians. Figure 6.6 shows an example of calculating the correlations between a set of variables using SPSS.

FIGURE 6.6 Calculating correlations in SPSS
SAS
SAS is a statistical package that is quite similar in function and form to SPSS. Like SPSS, SAS is a long-standing pillar of the statistical software community. It was first released in 1976 and also continues to be widely used today. Figure 6.7 shows an example of a simple data analysis being performed in SAS.

FIGURE 6.7 Analyzing data in SAS
Stata
Stata is yet another statistical analysis package that dates back to the 1980s and continues to be updated today. It offers essentially the same features as SPSS and SAS and provides users with both a graphical interface and a command-line interface depending on their personal preference. Stata is less widely used than the more popular SAS and SPSS tools. Figure 6.8 shows an example of building and visualizing a linear regression model in Stata.
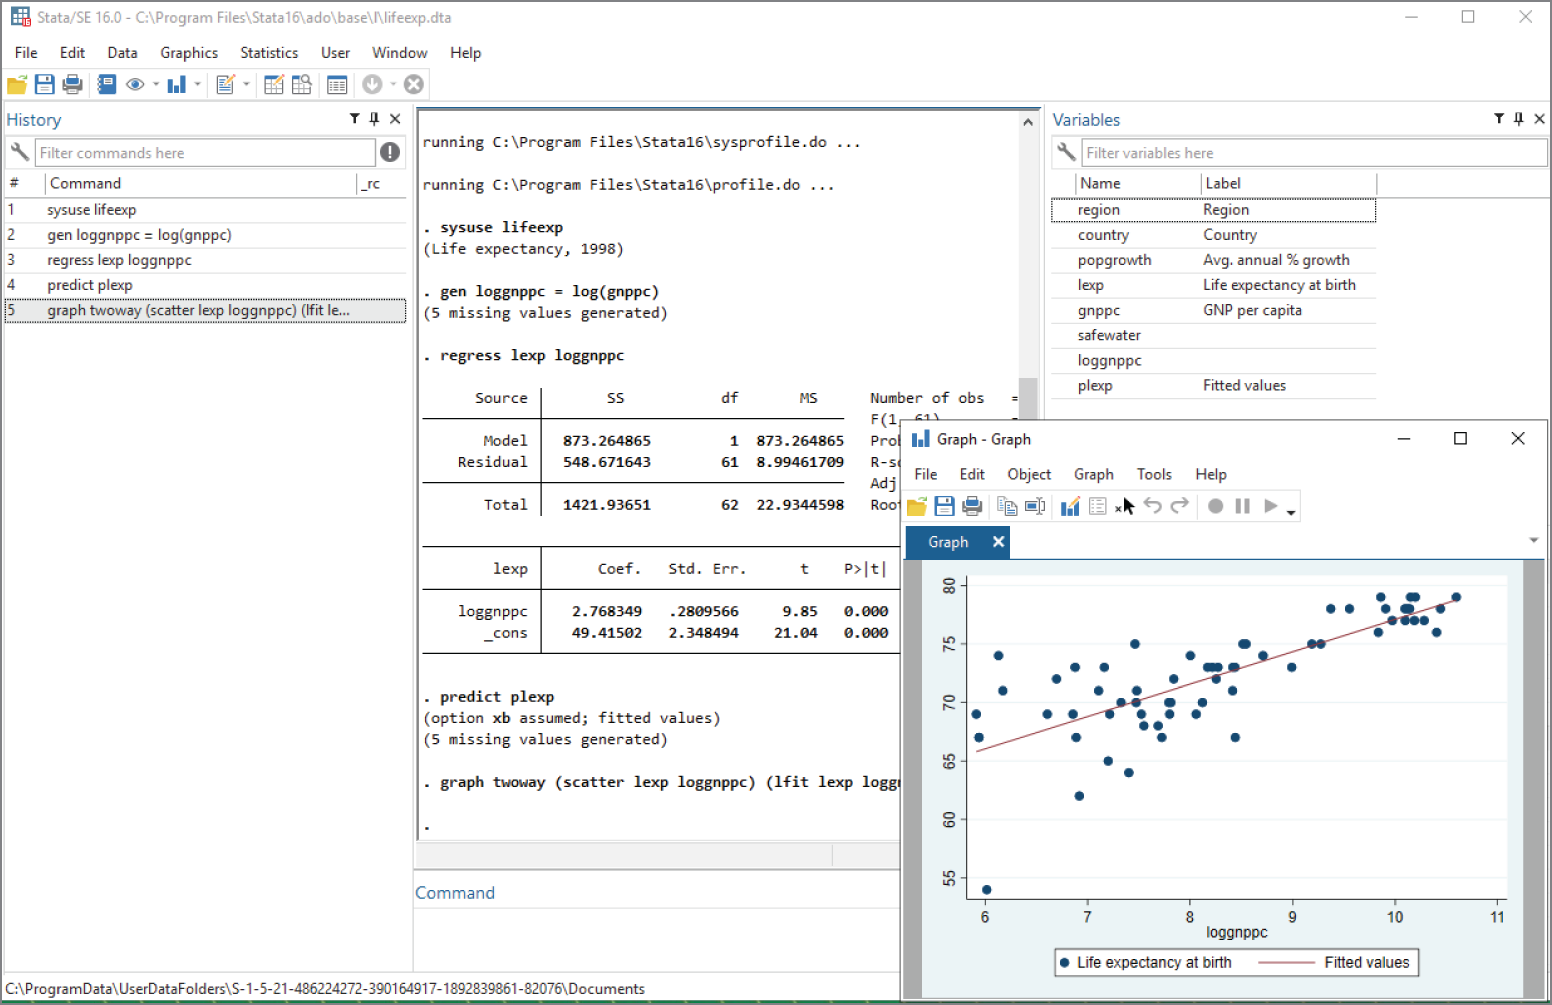
FIGURE 6.8 Building a simple model in Stata
Minitab
The final statistical software package covered on the Data+ exam is Minitab. And, once again, Minitab shares most of the same features as SPSS, SAS, and Stata but fits into the same category as Stata—an older tool that is not widely used today. Figure 6.9 shows the evaluation of a linear regression model in Minitab.
Machine Learning
Moving on from statistics-focused tools, the industry also makes use of a set of graphical tools designed to help analysts build machine learning models without requiring them to actually write the code to do so. These machine learning tools aim to make machine learning techniques more accessible. Analysts may still tune the parameters of their models but do not necessarily need to write scripts to do so.

FIGURE 6.9 Evaluating a regression model in Minitab
IBM SPSS Modeler
IBM's SPSS Modeler is one popular tool for building graphical machine learning models. Instead of requiring that users write code, it provides an intuitive interface where analysts can select the tasks that they would like the software to carry out and then connect them in a flowchart-style interface. Figure 6.10 shows an example of this interface being used to create a decision tree model of consumer credit data.
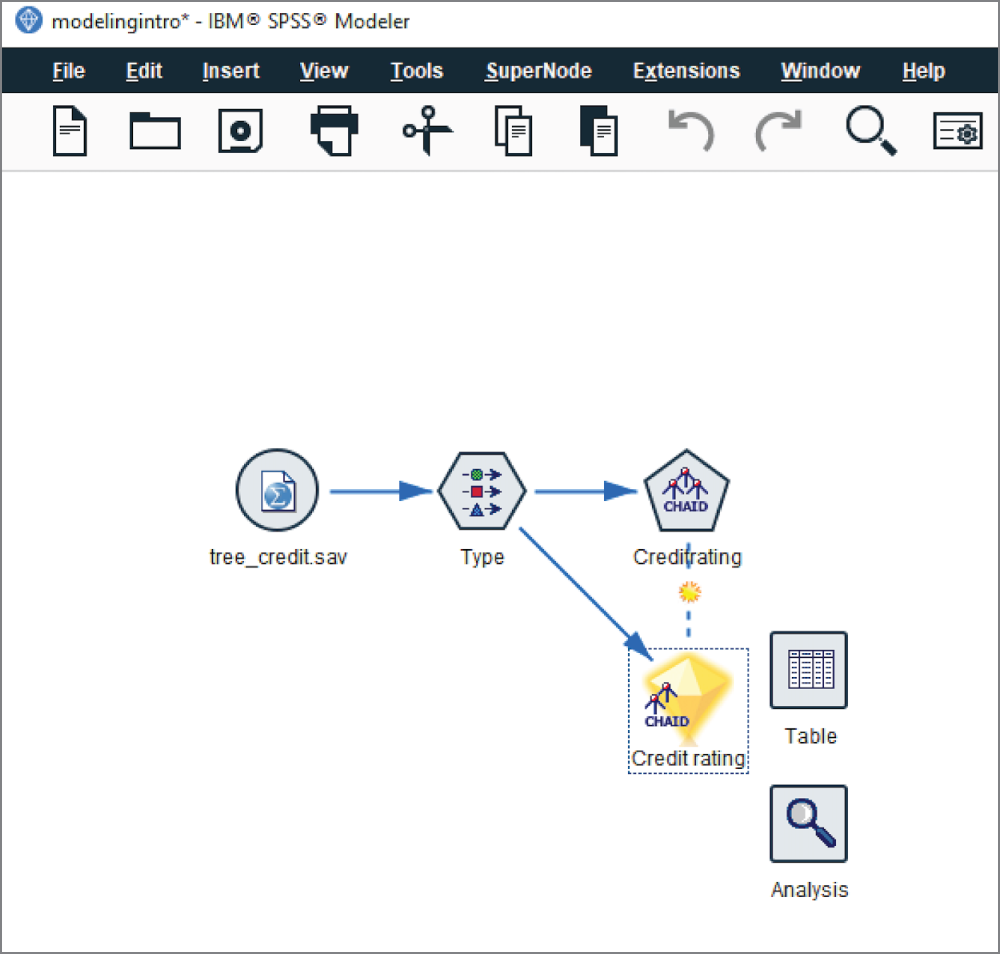
FIGURE 6.10 Designing a machine learning task in SPSS Modeler
Once the user is satisfied that they've designed the machine learning process, they then run the model and are able to visually explore the results. Figure 6.11 shows the result of executing the decision tree model specified in Figure 6.10.
RapidMiner
RapidMiner is another graphical machine learning tool that works in a manner similar to IBM SPSS Modeler. It offers access to hundreds of different algorithms that may be placed in a visually designed machine learning workflow. RapidMiner also offers prebuilt analytic templates for common business scenarios. Figure 6.12 shows the visual design of a decision tree task in RapidMiner.

FIGURE 6.11 Exploring a data model in SPSS Modeler
Figure 6.13 shows the result of creating this decision tree in RapidMiner. The presentation of results is not quite as visually appealing as the decision tree in SPSS Modeler, but it provides similar information to the analyst.

FIGURE 6.12 Designing a machine learning task in RapidMiner
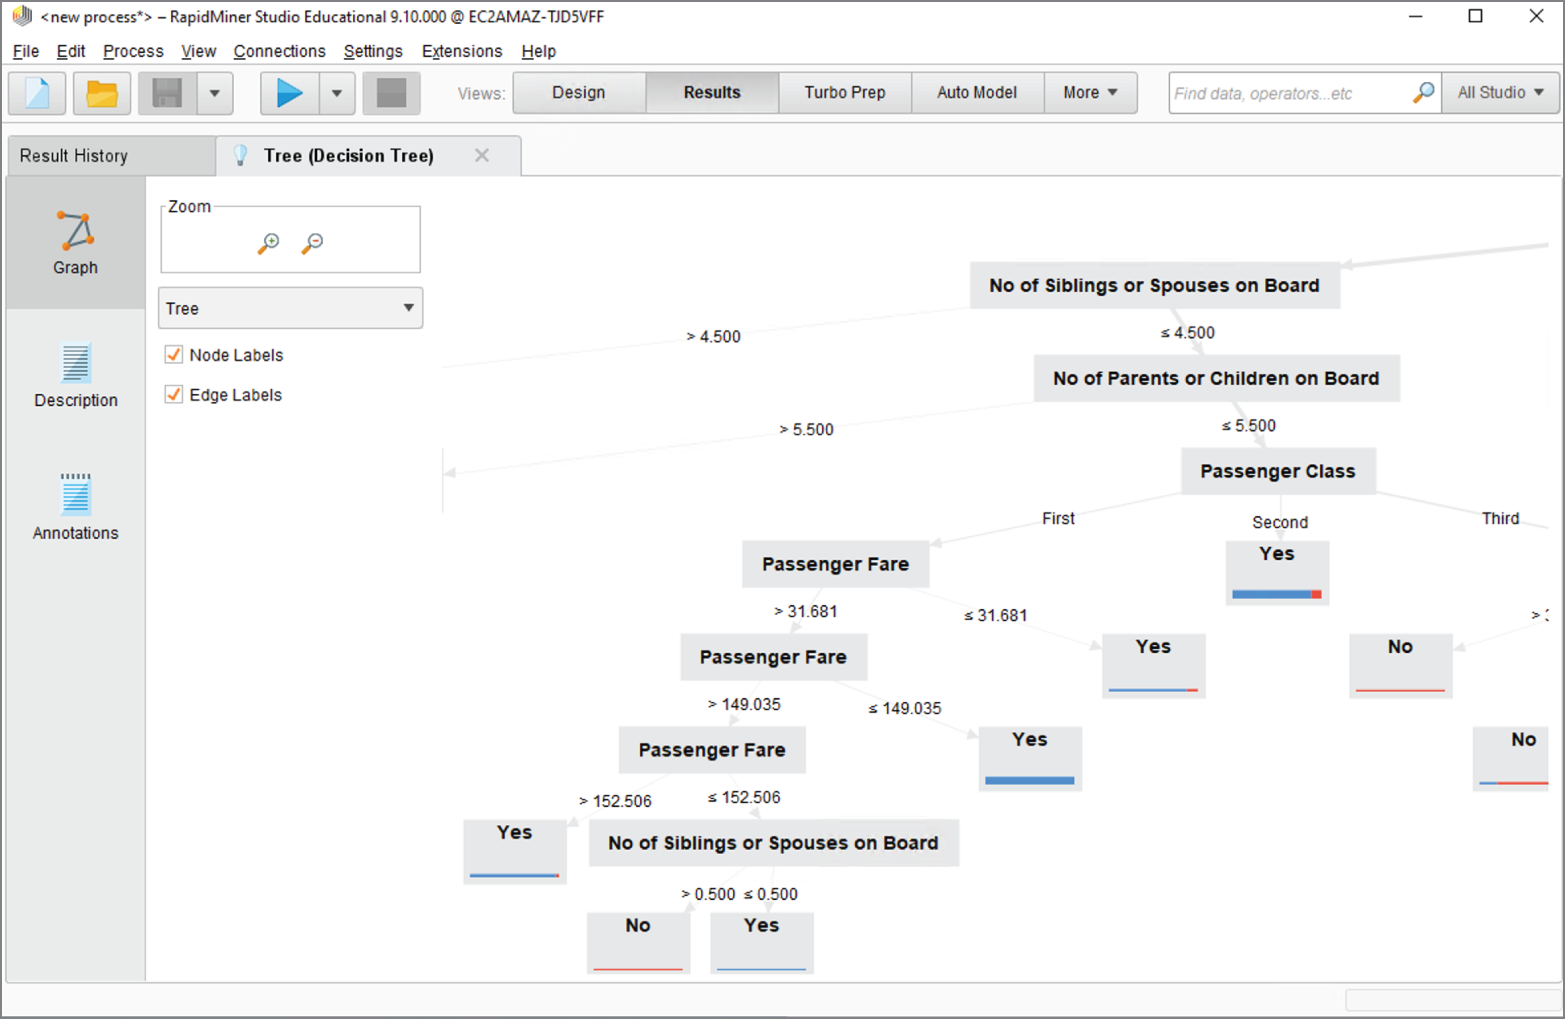
FIGURE 6.13 Exploring a data model in RapidMiner
Analytics Suites
Up until this point in the chapter, we've discussed analytics tools that fit into two basic models: programming languages that allow skilled developers to complete whatever analytic task faces them and specialized tools, such as spreadsheets, statistics packages, and machine learning tools that focus on one particular component of the analytics process.
Today, most organizations choose to adopt an analytics suite that provides powerful capabilities that cross all phases of an analytics process. These tools allow analysts to ingest and clean data, perform exploratory statistical analysis, visualize their data, produce models, make predictions, and communicate and report their results. These packages are normally more expensive than the other tools we've discussed, but they also provide an end-to-end environment where all of an organization's analysts and developers may work together on analytics projects.
IBM Cognos
IBM Cognos is an example of one of these integrated analytics suites. It uses a web-based platform to offer analysts within an organization access to their data and is backed by IBM's Watson artificial intelligence capability. The major components of Cognos include the following:
- Cognos Connection is a web-based portal that offers access to other elements of the Cognos suite.
- Query Studio provides access to data querying and basic reporting tools.
- Report Studio offers advanced report design tools for complex reporting needs.
- Analysis Studio enables advanced modeling and analytics on large datasets.
- Event Studio provides real-time data monitoring and alerting, allowing business leaders to be immediately notified when certain events take place and/or providing automated responses to those events.
- Metric Studio offers the ability to create scorecards for business leaders to quickly analyze key metrics from across the organization.
- Cognos Viewer allows stakeholders to easily interact with data and analyses prepared using Cognos.
Figure 6.14 shows an example of IBM Cognos's data exploration capabilities.
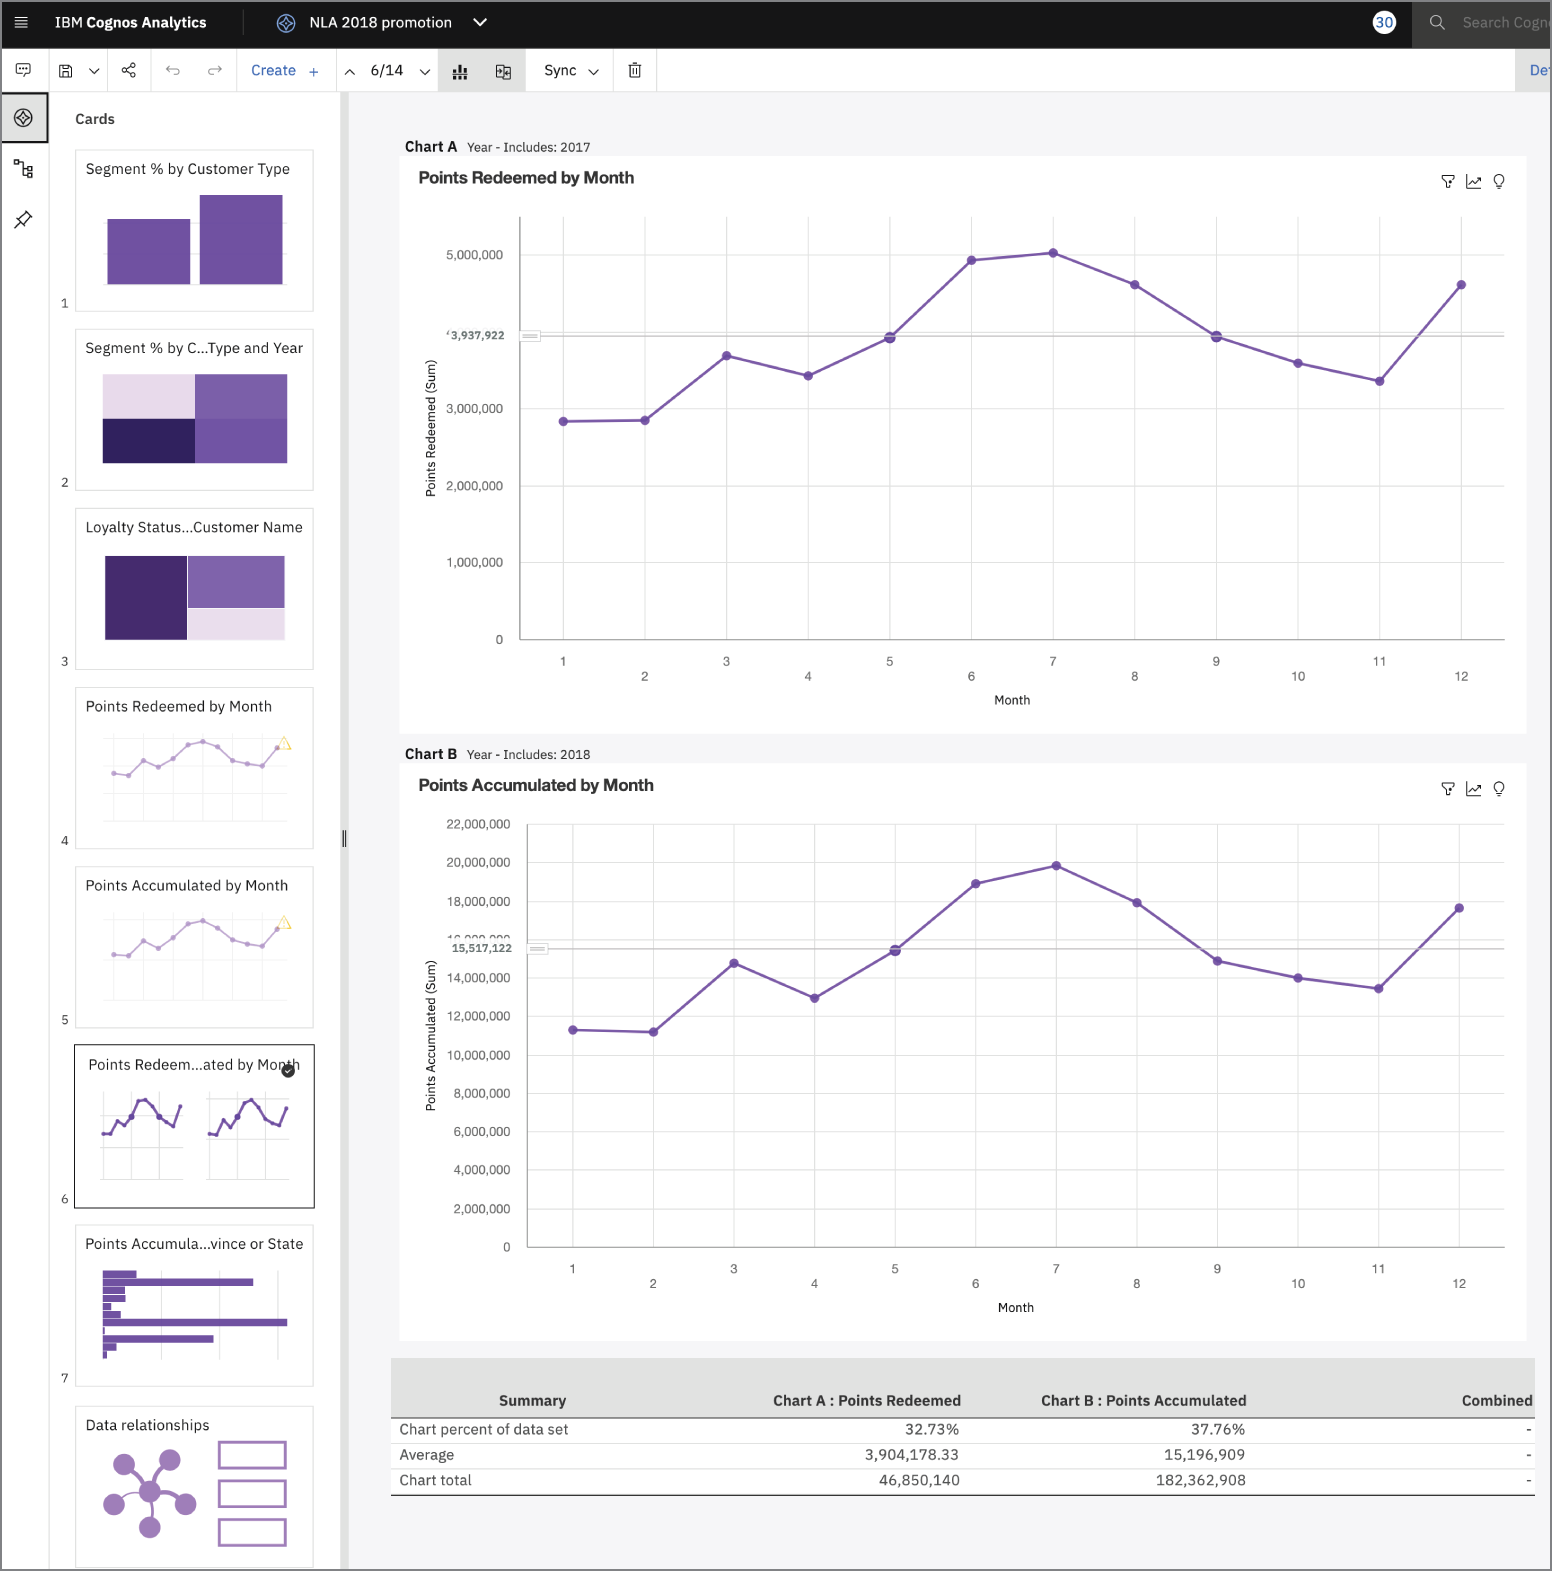
FIGURE 6.14 Exploring data in IBM Cognos
Power BI
Power BI is Microsoft's analytics suite built on the company's popular SQL Server database platform. Power BI is popular among organizations that make widespread use of other Microsoft software because of its easy integration with those packages and cost-effective bundling within an organization's Microsoft enterprise license agreement.
The major components of Power BI include the following:
- Power BI Desktop is a Windows application for data analysts, allowing them to interact with data and publish reports for others.
- The Power BI service is Microsoft's software-as-a-service (SaaS) offering that hosts Power BI capabilities in the cloud for customers to access.
- Mobile apps for Power BI provide users of iOS, Android, and Windows devices with access to Power BI capabilities.
- Power BI Report Builder allows developers to create paginated reports that are designed for printing, email, and other distribution methods.
- Power BI Report Server offers organizations the ability to host their own Power BI environment on internal servers for stakeholders to access.
Figure 6.15 shows an example of a complex visual dashboard built within the Microsoft Power BI environment to display important information about groundwater quality.

FIGURE 6.15 Communicating a story with data in Microsoft Power BI
MicroStrategy
MicroStrategy is an analytics suite that is less well-known than similar tools from IBM and Microsoft, but it does have a well-established user base. MicroStrategy offers many of the same tools as its counterparts, making it easy for users to build dashboards and reports and apply machine learning techniques to their business data.
Figure 6.16 provides an example of a dashboard built within the MicroStrategy tool to analyze the performance of a business against its goals.

FIGURE 6.16 Building a dashboard in MicroStrategy
Domo
Domo is a software-as-a-service (SaaS) analytics platform that allows businesses to ingest their data and apply a variety of analytic and modeling capabilities. It is not a very widely used tool, but knowledge of it is included in the objectives for the Data+ exam.
Figure 6.17 shows the use of Domo to analyze a dataset of information about restaurant health inspections performed by the city of Chicago.

FIGURE 6.17 Analyzing a dataset in Domo
Datorama
Salesforce Datorama is an analytics tool that focuses on a specific component of an organization's business: sales and marketing. It's not a general-purpose analytics tool but is instead focused on applying machine learning, visualization, and other analytics techniques to the sales and marketing process.
Figure 6.18 shows an example of an analysis of an organization's marketing efforts performed within Datorama.

FIGURE 6.18 Communicating a data story in Datorama
AWS QuickSight
AWS QuickSight is a dashboarding tool available as part of the Amazon Web Services cloud offering. This tool's power comes from the fact that it is available on a pay-as-you-go basis and its integration with the powerful data storage, data warehousing, machine learning, and artificial intelligence capabilities offered by the Amazon cloud.
Figure 6.19 shows an analysis of an organization's sales pipeline performed within AWS QuickSight.
Tableau
Tableau is arguably the most popular data visualization tool available in the market today. The focus of this tool is on the easy ingestion of data from a wide variety of sources and powerful visualization capabilities that allow analysts and business leaders to quickly identify trends in their data and drill down into specific details.
Figure 6.20 shows an example of obesity data for the United States visualized by county using Tableau.

FIGURE 6.19 Building a dashboard in AWS QuickSight

FIGURE 6.20 Visualizing data in Tableau
Qlik
Qlik is another popular SaaS analytics platform, offering access to cloud-based analytics capabilities. The major products offered by Qlik include the following:
- QlikView is the company's original analytics platform that focuses on providing rapid insights.
- Qlik Sense is a more advanced platform providing more sophisticated analytics capabilities (at a higher cost, of course!).
Figure 6.21 offers a financial analysis performed in Qlik Sense of an organization's operational processes from orders placed through fulfillment, billing, and receivables.
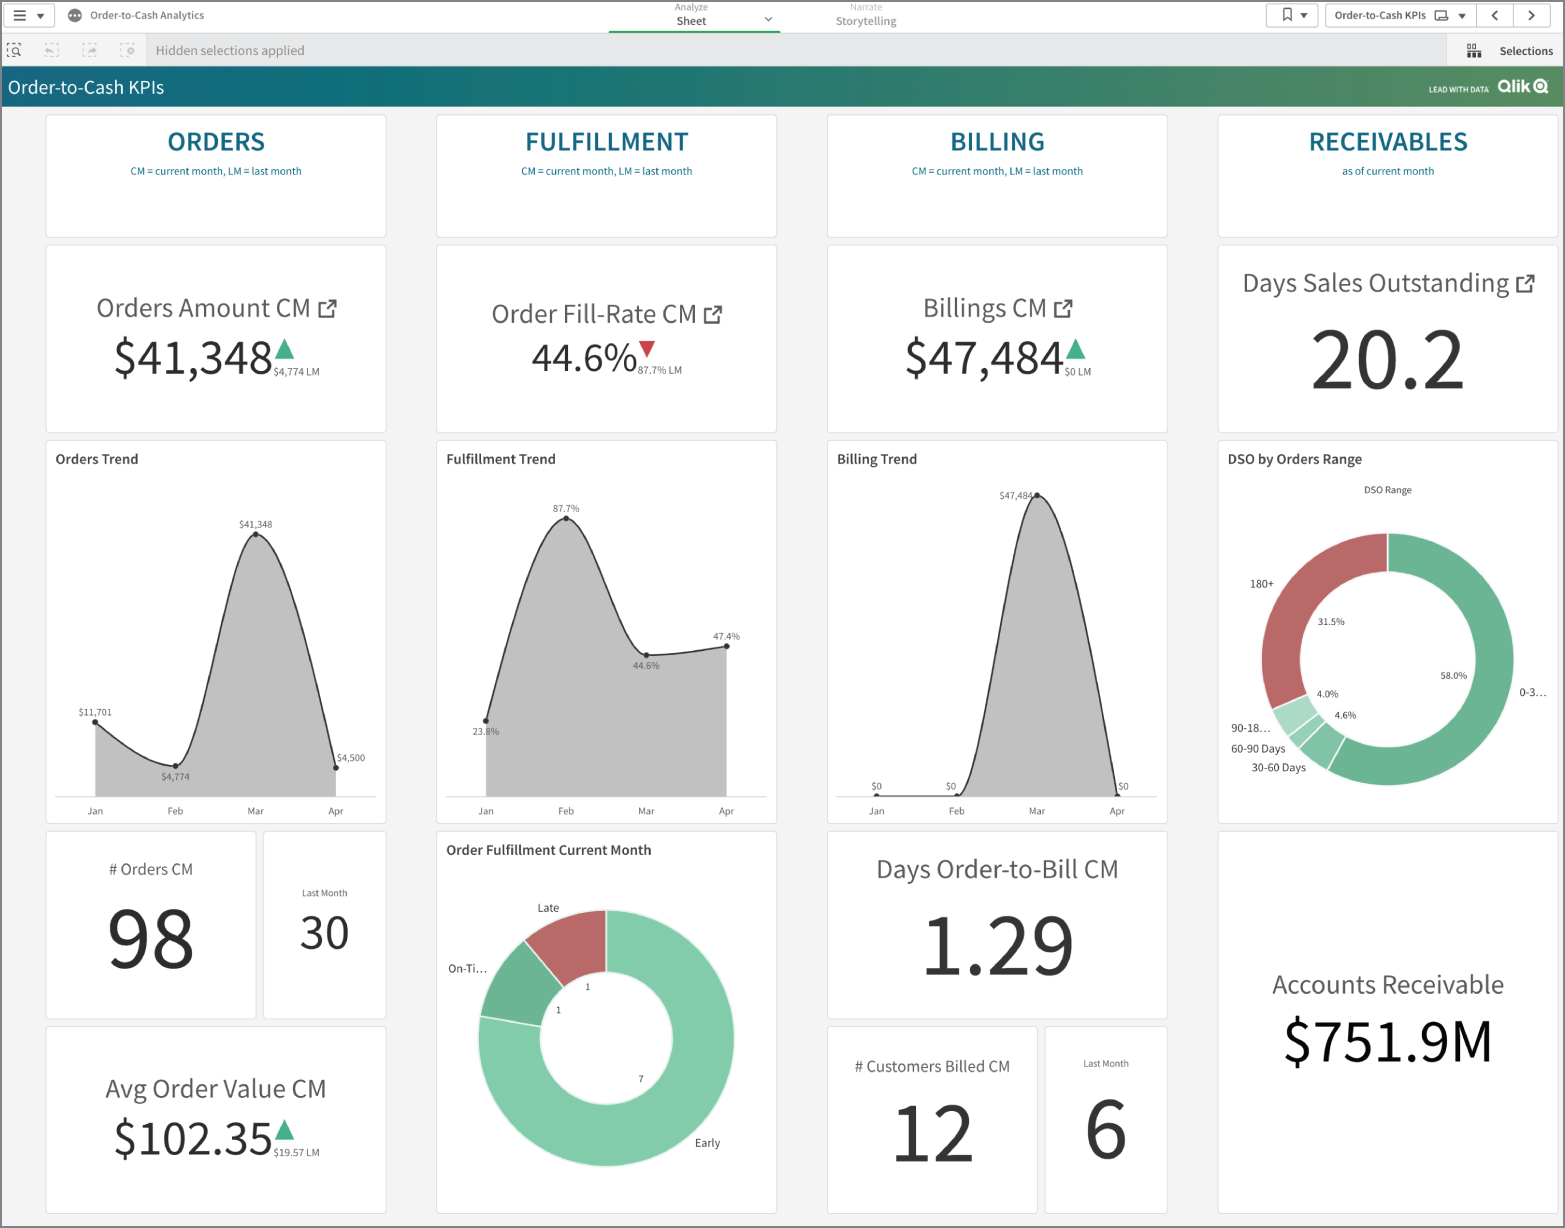
FIGURE 6.21 Visualizing data in Qlik Sense
BusinessObjects
BusinessObjects is an enterprise reporting tool from SAP that is designed to provide a comprehensive reporting and analytics environment for organizations. One of the strengths of this suite is the ability to integrate BusinessObjects reports with other applications, allowing organizations to integrate analytics into other portions of their workflow.
Summary
Data professionals have many different categories of tools at their disposal as they seek to achieve their organization's analytics goals. Spreadsheets are the simplest of these tools, offering a personal productivity solution that is quite flexible and easy to learn. For this reason, spreadsheets remain an indispensable tool in every organization. At the other end of the spectrum, programming languages, such as R and Python, provide software developers with the ability to create their own customized analytics tools.
The reality is that most organizations and analysts want tools that reside somewhere between these extremes. They want tools that are more powerful than spreadsheets, but they don't want to develop those tools themselves. That's where specialized packages that perform statistical analysis and machine learning as well as full-fledged analytics suites enter the picture. The modern analytics organization typically has one or more of these tools at their disposal as they standardize on a set of tools.
Exam Essentials
Describe the role of the spreadsheet in the modern organization. Spreadsheets are productivity software packages that allow users to create documents that organize any type of data into rows and columns. They are extremely flexible analytics tools that are available on most modern office computer systems and are very easy to use. The most commonly used spreadsheet software package is Microsoft Excel.
Understand how analytics teams use programming languages. Data professionals with coding skills often turn to programming languages to create their own software analysis tools. This approach frees them of the constraints of other packages and allows them to create software that directly meets their needs. The R programming language is designed specifically for analytics use and is quite easy to learn. Python is a general-purpose programming language that is more difficult to learn but can create virtually any software package.
Know how analysts and developers interact with databases. Relational databases are the primary data stores used in the modern organization. Analysts and developers may interact directly with databases using the Structured Query Language (SQL). SQL has two subcomponents. The Data Definition Language (DDL) defines the structure of the database and contains commands to create, alter, and destroy databases and tables. The Data Manipulation Language (DML) interacts with the data stored in a database and contains commands to add, retrieve, modify, and delete data.
Describe the role of statistical analysis software. Statistical analysis software provides access to advanced statistical environments that are accessible through a graphical user interface and/or a built-in scripting language. These software packages are commonly used by professional statisticians in their work. The statistical analysis software packages covered on the Data+ exam include IBM SPSS, SAS, Stata, and Minitab.
Describe the role of machine learning software. Machine learning packages offer a set of graphical tools designed to help analysts build machine learning models without requiring them to actually write the code to do so. These machine learning tools aim to make machine learning techniques more accessible. Analysts may still tune the parameters of their models but do not necessarily need to write scripts to do so. The machine learning software packages covered on the Data+ exam include IBM SPSS Modeler and RapidMiner.
Describe the role of data analytics suites. Data analytics suites provide powerful capabilities that cross all phases of an analytics process. These tools allow analysts to ingest and clean data, perform exploratory statistical analysis, visualize their data, produce models, make predictions, and communicate and report their results. The data analytics suites covered on the Data+ exam include IBM Cognos, Microsoft Power BI, MicroStrategy, Domo, Datorama, AWS QuikSight, Tableau, Qlik, and BusinessObjects.
Review Questions
- Ricky is a data analyst looking to begin developing his own applications to simplify some reporting and modeling tasks. He does not have experience programming and would like to use a language that will meet his analytics needs but be easy to learn. What language would best meet his needs?
- Python
- Ruby
- C++
- R
- Ann is using the Structured Query Language to retrieve information stored in a relational database table. What DML command should she use to specify the records she would like to retrieve?
INSERTUPDATESELECTCREATE
- Which one of the following statements about spreadsheets is incorrect?
- Spreadsheet software is available on most modern business computers.
- Spreadsheet software is easy to use.
- Spreadsheet software provides powerful machine learning capabilities.
- Microsoft Excel is the most common example of a spreadsheet.
- Kevin is helping prepare a computer for a professional statistician who will be performing some quality control analyses for his organization. Which one of the following tools is most likely to meet the statistician's needs?
- Tableau
- SPSS
- Cognos
- Excel
- Vincent is looking for a software package that will allow his team to create machine learning workflows by visually designing them. Which one of the following approaches would best meet his needs?
- Using RapidMiner
- Designing software in Python
- Designing software in R
- Using SAS
- Carla works for an organization that relies heavily on the machine learning and analytics tools offered by Amazon Web Services. She would like to select a dashboarding tool that will easily integrate with those other tools. What product would best meet her needs?
- QuickSight
- Cognos
- MicroStrategy
- Power BI
- Simone works for an organization that uses the Cognos analytics suite. What component of the suite could she use to best create scorecards for business leaders?
- Query Studio
- Report Studio
- Analysis Studio
- Metric Studio
- Lisa is an IT technician with a large organization that uses the Power BI analytics suite. A new data analyst is joining the organization and would like to have a tool installed on their laptop to create paginated reports. What tool would best meet this need?
- Power BI Desktop
- Power BI Report Server
- Power BI Report Builder
- Power BI service
- Xavier is a new data analyst who would like to learn a data visualization package. He would like to use software that specializes in data visualization, integrates with a large number of data sources, and is widely used across organizations. What tool would best meet his needs?
- Tableau
- Excel
- QuickSight
- Stata
- Bob is exploring analytics tools available from Qlik and would like to use a tool that is cost-effective and will get him up and running quickly. What tool would best meet his needs?
- Qlik Sense
- QlikCreate
- QlikView
- Qlik Suite
- Which one of the following is an enterprise reporting tool available from SAP?
- RapidMiner
- BusinessObjects
- Stata
- MicroStrategy
- Paul accidentally created a database table and would like to remove the entire table from the database. What Structured Query Language command would best meet his needs?
DELETEALTERUPDATEDROP
- Ty works for a sales organization that uses the Salesforce customer relationship management platform. He would like to produce some sales analytics quickly and needs a tool that would have the fastest integration time. What tool should he select?
- Qlik Sense
- QuickSight
- SPSS Modeler
- Datorama
- What Python library provides data analysts with access to tools that allow them to better structure data?
- Numpy
- TensorFlow
- pandas
- Keras
- Which one of the following is not a standard way for a relational database to receive commands?
- SQL query created within a graphical interface
- SQL query written directly by an end user
- Natural language query written by a customer
- SQL query created by software written in Python
- Wanda is selecting a tool to present analytics reports to business leaders. Which one of the following tools is most likely to meet her needs?
- Minitab
- SAS
- Power BI
- Stata
- Amanda works for an organization that uses the Cognos analytics suite. She would like to set up automated alerting that notifies leaders when one of the organization's stores experiences an out-of-stock situation. What component of Cognos would best meet her needs?
- Query Studio
- Event Studio
- Metric Studio
- Analysis Studio
- Gwen would like to modify the structure of an existing database table. What SQL command would best meet her needs?
UPDATEMODIFYDROPALTER
- Kelly is looking for a statistical analysis package for use by her organization's statisticians. Which one of the following tools would be least suitable for this purpose?
- Stata
- Minitab
- SPSS Modeler
- SAS
- Which one of the following commands would not be considered part of the Data Manipulation Language (DML)?
INSERTSELECTUPDATECREATE