
Appendix
Answers to the Review Questions
Chapter 2: Understanding Data
- D. While UA 769 contains numeric and text components, selecting an alphanumeric data type is the best option if you store this information in a single field. Since there is no date information contained in UA 769, the date data type is not appropriate.
- C. Voice transcripts are unstructured digital audio files. As such, the BLOB data type is the only viable choice. The alphanumeric, numeric, and date data types are all structured data types.
- D. In order to facilitate precise mathematical operations on financial data, a numeric data type is the most appropriate choice. Smallmoney does not support values in excess of $1 million. Both smallmoney and money are subject to rounding errors. While alphanumeric could be used to store financial records, the data would have to be converted to numeric in order to facilitate mathematical operations.
- B. At 45 minutes in length with an average of 102,400 KB per minute, each session would consume in excess of 4 GB of data ((45 * 102400) / 1024 / 1024). Only the BLOB data type in Oracle can accommodate binary data of that size. Microsoft SQL Server has a maximum size of 2 GB in the varbinary data type. The CLOB data type is limited to character data, and the numeric data type is limited to numeric data.
- B. Alexander should select a CLOB. The text of 1,168 pages greatly exceeds 4,000 bytes, so varchar is not an option. The numeric data type holds only numeric data, whereas the BLOB data type is used for binary objects.
- A. While defective or functional is categorical, the number of defects represents a count of an occurrence. As such, it is an example of discrete data. Since it is not possible to produce half a control arm, continuous is an inappropriate choice.
- A. Since shoes are available only in half-size increments, shoe size is considered discrete.
- B. As it is a measurement, Amdee's foot size is continuous. Shoe size is discrete, and categorical and alphanumeric are not appropriate in this case.
- D. The range of values and degree of precision for measuring temperature are virtually infinite, making temperature a continuous variable. As such, a numeric data type is preferred when compared with integer.
- B. Opinions are not numeric, so quantitative is not an option. Opinions vary widely, so they are not categorical. An opinion is an unstructured piece of text, so it is not dimensional. By definition, the text put into an open-ended response is qualitative.
- C. Spreadsheets are designed to manage structured data. Each of the data elements (check number, date, recipient, and amount) fit easily into appropriately titled columns. As such, this scenario describes structured data.
- A. A comma-separated values option supplies columnar structure with minimal overhead and is easy to ingest into Python. Plain-text or XML files would be harder to parse, and HTML is what is used to display the account export screen.
- A. Based on the name-value pairing, the absence of tabs or commas as delimiters, and the lack of tags, the API is expecting data to be formatted as JSON.
- A. Based on the name-value pairing, the absence of tabs or commas as delimiters, and the lack of tags, the API is expecting data to be formatted as JSON.
- A. A comma-separated values file can be imported natively into a Microsoft Excel spreadsheet. While Excel is capable of reading the other listed file formats, the data would not be processed into neatly organized rows and columns.
- C. In order for a person to interact with a web page, the web page needs to be packaged as HTML. While a web browser is capable of opening the other file types, Claire's JavaScript needs to be wrapped in HTML in order to function appropriately.
- C. Examining the data, you can see the curly braces containing key-value pairs. This is JSON data that can be rearranged to be more pleasing to the eye as follows:
[{"eventType": "start","sessionOffsetMs": 0,"mediaOffsetMs": 0},{"eventType": "playing","sessionOffsetMs": 3153,"mediaOffsetMs": 0},{"eventType": "stopped","sessionOffsetMs": 4818,"mediaOffsetMs": 559}] - D. Google Sheets can import tab- and comma-separated files but cannot process a composite delimiter.
- A. Since web server logs are generated automatically by a machine, this qualifies as machine data.
- B. Since Dave's data has both structured (client name, date of commission) and unstructured (thumbnail image) elements, it is semi-structured. Since Dave is creating the website on his own, this is not an example of machine data.
Chapter 3: Databases and Data Acquisition
- B. Key-value, column-family, and relational are not optimized for quickly identifying patterns in connected data, making a graph database the best choice.
- B. Foreign keys enforce referential integrity. A primary key uniquely identifies a row in a table. A synthetic primary key is system-generated.
- C. A data mart is too narrow, because Taylor needs data from across multiple divisions. OLAP is a broad term for analytical processing, and OLTP systems are transactional and not ideal for this task. Since Taylor is working with data across multiple different divisions, she will work with a data warehouse.
- D. Initial and delta loads describe how much data is moving. Although ETL is a reasonable choice, ELT is optimal.
- A. Both Start Date and End Date are necessary to understand when something happened. Middle Date is not a valid design criteria. Retrieving the current level of customer satisfaction is simple when you can match of the value of a flag variable in the where clause of a SQL statement.
- D. Avalanche and Quasar are not common design patterns. A Snowflake schema is more normalized than a Star schema, which means that queries against a Snowflake schema will have more joins. The more joins a SQL statement has, the more complex the query. With a Star, dimensions are one join away from a fact table, reducing query complexity.
- B. Static dimensions don't change over time. Counties are infrequently created, making C and D invalid choices. While the rate of change is low, counties do change over time, making county a slowly changing dimension.
- C. A snowflake approach is more normalized, has more complicated queries, and requires less space than a star approach. The number of records in a fact table has no bearing on whether to use a snowflake or star approach.
- A. While she may need to parse JSON to load the data into an OLAP environment, she is in danger of getting blocked if the terms of service prohibit programmatic data collection.
- B. The extract and load phases typically use database-centric utilities. Purging data also uses database-centric tools. Since Python is a programming language external to a relational database, Maurice's team's existing skills are most relevant to the transform phase.
- D. Surveys are completed by people, and public databases are unlikely to have information about a proprietary process. While Ellen may use sampling during her analysis, observation is the best approach for data collection.
- C. Manually checking for updated data is error-prone and not sustainable. While an API would be nice, it is not necessary for data that is updated monthly. Since the data changes once per month, George should not be satisfied with the initial data load. Since George wants data to be refreshed on a regular basis, it is best to automate the data retrieval and upload process.
- B. A complete purge and load removes historical data. ELT just changes the order in which data is loaded and transformed. While Martha may work with an ETL product, it is not necessary. Since Martha is prioritizing efficiency and wants to keep historical data in the data warehouse, copying over only the changed data with a delta load is the best approach.
- C. A survey would include any bias the production staff has. Testing a sample of finished goods does not inform Bob of what is happening during quality control, and historical trends would not account for any changes in the production process. Observing the final quality check process will let Bob see whether or not defects are being accurately reported.
- C.
COUNTwill return the number of rows.MAXwill return the largest value, whileAVGwill return the average of a numeric column. TheMINfunction returns the smallest value. - A. Since Elena focuses on transactions in Italy, she does not need data from the entire European Union. Creating a province-specific subset may make sense after her initial analysis is complete. To allow Elena to focus efficiently on just the Italian transactions, she can reduce the data by filtering out all data not associated with Italy.
- B. While ensuring an index on the county column is valid, it will not directly inform Jeff's analysis. Effective data logic may be necessary and would have to be to understand profitability over time—not just the profitability. Aggregating data at the county level does not inform analysis at the state or regional levels. Aggregating data at the region, state, and county levels lets Jeff perform the profitability trends at each organizational level.
- D.
SELECTidentifies columns,FROMidentifies tables, andWHEREfilters the results. TheORDER BYclause lets Gretchen sort the result set in chronological order. - D. Removing the personalization features disservices customers. While talking with a DBA or verifying the existence of the index on Customer_ID is useful, parameterizing the query will reduce parsing and improve performance.
- B.
STDDEVretrieves the standard deviation on a numeric column.SUMadds numeric values together, andMAXreturns the largest value in the column. TheCOUNTfunction returns the total number of rows in a table.
Chapter 4: Data Quality
- A. While invalid, redundant, or missing data are all valid concerns, data about people exists in three of the four systems. As such, Jackie needs to be on the lookout for duplicate data issues.
- C. Since the value –10 exists, this is not a case of missing data. With the data coming from a single source, it is not duplicate data. As the values exist over time, the data is not redundant. Since it's not possible to have negative rainfall, this is a case of invalid data.
- C. Since the data is for a single movie and comes from a single dataset, it is neither redundant nor duplicate. Since the data exists, it is not missing. While star is a valid word, it isn't a valid movie genre; as such, this is an example of invalid data.
- D. Since the data comes from multiple hospitals, the possibility of duplicate or redundant data exists. Although invalid data is certainly possible, the fact that an aggregation function in a programming language returned an error indicates that some values are missing.
- D. There is no specification that dictates the price of concrete, so this is not a specification mismatch. The order of concrete pricing doesn't matter, which eliminates nonparametric data, and duplicate data doesn't make sense in this context. Since reported prices are significantly greater than in comparable countries, this is an example of a data outlier.
- A. There may be duplicate or redundant data in the dataset, and an individual film might be an outlier. However, this scenario describes nonparametric data.
- A. Since the data is coming from a single, well-designed system, redundant or duplicate data is unlikely. While outliers may exist, they do not cause database loads to fail. Since the data is coming from a well-designed transactional system, Raphael needs to validate the incoming data types to ensure they load into the data warehouse successfully.
- C. The choice here is between redundant and duplicate data. In this case, Jorge is sourcing data from multiple systems, and redundant data comes from a single system, so duplicate is the correct answer.
- B. Since Lars has numeric data and categorical definitions, there is no need to merge, impute, or parse the wind speed data. Since Lars is interested in Category 5 hurricanes, he needs to recode any windspeed value in excess of 157 miles per hour into Category 5.
- D. Conversion and transposition are not necessary. While deriving an indicator may be beneficial, it is less valuable than merging the data from multiple sources.
- B. As a data analyst, Ashley needs to work with IT to modify an ETL process. While she may be recoding or concatenating as part of this temporal work, Ashley is actively blending data.
- B. It doesn't make sense to concatenate product IDs together, because you lose the ability to identify individual products. While some data may need recoding as numeric and price should be numeric, the ETL should append data from the four systems into a single, wide table.
- A. Calculating an average is a single function call that produces unexpected results only when there is an underlying issue with the data. While looking online for the correct price may be useful to verify her hunch, checking for nulls herself is the best approach.
- C. Since Sebastian wants to retain granular data, neither reducing the number of observations nor aggregating the data is the best approach. There is no need to normalize the income data. Since Sebastian is only interested in income data, he can remove the data that is superfluous.
- D. While removing rows will nulls is appropriate, she needs to transpose by product category and summarize. Transposing by sales price or region will not help her current analytical goal.
- B. Aggregation comes into play if there is a need to summarize the data by person. It is unlikely that a new column is needed for each Full Name. Dropping all missing values is a possibility, but not the best choice. Separating the Full Name into First, Middle, and Last Name columns allows Randall to easily sort and aggregate by each component of the name.
- A. Aggregation is a good way to summarize data. Trusting his instincts does not help with model accuracy. Edgar may have normalized attributes during model creation. By cross-validating, Edgar can create a subset to train his model and another subset to test the accuracy of his model.
- B. Accuracy is for measuring how an attribute and its intended use. Consistency measures an attribute's value across systems. Validity ensures an attribute's value falls within an expected range. While all of these dimensions are important, completeness is foundational to Jane's campaign.
- C. Accuracy is for measuring how an attribute and its intended use. Completeness measures the minimum viable data necessary for a business objective. Validity ensures an attribute's value falls within an expected range. While all of these dimensions are important, ensuring the consistency of customer data across two different source systems is crucial to Ron's work.
- A. Completeness measures the minimum viable data necessary for a business objective. Consistency measures an attribute's value across systems. Validity ensures an attribute's value falls within an expected range. While all of these dimensions are relevant, measuring a javelin in kilograms indicates a lack of accuracy.
Chapter 5: Data Analysis and Statistics
- C. Sandy needs sample data. An observation is the weight of a single gorilla, and the population is all silverback gorillas, which Sandy will be unable to weigh. A specific weight, like 369 pounds, is an observation of the weight variable.
- D. The interquartile range is a dispersion measure that includes the second and third quartiles, which contains 50 percent of the values in the dataset. The median represents the value in the middle of a sorted numeric list, the mode is the most frequently occurring value, and the mean is the average of all values. Median, mode, and mean are all measures of central tendency.
- C. The mode is the most frequently occurring value, which is useful when working with categorical data like automotive color. The mean is the arithmetic average, the median represents the value in the middle of a sorted numeric list, and the range is the measure from minimum to maximum, which includes any outliers in the data.
- C. The null hypothesis presumes the status quo, which in this case is that families are not willing to pay more for rooms near the swimming pool. Jenny is testing whether families are willing to pay more, so that rules out options B and D. Option A represents the alternative hypothesis.
- D. Since the null hypothesis is that the proportion of green M&Ms is 24 percent, no more, no less, the alternative hypothesis must be that the proportion of green M&Ms is not 10 percent. While a proportion of greater than or less than 10 percent would point to the alternative hypothesis, the alternative hypothesis is that the proportion of green M&Ms is not 10 percent.
- D. Since you are trying to determine whether sales increased above the current average of $8,000, the population mean for the null hypothesis is 8,000, whereas the mean for the alternative hypothesis is greater than 8,000. Hypotheses are always stated in terms of the population you are working with, ruling out options A and B. The test is whether sales are higher than the average of $8,000 per day, which rules out option C.
- D. To get the mean, you add all the numbers of the dataset together and divide by the number of observations:
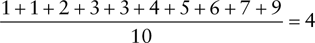
1 is the minimum, 1 and 3 are the mode, and 3.5 is the median.
- C. To calculate range, subtract the minimum (1) from the maximum (8).
- C. Recall that the for a sample with even numbers, you calculate the median using the following formula:
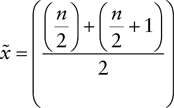
In this case,
 and
and  . With those two numbers, you can proceed with calculating the median as follows:
- A. This statement describes a false positive (Type I error), when you reject the null hypothesis when you should accept it. A Type II error is a false negative, accepting the alternative hypothesis when you should accept the null hypothesis.
- C. Degrees of freedom is defined as 1 less than the total number of observations.
- D. Ari is assessing the relationship between categorical variables and should use a chi-square test. Both the Z-test and t-test compare numeric variables, whereas simple linear regression is used for determining whether you can infer the value of a dependent variable using the value of an independent variable.
- C. Simple linear regression explores the relationship between two variables, in this case the weight of an athlete and their time in a 400-meter run. Both the Z-test and t-test infer attributes of the population using sample data. A Chi-square test explores the relationship between categorical variables.
- C. A left skewed distribution typically has a mean less than the median, with the tail representing the lowest score.
- B. Recall that the for a sample with even numbers, you calculate the median using the following formula:

With an
 of 16,
  and
and  . With those two numbers, you can proceed with calculating the median as follows:
- D. Link analysis explores connections patterns between data points, making it ideal for social network analysis. Trend analysis compares data over time, performance analysis assesses measurements against defined goals, and exploratory data analysis uses descriptive statistics to summarize data and provide context for ongoing analysis.
- A. Trend analysis compares data over time. Performance analysis assesses measurements against defined goals, exploratory data analysis uses descriptive statistics to summarize data and provide context for ongoing analysis, and link analysis explores connection patterns between data points.
- B. Performance analysis assesses measurements against defined goals. Trend analysis compares data over time, exploratory data analysis uses descriptive statistics to summarize data and provide context for ongoing analysis, and link analysis explores connection patterns between data points.
- C. According to the empirical rule, 95 percent are within two standard deviations. The rule also states that 68 percent of values are within one standard deviation, and 99.7 percent are within three standard deviations.
- C. Exploratory data analysis can help orient Vidar to the data, including summary statistics and identification of outliers across datasets. Trend analysis compares data over time, performance analysis assesses measurements against defined goals, and link analysis explores connection patterns between data points. As Vidar is encountering this data for the first time, he should check for outliers as part of his orientation process.
Chapter 6: Data Analytics Tools
- D. R is a programming language that is focused on solving analytics problems and is well known for its ease of learning. Python, Ruby, and C++ are all general-purpose programming languages that are not focused on analytics and would have a steeper learning curve.
- C. The
SELECTcommand is used to retrieve information from a database. It's the most commonly used command in SQL as it is used to pose queries to the database and retrieve the data that you're interested in working with. TheINSERTcommand is used to add new records to a database table. TheUPDATEcommand is used to modify rows in the database. TheCREATEcommand is used to create a new table within your database or a new database on your server. - C. Spreadsheets are indeed widely used because they are easy to use and available on most modern business computers. The most commonly used spreadsheet is Microsoft Excel. Spreadsheets do not, however, provide powerful machine learning capabilities.
- B. SPSS is a professional statistical analysis package and is the most likely choice of a professional statistician of the options presented. Excel is a spreadsheet that does not offer the powerful statistical tools offered by SPSS. Tableau is a data visualization package. Cognos is a fully functional analytics suite that would not be installed on a single user's computer.
- A. RapidMiner is a machine learning tool that specializes in creating the visual designs that Vincent seeks. SAS is a statistical analysis package that is not used to create machine learning workflows. Vincent could create his own machine learning software in Python or R, but it would lack the visual workflow he desires.
- A. It is likely that any of these tools could meet Carla's needs. However, the key requirement mentioned here is the tight integration with AWS services. AWS QuickSight is an AWS service itself, so it would be the best way to meet Carla's business requirements.
- D. It is feasible that Simone might be able to create a scorecard using any of these tools. However, Metric Studio is the best tool for the job because it is designed to create scorecards for business leaders seeking to analyze key metrics from across their organizations.
- C. Power BI Report Builder is a desktop tool that developers can use to create paginated reports. Report Server is a server-based tool where developers may publish those reports. Power BI Desktop is also a desktop tool, but it does not create paginated reports. The Power BI service is a SaaS offering of Power BI that would not be installed on an analyst's computer.
- A. Tableau is arguably the most popular data visualization tool available in the market today. The focus of this tool is on the easy ingestion of data from a wide variety of sources and powerful visualization capabilities that allow analysts and business leaders to quickly identify trends in their data and drill down into specific details. Excel is a spreadsheet that offers only limited visualization capabilities. Stata is a statistical analysis package that also offers limited capabilities for visualization. QuickSight is a tool from AWS that is primarily focused on building dashboards.
- C. The two primary tools available from Qlik are QlikView and Qlik Sense. QlikView is the original analytics platform offered by the company that focuses on providing rapid insights. Qlik Sense is a more sophisticated platform offering advanced analytics capabilities at a higher cost.
- B. BusinessObjects is an enterprise reporting tool from SAP that is designed to provide a comprehensive reporting and analytics environment for organizations. RapidMiner is a machine learning package. Stata is a statistical analysis package. MicroStrategy is an analytics suite, but it is made by a company named MicroStrategy and not SAP.
- D. The
DROPcommand is used to remove an entire database or table from a database. TheDELETEcommand is used to remove rows from a table but does not remove the table itself. TheUPDATEcommand is used to modify rows within a table, while theALTERcommand is used to modify the structure of a database or table. - D. Datorama is a marketing analytics tool made by SalesForce, so it is likely the best answer to Ty's needs. QlikSense and QuickSight may also be able to produce the results Ty needs, but they will likely have a longer integration time. SPSS Modeler is a machine learning tool and would not be able to produce the required report.
- C. The Python Data Analysis Library (pandas) provides a set of tools for structuring and analyzing data. The Numpy package is used for numerical analysis. TensorFlow is used for high-performance numerical calculations. Keras is used for artificial intelligence applications.
- C. Relational databases do not natively understand natural language queries. Any queries sent to a relational database must be written in SQL. This SQL may be written directly by an end user, created by an end user within a graphical interface, or written by software created in any other programming language. Natural language query applications seeking to retrieve data from a relational database must first translate that query into SQL before sending it to the database.
- C. Minitab, SAS, and Stata are all statistical analysis packages that are unlikely to produce any reporting fit for consumption by a business leader. Power BI, on the other hand, is an analytics suite that produces highly visual reports that would be ideal for sharing with a business leader.
- B. Event Studio provides real-time data monitoring and alerting, allowing business leaders to be immediately notified when certain events take place and/or providing automated responses to those events. Therefore, it would be the best choice for Amanda's needs.
- D. The
ALTERcommand is used to modify the structure of an existing database or database table. TheUPDATEcommand is used to modify the data contained within a table, but not the table itself. TheDROPcommand is used to delete an entire table or database. TheMODIFYcommand does not exist. - C. SPSS Modeler is a machine learning tool that does not directly perform statistical analyses. Be careful not to confuse SPSS Modeler with the base SPSS software, which is a statistical analysis package. Stata, Minitab, and SAS are all statistical analysis packages that Kelly should consider.
- D. The Data Manipulation Language (DML) contains the commands used to work with the data contained within a database. DML includes the
SELECT,INSERT,UPDATE, andDELETEcommands. TheCREATEcommand is used to create a new database or table and is a component of the Data Definition Language (DDL).
Chapter 7: Data Visualization with Reports and Dashboards
- C. Real-time reports reflect data at the moment the report runs. Hourly reports update every hour. Weekly reports update every week. Since the manager needs 3 days of lead time, a daily report is the best option.
- A. While red/green, blue/orange, and yellow/purple are all complementary colors, the volume of printed reports means Jasmine should select a cost-effective color scheme that can be printed on any black-and-white printer.
- B. The title page describes the title of the report and isn't appropriate for a paragraph. The appendix contains details that aren't necessarily relevant to the reader. While the report body could contains this kind of paragraph, it should be highlighted in the executive summary.
- B. A scatter chart is an effective way to visualize the relationship between two numeric variables.
- D. Since John's CEO wants to explore retail sales data, that rules out any type of static report.
- A. As Ron is new to the organization, he needs to familiarize himself with corporate brand standards and any existing templates prior to working on distribution.
- B. While Kelly needs feedback from the appropriate stakeholders, doing so without a watermark could lead them to believe the report they receive is the final product.
- C. While all of the answers are relevant to determining requirements, Maggie should focus on key performance indicators for the organization as a whole.
- B. Wireframes define the basic structure and content of a dashboard. A mockup provides details about the visual elements of a dashboard. Data marts and data warehouses are source systems.
- D. A line chart shows the relationship of two variables, in this case sales data and time. A pie chart is best for categorical data, a tree map is for hierarchical data, and a histogram is for frequency data.
- A. Since Celine is looking at South America, a geographic heat map is the best choice to contextualize precipitation.
- C. Using a word cloud to signify the relative importance and commonality of words is the best approach.
- D. A heat map uses color and location to illustrate significance, making highly correlated variables appear hot. A tree map is best for hierarchical data, a bar chart works well for categorical data, and an infographic is an effective tool for telling a story.
- C. An infographic combines data with images and text to tell a compelling story. A tree map is best for hierarchical data, a bar chart works well for categorical data, and a heat map works well in a spatial context.
- A. Tree maps are ideal for illustrating proportional relationships and are well-suited to interactive applications that facilitate data exploration by the user. A bar chart works well for categorical data, an infographic is an effective tool for telling a story, and a heat map works well in a spatial context.
- A. A bubble chart illustrates the relationship between three variables. A bar chart works well for categorical data, an infographic is an effective tool for telling a story, and a heat map works well in a spatial context.
- B. Since a stacked bar chart incorporates proportional segments for categories within each bar, it is effective at illustrating the percentage of brand profitability. A bubble chart works well for showing the relationship between three variables, an infographic is an effective tool for telling a story, and a heat map works well in a spatial context.
- C. An infographic combines data with images and text to tell a compelling story. A bubble chart works well for showing the relationship between three variables, a stacked bar chart is useful for showing proportional segments for categorical data, and a heat map works well in a spatial context.
- D. A bubble chart works well for showing the relationship between three variables, a stacked bar chart is useful for showing proportional segments for categorical data, and an infographic is for telling a story. Since the CFO wants to drill into data, that necessitates an interactive dashboard.
- D. A scatter chart uses a dot for each observation, allowing the user to see the relationship between two variables for every data point. A bubble chart works well for showing the relationship between three variables, a stacked bar chart is useful for showing proportional segments for categorical data, and an infographic is for telling a story.
Chapter 8: Data Governance
- D. A data owner is a senior leader over a functional unit, a data custodian is someone who implements technical controls, and a data janitor is not a valid role. By definition, a data steward is the role that is responsible for an organization's data governance initiatives.
- A. A data steward is responsible for looking after an organization's data, a data custodian is someone who implements technical controls, and a data janitor is not a valid role. Senior functional leaders serve as data owners for their domains.
- B. A data steward is responsible for looking after an organization's data, a data owner is a senior leader over a functional unit, and a data janitor is not a valid role. By definition, a data custodian implements technical controls to further data governance objectives.
- D. Highly Sensitive data is reserved for restricted use. Public applies to data intended for public consumption, Internal applies to data for use within an organization, and Sensitive applies to data that is for limited use within an organization.
- A. Public applies to data intended for public consumption. Internal applies to data for use within an organization, Sensitive applies to data that is for limited use within an organization, and Highly Sensitive data is reserved for restricted use.
- C. Sensitive applies to data that is for limited use within an organization. Public applies to data intended for public consumption, Internal applies to data for use within an organization, and Highly Sensitive data is reserved for restricted use.
- B. Internal applies to data for use within an organization. Public applies to data intended for public consumption, Sensitive applies to data that is for limited use within an organization, and Highly Sensitive data is reserved for restricted use.
- C. With role-based access, Clarence should create a data access role that allows each person in a group to perform their job function. Five groups with three roles per group comes out at 15 roles.
- C. To keep his organizational data secure, Zeke needs to encrypt his data at rest as well as during transmission.
- D. Maxine wants to ensure she is using HTTPS, which browsers illustrate with a closed padlock.
- A. While aggregation is an option, it's not viable for individual images. While the data need to be encrypted, especially in transit, it is more important to deidentify. The sort order does not matter.
- D. Linux, macOS, and Windows all support local encryption.
- B. Since a person can have multiple job roles, there needs to be a foreign key in the Job Role table referring to the identifier in the Person table.
- C. SFTP and SCP are encrypted transfer protocols, whereas HTTPS is encrypted web traffic. Cindy can replace production sensitive data with synthetic data she generates, effectively masking the production data.
- C. The point of this question is that using zip code, sex, and birth date, it is possible to reidentify individuals making personal privacy at risk.
- B. Passport number, credit card number, and address are all considered PII. While favorite food is a preference, it cannot uniquely identify an individual.
- D. Account number, fingerprint, and email address are all considered PHI. While color preference is a preference, it cannot uniquely identify an individual.
- C. PCI has no notification requirement. PII is jurisdiction-dependent, PHI has a 60-day requirement, and GDPR has a 72-hour requirement.
- A. Name, account number, and expiration date are all classified as Cardholder Data under PCI DSS. By definition, PIN is considered Sensitive Authentication Data.
- B. Acquisitions, mergers, and compliance activities are all situations that can cause an organization to pursue MDM. Arbitration is a process what settles organizational disputes and is not likely to lead to MDM activities.
..................Content has been hidden....................
You can't read the all page of ebook, please click here login for view all page.