
CHAPTER 13
Decision Support Capabilities
The ultimate goal of the corporate information factory (CIF) is to get the right information into the right people’s hands when they need it. Much of what we have discussed so far covers the design and implementation of the infrastructure to accomplish this goal.
In this chapter, we focus on how these components work together to enable decision support capabilities.
First, we cover the decision support capabilities available today that are used to solve a business user’s difficult strategic and tactical problems. These capabilities use data marts for strategic analysis and oper-marts for tactical analysis. The foundation for the data marts is, of course, the data warehouse. The data warehouse not only supplies integrated, high-quality, static data to the marts, it also acts as the repository of strategic historical data. For these reasons and others, the data warehouse is a mandatory part of the strategic analysis infrastructure.
Data marts will be discussed next. These structures are subsets of strategic data provided by the data warehouse and have different database designs depending on the business problem(s) they solve. How and when to use the different types of data marts and data mart designs are discussed.
Next, we talk about two interesting forms of DSS applications coming to the fore in this environment: ERP applications and e-business. The ERP vendors are offering some interesting new strategic applications built from the strength of their integrated operational capabilities. As with any self-contained condition, some good things and some less than optimal considerations must be taken into account.
Additionally, we take a look at e-business. E-business is one of the most challenging business ventures we have seen in years. The CIF has a significant role in ensuring the success of a corporation using the Web to conduct its business. A natural fit exists between the CIF infrastructure and the “click and mortar” companies that you need to understand before implementing your e-business strategy.
We then turn our attention to the more tactical requirements for data. The interaction between the data warehouse and the operational data store is an often overlooked yet very important relationship. The need to obtain strategic information in a real-time mode is becoming more and more essential. Small amounts of pre-aggregated or pre-analyzed data must be available to the business user for immediate decision-making. We discuss a mechanism to satisfy the need for both strategic and tactical data in a high-performance situation.
This leads into our next discussion. Another new need is for tactical analyses performed on operational data. This need has been the genesis of a new structure called an oper-mart. Small subsets of operational data can be extracted and loaded into a multidimensional structure (hypercube or star schema) for instant analysis and tactical decision-making.
We end the chapter with a discussion of the “off-the-shelf,” commercially available applications for both strategic and tactical decision support. The vendor community is beginning to offer generic DSS applications such as Risk Management or Customer Relationship Management (CRM) in which the database schema and access methods are already set up. All you do is add data. These off-the-shelf or commercial applications show great promise. However, you must be diligent in determining if these “data marts in a box” are appropriate for your company. Therefore, we offer as a last section a set of guidelines to use when selecting one of these commercial applications.
Putting the Role of the Data Warehouse Into Context
The key to the integrity and ease of maintenance of your decision support applications is to have a repository of high-quality, stable data. The data warehouse is an ideal foundation for building these data marts. The data warehouse contains the basic ingredients that ensure the success of your strategic analytical environment:
![]() Integrated data
Integrated data
![]() Historical data
Historical data
![]() Easily accessible data
Easily accessible data
Each of these aspects beautifully supports the construction of data marts (Figure 13.1).
The foundation provided by the data warehouse is very strong. The integration of data is important when trying to achieve a corporate view. Without integration, a corporate perspective is difficult to achieve. When data is integrated on a one-time basis only (as is the case for a temporary “staging area”), an integrated view is possible, but repeated uses of the data are very unlikely. When an integrated foundation is created on a permanent basis (an enduring data warehouse structure), not only is an integrated perspective easily achievable and reusability of the data possible, but also different analyses performed over a lengthy period of time can be reconciled, should there be a need. It is from this stable foundation that we recommend you begin building your data marts.
The Data Warehouse Adds Depth to Data
The data warehouse provides data marts with integrated data that can be used to give data more “depth” that is otherwise not possible. As an example of the depth that can be created with integrated data, consider the CRM need to understand customers holistically. Figure 13.2 shows the need for a holistic approach to data. Every person contacting the customer (via the Customer Touch Zone), regardless of who it is, should start with their understanding of who the customer is, what interactions have happened in the past, and what value the customer brings to the business in the future—commonly referred to as lifetime value. This ensures that the corporation has a consistent voice to the customer.
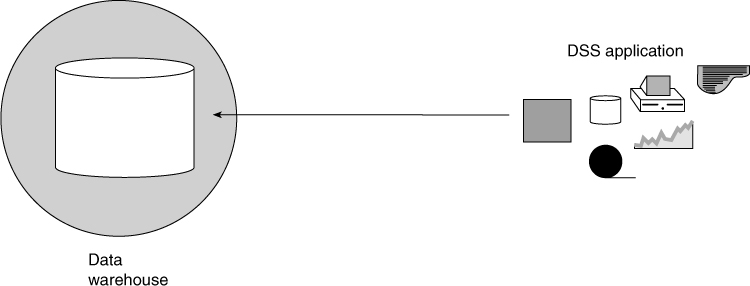
Figure 13.1 Why DSS applications find the data warehouse attractive.
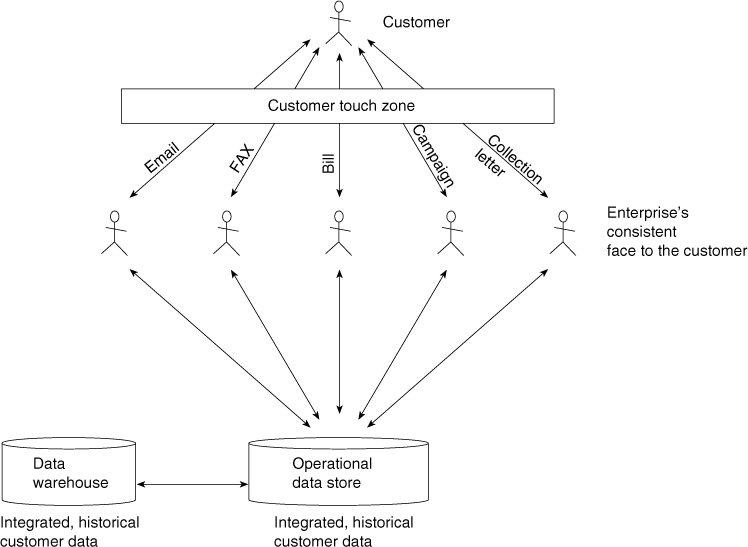
Figure 13.2 An integrated database of historical (data warehouse) and current (operational data store) data is used for very customer touch.
To illustrate the usefulness of an integrated, holistic approach to managing customers, consider a salesperson with two prospects: Tom Jones and Barry Wilson. If all the salesperson knows about Tom and Barry is their name and address, the salesperson has a hard time understanding what will appeal to them, how he should approach them, and what products best suit them. Going into a sales proposition with little or no information about the prospective customers minimizes any chance of a sale or, worse, of irritating the customer.
But now suppose a host of integrated information about the customers is available to the salesperson before the sales. The salesperson knows the following:
![]() Tom is single and has never been married. He has used the corporation’s products consistently for four years. Tom rents an apartment and watches a lot of TV. Tom works as a clerk for the local electric utility and drives a motorcycle on the weekends. He calls his sister in Seattle every Sunday and pays his bills attentively, often correcting mistakes he finds in them.
Tom is single and has never been married. He has used the corporation’s products consistently for four years. Tom rents an apartment and watches a lot of TV. Tom works as a clerk for the local electric utility and drives a motorcycle on the weekends. He calls his sister in Seattle every Sunday and pays his bills attentively, often correcting mistakes he finds in them.
![]() Barry is married to Susan and they have three children. Barry is the head of a 200-person law firm. He lives on a 10-acre estate on the outskirts of town. He is a new customer to the corporation and may not stay long if irritated with his service. Barry plays golf at the local country club and was a former golf star in college. He drives a luxury car and is often late in paying his bills.
Barry is married to Susan and they have three children. Barry is the head of a 200-person law firm. He lives on a 10-acre estate on the outskirts of town. He is a new customer to the corporation and may not stay long if irritated with his service. Barry plays golf at the local country club and was a former golf star in college. He drives a luxury car and is often late in paying his bills.
Now that the salesperson has a lot of background information (depth) about Tom and Barry, he can formulate a strategy using the warehouse and marts as to what might work and what probably won’t work when it comes to making a sale. He then uses the ODS to determine the best method of contact (email, phone call, fax, mailing, and so on) for each individual. The ODS supplies the most accurate contact information for the sales person as well as the best channel to use. The sales person determines the following strategy for each customer:
![]() Tom is unlikely to be interested in life insurance, but he may well want accident and injury insurance. Also Tom would like to receive a paper bill every month and prefers to pay his bill which a check. The sales person should contact Tom via phone.
Tom is unlikely to be interested in life insurance, but he may well want accident and injury insurance. Also Tom would like to receive a paper bill every month and prefers to pay his bill which a check. The sales person should contact Tom via phone.
![]() Barry, on the other hand, needs life insurance and he is a likely candidate for whole life insurance. He definitely would like to pay his bill via EFT rather than via a check. Barry should be contacted via email followed up by a personal letter or phone call.
Barry, on the other hand, needs life insurance and he is a likely candidate for whole life insurance. He definitely would like to pay his bill via EFT rather than via a check. Barry should be contacted via email followed up by a personal letter or phone call.
The addition of integrated historical data about a prospect makes the sales effort efficient and directed. Without this background information, both Barry and Tom appear to be “flat.” The integrated information brings out the differences, giving great depth to the individuals and understanding to the salesperson, thus greatly enhancing the prospects of a sale.
But integration of information is not the only desirable feature of data found in the data warehouse. The fact that the data warehouse contains historical data is equally important.
The Dimension of History
One of the defining characteristics of the data warehouse is its storage of historical data. This data is extremely useful in a number of data marts. As a sample of its usefulness, the following example is given:
In the CRM environment, historical data is very important in predicting the future. This ability to predict the future may be somewhat indirect and obtuse, but it is very valuable to your corporation. The reason why historical data is so useful in predicting the future is that customers (both individuals as well as businesses and governments) are creatures of habit. The habits formed early on tend to stick with us throughout our lives. It is very unusual for an individual or organization to undergo a dramatic and complete change of lifestyle. If lifestyles change at all, they change slowly and predictably. For example, the majority of individuals go through these life stages:
![]() Young college student or beginning wage earner
Young college student or beginning wage earner
![]() Wage earner, no kids
Wage earner, no kids
![]() Wage earner with young kids
Wage earner with young kids
![]() Wage earner with college kids
Wage earner with college kids
![]() Empty nester
Empty nester
![]() Early retirement
Early retirement
![]() Late retirement
Late retirement
As a consequence of this nature of people, the past becomes a powerful predictor of the future when it comes to people and organizations. A high lifetime value or a potentially high lifetime value customer is an invaluable asset to your corporation. A low lifetime value customer may not be someone you should spend your time on. You need to understand what type of customer you are interacting with and deal with them appropriately. By having this robust source of historical data, your analysts can predict the next life stage that customers are most likely to go through, customize their products/campaigns for that stage, and cross-sell appropriate products according to the prediction.
For example, a married couple with two teenage children is likely to be looking for ways to fund their kids’ college expenses. A savvy CRM person would know this and offer loans (second mortgages, signature, and so on) appropriate for the couple’s impending change in life stage. For this reason then, the historical data found in the data warehouse becomes very useful to the world of data marts.
Easily Accessible Data
Finally, the data warehouse brings disparate data together into a consistent format and technology. By storing the data in an open, easily understood environment, it becomes a simple process to dip into this data pool and extract what you need over and over for your particular analytical needs.
The metadata that goes along with the data warehouse is invaluable in determining what data you should use in the ultimate analytical environment. The enterprise view is upheld by the metadata definitions and descriptions of each entity and attribute in the warehouse.
This stable repository can also serve to improve the quality of the data you offer to your business community. The data warehouse can be researched, analyzed, and scoured for data defects. Monitoring it for quality is the single best way to determine which of your operational systems is producing low-quality data.
Now that we have established that the data warehouse is the perfect foundation for data marts, let’s turn our attention to analytical applications. First, we will discuss strategic ones (the data marts) and then we will examine the tactical ones (ODS and oper-marts).
Putting the Data Mart into Context
The data mart is customized or summarized data that is derived from the data warehouse and tailored to support the specific analytical requirements of a given business unit or business function. It utilizes a common enterprise view of strategic data and provides business units more flexibility, control, and responsibility. The data mart may or may not be on the same server or location as the data warehouse.
If your company has a few tangible, documented business requirements to tackle, and you are reasonably sure that a new data mart will do the trick, you may be asking yourself how to strategically integrate the new data mart into your organization. Even though the answer depends on the specifics of your situation, you’ll probably end up with a data mart that resembles one of two proven types. Our nomenclatures for the two types are DSS Application and Departmental. The following definitions may help you understand the differences between these two types of marts.
Departmental Data Marts
The definition of a departmental data mart is a decision support database that belongs solely to a particular department or division within your organization. For example, the sales department may want to create a decision support database containing sales data specifically. These data marts are fairly generic in functionality and serve as repositories of historical data for use by that department’s personnel only. The design must be fairly generic as well, that is, not focused on any particular functionality or process. In other words, departmental data marts generally have a broad focus and a narrow audience.
DSS Application Data Marts
DSS application data marts have a very different focus. Their focus is on a particular decision support process such as risk management, campaign analysis, or head count analysis, rather than generic utilization. Because of their universal appeal in the company, they also are seen as an enterprise resource. They can be used by anyone within the organization that has a need for its analytical capability. Another way of saying this is that DSS application data marts have a narrow focus but broad user community usage.
Similarities and Differences between Marts
Both departmental data marts and DSS application data marts emanate from the data warehouse. DSS applications differ from departmental data marts in several respects. Table 13.1 summarizes the difference between a departmental data mart and a DSS application one.
In short, although certainly similarities exist between departmental and DSS application data marts, certain differences are notable as well. Determining the type of data marts results from the answers to three basic questions: What does it do, who is it for, and who is paying for it?
What Does It Do?
First and foremost, the answer to the question should be that it efficiently solves the tangible, documented business requirements. In addition, if the nature and scope of the requirement are clearly comprehensive or universally used, then a DSS application data mart is in order. If the nature and scope is limited and even proprietary, then a departmental data mart is probably better.
Table 13.1 DSS Application versus Departmental Data Mart
|
DSS APPLICATION DATA MART |
DEPARTMENTAL DATA MART |
Focus |
Highly focused |
Broad, generic focus |
Outputs |
Standard analyses and repetitive reporting |
General analyses and reports, some ad hoc reports |
Usage |
Highly structured |
Unstructured |
Pattern of access |
Predictable |
Unpredictable |
Audience |
Multiple departments or divisions |
Single department or division |
![]() For departmental data marts, don’t forget to determine whether other departments have the same requirement; that is, they would be interested in sharing the benefits and the costs. This may lead you to change the scope of the mart.
For departmental data marts, don’t forget to determine whether other departments have the same requirement; that is, they would be interested in sharing the benefits and the costs. This may lead you to change the scope of the mart.
![]() For either data mart type, manage user expectations. Make sure that everyone understands what the data mart will and won’t do. Famous last words: “Our new data mart will answer all our questions.”
For either data mart type, manage user expectations. Make sure that everyone understands what the data mart will and won’t do. Famous last words: “Our new data mart will answer all our questions.”
Who Is It For?
Although the roster of users who access the data mart is important, this question goes to the politics of the situation and to performance-based compensation. The real question is who will ultimately benefit the most from the data mart’s success? If the answer is business analysts and executives of a single department, then the data mart should be departmental. If the answer is the people at many levels throughout the organization, then make it a DSS application data mart.
Once you’ve identified whom it is for, invite them to be the project sponsor(s). If you can’t sell them on the role, then consider delaying the implementation until you can, because if they won’t fight for the project at the start, they may fight against it later.
Who Is Paying for It?
Although budgeting practices differ widely and IT departments often function under their own budgets, you should maximize the association between costs and benefits. So, if only one department is willing to cover the costs, a departmental data mart is needed. If the budge sponsor(s) have overall or inclusive responsibilities or include many departments, then a DSS application data mart is the right one to build. If the senior project sponsors don’t have budget authority, consider whether the ultimate benefactor is actually higher up in the food chain.
Once you’ve answered the three questions, you should compare the answers to the inherent features of each type and evaluate which approach is needed.
Pros and Cons of Each Type of Data Mart
When deciding whether to build a departmental or DSS application data mart, several factors must be considered. First and foremost, you should be aware of the pros and cons of each structure. At least then you are going into the implementation knowing the strengths and the weaknesses of each type of data mart.
Departmental Data Marts
Departmental data marts have a number of attributes that are to your advantage when constructing analytical capabilities:
![]() You have a good chance of delivering what the department wants. The users are usually very involved in the design and usage of this mart.
You have a good chance of delivering what the department wants. The users are usually very involved in the design and usage of this mart.
![]() You can get good funding since the department owns this mart.
You can get good funding since the department owns this mart.
![]() Most IT projects are founded this way—one department paying for its own system—so it is easy for the department to build a business case.
Most IT projects are founded this way—one department paying for its own system—so it is easy for the department to build a business case.
![]() The department controls the mart and therefore can make it perform almost all of the department’s proprietary analyses.
The department controls the mart and therefore can make it perform almost all of the department’s proprietary analyses.
On the other hand, you should be aware of the pitfalls to these types of marts:
![]() Performance issues can arise due to the data mart not being optimized for any set of queries—or worse, being optimized for some queries that cause performance problems for other queries.
Performance issues can arise due to the data mart not being optimized for any set of queries—or worse, being optimized for some queries that cause performance problems for other queries.
![]() Redundant queries can run on different data marts throughout the organization although the result sets from these may not be consistent! This is somewhat mitigated by having the data warehouse feeding all the marts, but it is certainly not guaranteed that two marts will produce the same numbers, and so on.
Redundant queries can run on different data marts throughout the organization although the result sets from these may not be consistent! This is somewhat mitigated by having the data warehouse feeding all the marts, but it is certainly not guaranteed that two marts will produce the same numbers, and so on.
![]() A minimal sharing of findings between departments can occur.
A minimal sharing of findings between departments can occur.
![]() No desire exists for supporting an enterprise view of the information.
No desire exists for supporting an enterprise view of the information.
![]() You face a difficulty in getting funding for the data warehouse (an enterprise resource).
You face a difficulty in getting funding for the data warehouse (an enterprise resource).
DSS Application Data Marts
DSS application data marts have the advantage of an enterprise-wide appeal and reusability. Other advantages include the following:
![]() It is possible to create standard analyses and reports from these marts.
It is possible to create standard analyses and reports from these marts.
![]() An analytical functionality is created only once and is used by the business community in much the same fashion.
An analytical functionality is created only once and is used by the business community in much the same fashion.
![]() The data mart is easy to tune and the capacity is predictable.
The data mart is easy to tune and the capacity is predictable.
![]() Many vendors today offer specific DSS applications that can plug into your data warehouse environment, thus speeding up the implementation of analytical applications.
Many vendors today offer specific DSS applications that can plug into your data warehouse environment, thus speeding up the implementation of analytical applications.
These types of marts also have disadvantages:
![]() It may be difficult to customize the views or queries into the mart enough to satisfy the diverse set of users.
It may be difficult to customize the views or queries into the mart enough to satisfy the diverse set of users.
![]() Funding must come from an enterprise source rather than a single department.
Funding must come from an enterprise source rather than a single department.
![]() It can be hard to get the business community to agree on the overall design of this application.
It can be hard to get the business community to agree on the overall design of this application.
![]() Some of the analyses may be suboptimized due to the nondepartment specific nature of the mart. That is, the mart may satisfy only 80 to 90 percent of a department’s needs because it is an application for the entire enterprise.
Some of the analyses may be suboptimized due to the nondepartment specific nature of the mart. That is, the mart may satisfy only 80 to 90 percent of a department’s needs because it is an application for the entire enterprise.
Database Designs for Data Marts
Without a doubt, the most popular designs include the star schema and its variations. There is good reason for this. The star schema is great for supporting a multidimensional analysis in data marts with known, stable requirements, fairly predictable queries with reasonable response times, recurring reports, and so on. Not surprisingly, multidimensional tools have earned a strong position in the marketplace as well.
The techniques for building star schemas are perhaps the most elegant, well-explained, and useful techniques for determining business requirements, dimensions, keys, and, when necessary, physical database schemas. Numerous projects have successfully applied these techniques and concepts.
However, other issues relate to the data warehouse environments besides dimensionality:
![]() The cost of ownership is now an issue confronting many data warehouse shops. Does the return equal the ongoing investment?
The cost of ownership is now an issue confronting many data warehouse shops. Does the return equal the ongoing investment?
![]() Queries that do stock processes but do not open the data up for exploration risk creating an environment that does not generate adequate return.
Queries that do stock processes but do not open the data up for exploration risk creating an environment that does not generate adequate return.
It seems reasonable to conclude that unique combinations of processing requirements and types of data demand different structures. In other words, one approach or structure isn’t always best.
Experience indicates that the “universe” of data warehouse processing types is diverse. It includes data mining, statistical analysis, data exploration, and more. The decision support users performing these types of analyses often search for unexpected data relationships.
So, if your entire data warehouse environment consists of a single structure, then your ability to analyze your data is limited to the subset of analyses that the structure best supports. To maximize your data warehousing return on investment (ROI), you need to embrace and implement data warehouse architectures that enable the full spectrum of analysis.
The usage of the data warehouse for the purpose of business intelligence is usually accommodated by the integrated, historical data found in the data warehouse and the construction of DSS application or departmental data marts. In the case of the data marts, the data must be reformatted to meet the needs of the particular business requirement and the tool used for that requirement. Figure 13.3 shows the support of business intelligence by the data warehouse.
The data found in the data warehouse is at a very granular level. For most DSS applications, it is necessary to restructure the data to facilitate the use of the tools found in business intelligence. Some of the ways that data can be restructured to meet the needs of business intelligence are as follows:
![]() Merging or aggregating the data. Small units of data are joined together to form a cohesive whole that makes sense to the business intelligence analyst. Generally, the database design is in the form of a star schema or snowflake schema.
Merging or aggregating the data. Small units of data are joined together to form a cohesive whole that makes sense to the business intelligence analyst. Generally, the database design is in the form of a star schema or snowflake schema.
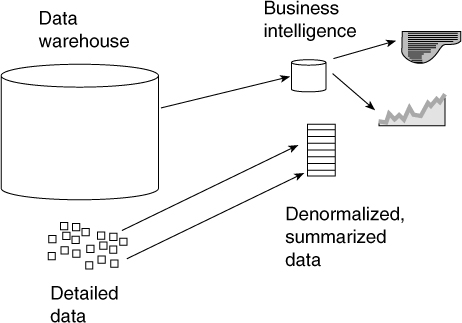
Figure 13.3 Business intelligence is supported by derailed data that is restructured to meet the analyst’s needs.
![]() Summarizing the data. Many detailed units of data are summarized so that the business analyst can see the forest for the trees.
Summarizing the data. Many detailed units of data are summarized so that the business analyst can see the forest for the trees.
![]() Cubing the data. The detailed data found in the data warehouse is presented and stored in a specialized multidimensional database structure.
Cubing the data. The detailed data found in the data warehouse is presented and stored in a specialized multidimensional database structure.
![]() Statistical subsets of data. Unbiased sets of data are created for mining or exploration.
Statistical subsets of data. Unbiased sets of data are created for mining or exploration.
The restructuring of the data that occurs as data is moved from the warehouse to the tools of business intelligence usually is thought of as going from a normalized structure to some form of denormalized design. In general, the data found in the data warehouse is normalized (or if not perfectly normalized, it is very close). The data needed for business intelligence on the other hand is denormalized. Many different flavors of denormalization are available:
![]() Summarization
Summarization
![]() Aggregation
Aggregation
![]() Star schemas
Star schemas
![]() Snowflake schemas
Snowflake schemas
![]() Hierarchical structures
Hierarchical structures
![]() Data sets
Data sets
![]() Flat files
Flat files
The denormalization that is done as data approaches the business intelligence environment is done in accordance with the requirements of the business community seeking answers and the particular business intelligence tool chosen for each application.
For many statistical, data mining, or exploratory analyses, there must be no hint of a bias or an arbitrary establishment of data relationships. The value of these exploratory algorithms depends on the absence of predefined relationships. These applications are searching for unknown relationships rather than the known relationships established by star schemas or hypercubes. By definition, the star schema must have predetermined, physical relationships, thus maximizing the straightforward, multidimensional queries but hampering any ability to look for unknown or unexpected data relationships.
For a low-latency data warehouse (one with rapid update cycles), the star schema offers restrictions in update speed and insertion capabilities. Many of the mission-critical, large-volume data warehouses now appearing require rapid insertion capabilities.
The truth is that database structures vary across a spectrum of normalized to denormalized to flat files of transactions. The ideal situation is to craft the schemas after the requirements are established. Unfortunately, the database structure/solution is often selected before the specific business needs are known. How often have you heard members of the development team debating the merits of star versus normalized schemas before even starting the business requirements analysis? For whatever reason, architects and data modelers latch onto a particular design technique—perhaps through comfort with a particular technique or ignorance of other techniques—and force all data marts and even the data warehouse to have that one type of design. This is similar to the person who is an expert with a hammer—everything they see resembles a nail.
Commercial Decision Support Applications
Now that we have an understanding of how the DSS application data mart differs from the more traditional departmental data mart, let’s take a closer look at some of the more common DSS applications: ERP and e-business.
ERP Analytical Applications
One of the most important DSS applications comes from the ERP world. Figure 13.4 shows that ERP activity begins in the transaction application environment. Once the ERP transaction has been executed, it flows into one or more ERP application databases. As the data ages, it is pulled from the ERP transaction database into the data warehouse. However, before it can be put into the data warehouse, the ERP data may need to be integrated with other sources of data into meaningful units.
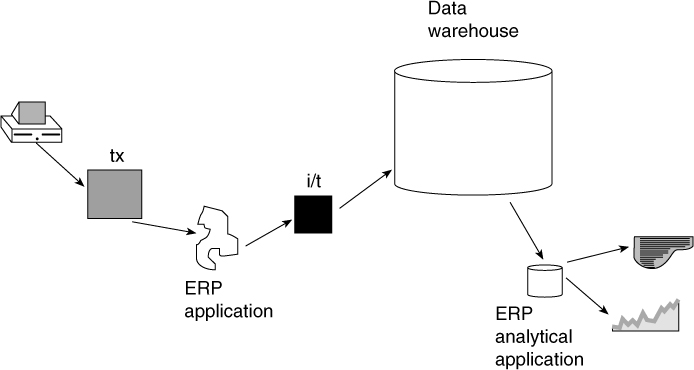
Figure 13.4 ERP analytical applications.
This form of integration is somewhat different from the integration found among the various operational or legacy systems supplying data to the data warehouse. This is because the ERP data often is stored in many tables that are highly fractured. This is done to help the OLTP performance of the ERP system. However, to be meaningful to the DSS analyst, the ERP data must be reconstructed or reintegrated back into meaningful units. Generally, this means merging tables together or “normalizing” the database design. Figure 13.5 demonstrates the reconstruction of the ERP data into meaningful units of data.
The reintegrated ERP data is then placed into the data warehouse. Once inside, the ERP data is available for DSS analytical processing and reporting. The kinds of reporting that typically are done by a DSS analysis application include the following:
![]() Simple reporting
Simple reporting
![]() Key performance monitoring
Key performance monitoring
![]() Checkpoint monitoring
Checkpoint monitoring
![]() Summary reporting
Summary reporting
![]() Exception reporting
Exception reporting
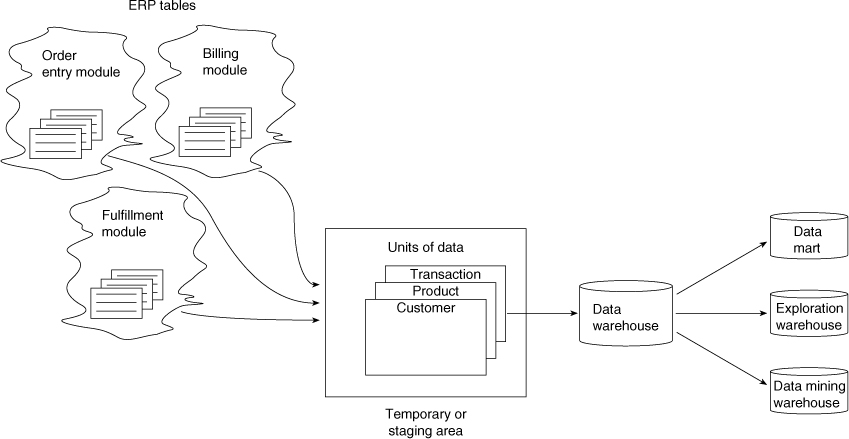
Figure 13.5 ERP data reconstructed into meaningful units of data.
In addition, ERP data in the data warehouse can be placed in exploration warehouses or mining warehouses where it can be freely interrogated along many different parameters.
The incorporation of ERP data into a data warehouse is an issue that can be addressed in more than one way. Figure 13.6 shows the three common ways that ERP data can enter a data warehouse. One option is to create a data warehouse within the ERP environment and to pull non-ERP data into the ERP data warehouse. This approach requires you to convert the non-ERP data to ERP-like data. In addition, this approach may constrain the DSS analyst to using the data within the confines of the ERP environment. The ERP environment typically enables access of the data only through ERP-specific structures. Unfortunately, in a DSS environment, the DSS analyst often wants to see the data through multiple technologies and the ERP-specific data structures may not permit this freedom of analysis. The proprietary nature of the ERP’s data warehouse environment may limit your ability to satisfy all of the business community.
A second limitation affects the tools the ERP vendor supports for DSS analysis. If the organization has its own favorite and customary set of tools and the ERP vendor does not support those tools, then a fundamental problem will occur with building the data warehouse within the confines of the ERP environment.
A second approach is to build two types of warehouses. One warehouse is built for non-ERP data in a conventional warehouse environment. Another ERP-specific warehouse is built just for ERP data. Much analysis can be done in either environment. However, if a combination of the two warehouses is needed, the data must either be pushed to the non-ERP data warehouse where it is merged and compared in a conventional manner with conventional tools or the non-ERP data must be introduced into the ERP warehouse structure.
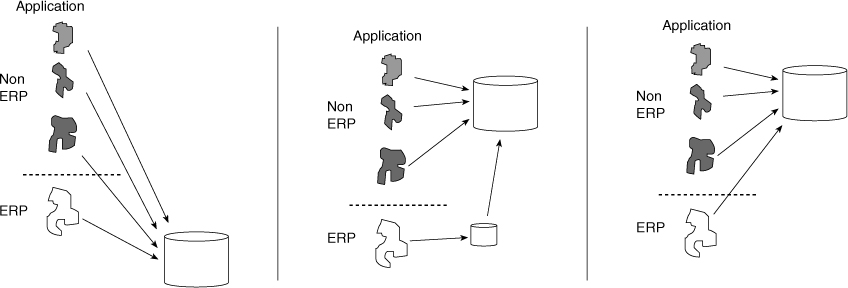
Figure 13.6 Three possibilities for merging ERP and non-ERP data.
A third approach is to take the ERP data and move it directly out of the ERP environment and into a non-ERP data warehouse. The issue here concerns pulling the data out of the ERP environment. In order to do so it is advisable to use a commercial tool designed for that purpose.
e-Business Analytic Applications
Strictly speaking, e-business is not a DSS application, but many aspects of e-business relate to a DSS analysis. A very natural relationship exists between the Web site (which supports e-business) and the corporate information factory. Figure 13.7 shows that the fit with the data warehouse-centric CIF is tight and comfortable. The Web site feeds data to the data warehouse through a granularity manager. The granularity manager is a component of the Web interface that reduces, aggregates, and organizes very low-level detail created in the Web site (such as click streams) as the data passes into the CIF. In turn, the Web site may receive small amounts of aggregated, analyzed data originating from the data warehouse and fed into an ODS. The last direct interface the Web site has with the CIF is through the fulfillment process, which is the order-processing component of the CIF. When the Web site encounters an order, the information needed to complete the order is passed directly into the operational systems of the corporation.
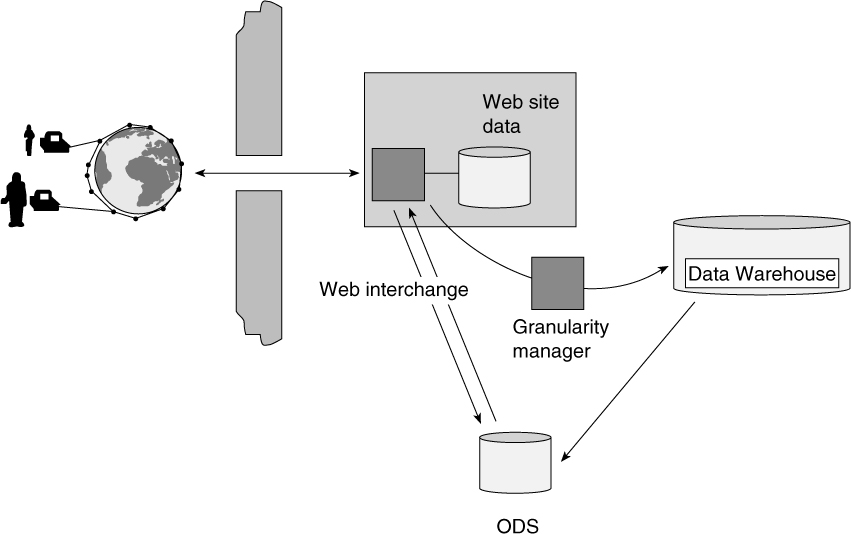
Figure 13.7 The essential components of the web and the CIF.
Interaction of the Data Warehouse and the Operational Data Store
One aspect of the CIF that is often overlooked or ignored is the interaction between the data warehouse, data marts, and the operational data store. This interaction calls for small amounts of pre-aggregated or pre-analyzed data to flow from the strategic decision support environment into the ODS for use with more tactical applications. By placing the results of a strategic analysis in the ODS, we can rapidly access key strategic information while performing operational tasks. This new addition to the ODS evolution is called a Class 4 ODS.
Once the strategic results are stored in the ODS, online real-time support of important strategic information is possible. In doing so, the data warehouse can be said to support online high-performance access of data when that access is needed.
This is a valuable and important concept—an indirect approach to strategic information. The data warehouse with its associated data marts contains historical data. To support a conclusion about a customer, you may have to analyze thousands or hundreds of thousands of historical records. If that is the case, it is much better to do the analysis when plenty of machine cycles are available with no rush, that is, within your strategic decision support environment. After the data is analyzed through, the result of that analysis can then be placed in the ODS. Once there, this strategic information is easily and quickly available.
Examples of Class IV Operational Data Stores
As a simple example of the interaction between the strategic environment and our ODS, suppose a financial institute wants to create an online environment for loan acceptance for the regular customers of the bank. The requirement is for instantaneous loan approval for valuable and credit-worthy individuals. The analysis to determine the individual instant acceptance limit for each customer known to the bank must be performed in the appropriate data mart. To determine an individual’s credit worthiness, the analysis uses individual historical transaction data, information about each customer’s assets and liabilities, demographic data, and other integrated information to determine what the bank is willing to risk in the way of an instantaneous loan to each individual. The net result of this analysis is shown in Table 13.2.
Table 13.2 Results of Instant Loan Amount Analysis
CUSTOMER ID |
INSTANTANEOUS LOAN AMOUNT |
0010199 |
$100,000 |
0010200 |
$150,000 |
0028971 |
$75,000 |
0190432 |
$25,000 |
2159801 |
$200,000 |
And so on |
. . . |
The results of the pre-aggregated, analyzed data are loaded into the ODS. In other words, the bank is willing to give customer 0010199 a loan of up to $100,000 instantly; 0010200, $150,000; 0028971, $75,000; and so on. Obviously, when customer 0010199 walks into the bank and requests a loan, he or she should get instant approval for any amount up to $100,000. The problem comes in accessing this critical information. Certainly, the loan officer does not want to run this lengthy analysis every time someone asks for a loan. Even if the results set is stored in an easily accessible report, he still does not know who each of these IDs refers to. He has little or no other information about these results other than the customer’s ID. Obviously, he would like to go to one place to look up the current, integrated data about his customer and get immediate access to this strategic piece of information as well.
Therefore, this small amount of data from the strategic analysis is matched up with the same customer IDs in the ODS and the results are stored with each customer’s record. The ODS customer information looks like Table 13.3.
Now the loan officer can simply look up a particular customer in the ODS to determine their individual loan limit. If the customer requires more than the pre-approved amount, then the bank must go through its normal loan routine to ensure her credit worthiness for the higher amount.
This is only one example of how critical strategic information can be fed to the ODS. We can think of numerous other examples of strategic information that would be good candidates for this new class of ODS. Table 13.4 has a few of these suggestions.
The Operational Data Store has evolved many times to new and critical roles within the operational world. This latest (but not last?) evolution is one in which the need to access small amounts of strategic information drives the incorporation of this information into the ODS from the strategic decision support environment. The ability to access this strategic information in a real-time mode has proven to be an appreciated and highly successful new twist in a well-established component of the CIF.
Table 13.3 Strategic Data Stored in the ODS
CUSTOMER ID |
NAME |
ADDRESS |
PRE-APPROVED LOAN AMT |
PHONE NUMBER |
0010199 |
Ron Powell |
101 Main St. |
$100,000 |
555-2342 |
0010200 |
Jean Schauer |
53 Maple Ave. |
$150,000 |
555-7896 |
0028971 |
Jon Geiger |
23 Center St. |
$75,000 |
555-4326 |
0190432 |
Claudia Imhoff |
10 D Court St. |
$25,000 |
555-7654 |
2159801 |
Joyce Norris |
1908 Phillips St. |
$200,000 |
555-3452 |
And so on |
... |
... |
... |
... |
Table 13.4 Examples of Strategic Results That May Be Populated into the ODS
STRATEGIC RESULT |
DEFINITION |
Customer LTV Score |
This analysis of determining the customer’s overall lifetime value to the organization |
Segmentation Score |
The analysis determining the customer’s market segment score |
VIP Indicator |
A determination of VIP status based on a customer’s other relationships (is he or she a CEO of an important commercial account?), household status (son of important investor?), and so on |
What Is an “Oper-Mart”?
Over the years since the publication of Building the Operational Data Store1, we have learned a great deal about the utilization and construction of this important component of the CIF. Furthermore, we have discovered a new structure, heretofore unknown that is used for tactical analysis. This structure is called an oper-mart. Yes, it is similar to the data mart in that it is a smaller subset of data available in the ODS, but it differs significantly in its currency, its usage, and the business community members using it. The characteristics of an oper-mart are as follows:
![]() It is a small subset of operational data-store data used in tactical analysis.
It is a small subset of operational data-store data used in tactical analysis.
![]() It is stored usually in a multidimensional manner (star schema or hypercube).
It is stored usually in a multidimensional manner (star schema or hypercube).
![]() It is updated by transactions occurring in the ODS (no history stored here!).
It is updated by transactions occurring in the ODS (no history stored here!).
![]() It may be created in a temporary manner and dismantled when no longer needed
It may be created in a temporary manner and dismantled when no longer needed
Oper-marts are created when current operational data needs to be analyzed in a multidimensional fashion. For example, a banker may want to get a quick idea of how many and what types of loans have been issued in a particular market segment for commercial customers today. He may need to slice this data in several different ways to get a current understanding of the bank’s operations. He needs immediate access to current data in an easy fashion, yet he cannot impact the functioning of his operational systems. He needs an oper-mart that is quickly constructed, easily understood, and constantly updated as the day’s business progresses.
We are starting to see oper-marts being built off ERP systems, from ODS implementations, and even from some legacy systems. Like all things, these should be used conservatively and have a rational plan in place for their construction, maintenance, and eventual destruction. They are not all-purpose tools and should never be used to replace strategic data marts or the data warehouse.
Off-the-Shelf Applications
Many vendors today are developing pre-designed applications for both strategic and tactical applications. These vendors have studied and implemented the needs of both vertical industries (financial services, telecommunications, retail, utilities) and horizontal applications (risk management, fraud analysis, CRM applications) and have developed everything needed for generic applications. These applications include the data models, database schemas, maps to specific ERP systems, and even the transformation rules necessary to integrate the data—all that is needed to create an application. All you add is your data.
Guidelines for Choosing the Right Off-the-Shelf Decision Support Application
The DSS industry is moving toward more and more pre-built, pre-designed decision support applications. As an example of these “data marts in a box,” you can find vendors selling risk management applications, profitability marts, CRM demographic profiling and lifetime value applications, and so on. As a final part of this chapter, we offer the following guidelines to help you choose the best off-the-shelf applications for your corporation.
![]() Diligently determine the business requirements for the application. Create a document that clearly and concisely states the business problems that will be solved by the commercial application.
Diligently determine the business requirements for the application. Create a document that clearly and concisely states the business problems that will be solved by the commercial application.
![]() Determine whether the application will be used by only a department (departmental data mart) or whether it will be used by many departments (DSS application data mart). This determination may affect the interface into the mart and the security of the data within.
Determine whether the application will be used by only a department (departmental data mart) or whether it will be used by many departments (DSS application data mart). This determination may affect the interface into the mart and the security of the data within.
![]() Determine the match between the commercial application and the documented business requirements. No commercial mart will satisfy all the requirements, but it should support at least 80 percent of the known requirements.
Determine the match between the commercial application and the documented business requirements. No commercial mart will satisfy all the requirements, but it should support at least 80 percent of the known requirements.
![]() Determine the technological fit with your existing warehouse environment. If the commercial mart requires new technology, you may want to reconsider. Will it fit into a feed from the warehouse easily and with minimal disruption to the current flow of data?
Determine the technological fit with your existing warehouse environment. If the commercial mart requires new technology, you may want to reconsider. Will it fit into a feed from the warehouse easily and with minimal disruption to the current flow of data?
![]() Determine the performance criteria for the new capability. This will require you to determine the immediate number of users, the growth of these users over the next two years, the performance expectations from the business community, and so on.
Determine the performance criteria for the new capability. This will require you to determine the immediate number of users, the growth of these users over the next two years, the performance expectations from the business community, and so on.
![]() Consider the data volumes the application may have to handle and ensure that it can support these volumes.
Consider the data volumes the application may have to handle and ensure that it can support these volumes.
![]() Create a prototype of the application to test it out in your environment. Nothing is more important than ensuring that the application will work in your particular environment.
Create a prototype of the application to test it out in your environment. Nothing is more important than ensuring that the application will work in your particular environment.
![]() Determine the entire costs of the application (include hidden costs such as technical support, upgrades, and so on). Make sure you have done a solid cost/benefit analysis to justify the cost.
Determine the entire costs of the application (include hidden costs such as technical support, upgrades, and so on). Make sure you have done a solid cost/benefit analysis to justify the cost.
![]() Obtain references from the vendor of similar installations. You may even want to do a site visit with the references.
Obtain references from the vendor of similar installations. You may even want to do a site visit with the references.
Buying rather than building an analytical application has several advantages:
![]() The time for implementation can be greatly shortened.
The time for implementation can be greatly shortened.
![]() There may be functionalities in the commercial mart that your users did not consider.
There may be functionalities in the commercial mart that your users did not consider.
![]() The commercial mart forces an amount of standardization that you may not be able to achieve if you build the application.
The commercial mart forces an amount of standardization that you may not be able to achieve if you build the application.
Buying the commercial mart has deterrents as well:
![]() The functionality may not be customizable, so what you get is all you get.
The functionality may not be customizable, so what you get is all you get.
![]() Since it is a generic application, there may be functionalities that you don’t want or need, and there may be concessions that your business communities may make to accommodate the application.
Since it is a generic application, there may be functionalities that you don’t want or need, and there may be concessions that your business communities may make to accommodate the application.
![]() Your competitor may have the same application, thus destroying any strategic advantage you may think you will get.
Your competitor may have the same application, thus destroying any strategic advantage you may think you will get.
Summary
The data warehouse serves as an excellent source of data for data marts. It not only supplies integrated, high-quality data, but it also serves as a repository of valuable historical data for use in decision support analyses.
Two types of data marts can be built—those for a specific department that are rather generic in purpose and design and are used only by one department—and DSS applications that are used by multiple departments and have a very specific design and purpose. Each type of mart has advantages and disadvantages associated with it. Your job is to determine which mart type best suits your corporation’s business needs.
Data mart designs come in many flavors:
![]() Multidimensional ones using star schemas, snowflake schemas or hypercubes
Multidimensional ones using star schemas, snowflake schemas or hypercubes
![]() Reporting ones that simply use subsets of relatively static, normalized data
Reporting ones that simply use subsets of relatively static, normalized data
![]() Exploration ones that require denormalized flat files with minimal data relationships
Exploration ones that require denormalized flat files with minimal data relationships
You must fit the design to the business problem identified and the access tool selected.
The data warehouse and data marts also have a very nice interplay with the operational data store. Small amounts of pre-aggregated or pre-analyzed data may flow from the warehouse into the ODS for use in tactical decision-making. This interaction enables critical strategic data to be accessible in a real-time, fast access mode. The ODS may also spawn oper-marts, current subsets of data used for tactical multidimensional analysis.
Finally, a number of vendors offer commercial applications that can truly speed up the implementation time. Care must be taken to ensure that these applications are right for your organization and business community. The set of guidelines given will help you determine whether to buy or build your data mart functionality.
Congratulations! You have now covered a broad spectrum of concepts ranging from what components comprise the corporate information factory to how these components are used in the delivery of decision-support capabilities. Now, let’s take a look at variations to implementing the corporate information factory and the associated risks to the long-term viability of your information ecosystem.