
In information systems, application architecture is one of several architecture domains that form the pillars of an EA or solution architecture. The term "application architecture" is commonly used for the internal structure of an application, for its software modularization. Application architecture is the methodology for ensuring that the applications suite being leveraged by the enterprise to create the composite architecture is reliable, scalable, and manageable.
The recommended methodology for developing application architectures is as follows:
- Understand the applications landscape, the basis the application baseline, including business requirements, and it's correlation to business architecture
- Identify logical applications and the best-fit physical components of applications
- Define KPIs for the entire landscape by co-relating applications to services, functions, data, and processes
- Elaborate application architecture by understanding the applications function, and the integration, migration, development, and operational concerns.
Qualities
The following is the comprehensive list for ensuring completeness of an application architecture:
- All modules are well defined, including their functionality and their interfaces to other modules
- The architecture designed can accommodate likely changes and is extensible
- The architecture is independent of the machine and language that will be used to implement it
- The design decision, assumption, risks, and mitigation actions
- The necessary buy versus build decisions are included
- The architecture emphasizes on reusability
- Key aspects of the user interface are defined
- No part is over or under-architected
- Major system goals are clearly stated
- The whole architecture hangs together conceptually
- Motivations for all major decisions are provided
- Diagram depicting application architecture
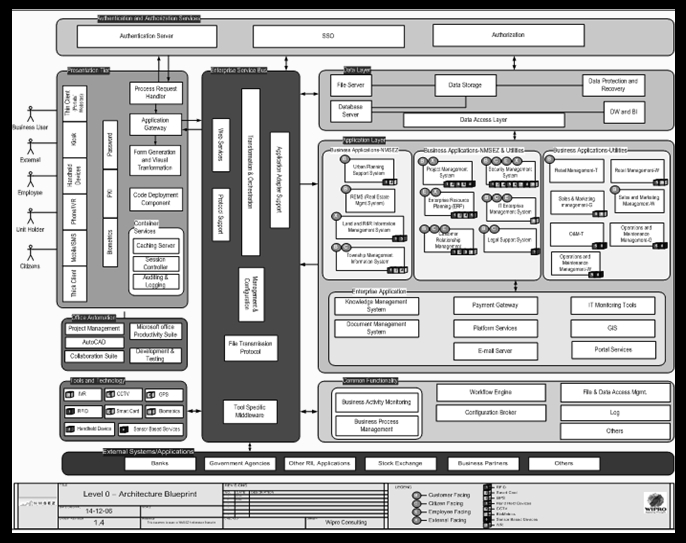
Figure 10: Application architecture
Probability indicator: ![]()
This is done through the use of protocols such as SOAP, RMI, and CORBA for building distributed architecture and providing the plumbing mechanism. For example, if the presentation tier and business are designed in .NET, .NET remoting will the right choice. A SOAP web service is the choice if business logic needs to be exposed and accessible outside the domain.
When leveraging a remoting mechanism, such as RMI, the contracts between two tiers is pre-defined. In SOA, the client can dynamically discover the contract. For example, web services expose contracts through the Web Service Description Language (WSDL), which provides decoupling. At times, it is essential to define data contracts or data transfer objects that can be transferred between tiers. Internally, tiers have to convert DTOs to business objects ensuring that the contract doesn't break if the database changes.
Probability indicator: ![]()
One approach to this is through JMS/MQ, which provides queues that store messages if the destination node is not reachable/available. The messages remain in the queue until they are finally consumed by the application end point. JMS is only a specification for messaging services from Oracle and is part of the JEE framework. The corresponding implementation is the MQ series from IBM which provides the API and tools for building JMS compliant applications which are highly reliable. Message queues can be configured to work in a point-to-point model or a publish-subscribe model.
Please refer to the following figure:

Figure 17: JMS/MQ architecture
Probability indicator: ![]()
An Enterprise Resource Planning (ERP) is a business process management product that allows an enterprise to leverage a suite of integrated applications to manage business and automate functions such as customers, administration, logistics, and production. ERP software integrates all facets of operations, including planning, marketing, sales, development, and manufacturing.
ERP is an enterprise software that is targeted to be leveraged by larger enterprises and often requires dedicated SMEs to customize and manage upgrades and deployment. In contrast, small business ERPs are lightweight business management solutions, customized for the specific industry.
Benefits of ERP
The benefits of ERP are as follows:
- Finer controls on financial compliance declarations such as Basel II or Sarbanes-Oxley, as well as other forms of compliance.
- Master data source for products and services, such as data pertaining to customers, vendors, suppliers, products, and orders, drives fast product development and launch cycles which make the company competitive.
- Access to valuable organization data delivers a 360 degree view of the business that drives continuous improvement and establishes performance metrics and measures to gauge business health.
- Facilitates streamlined procurement and sourcing processes and drives alignment to customer demands.
- Facilitates sales and operations planning with access to critical data and fosters closed loop processes that ensure the business does not overpromise and/or under deliver to customers.
- Automating business processes such as invoicing and purchase orders within one system improves accuracy and reduces inefficiencies.
- Leveraging a single source of information for billing and customer interactions improves service levels and increases customer satisfaction.
Figure 13: ERP capabilities
Probability indicator: ![]()
CRM is the acronym for customer relationship management. Customer relationship management entails all aspects of interaction with a customer including sales, services, or marketing domains. While the term "CRM" is leveraged for customer business relationships, CRM also manages business contacts, prospects, clients, contract wins, and sales leads.
CRM solutions provide the customer data to help provide services or products that your customers want, and provide better customer service, cross-selling and up-selling more effectively. They help to close deals, retain current customers, and better understand your customer. Enterprises frequently look for ways to personalize online experiences through tools such as help-desk software, e-mail organizers, and different types of enterprise applications.

Figure 13: CRM building blocks
Benefits of CRM
Let's take a look at the benefits of CRM:
- Decision making is quick and well supported by real-time reporting across all business teams.
- Marketing capabilities bring quality leads through continually improving, segmentation and campaigns.
- Pipeline reports are trusted and leveraged for reliable sales and production forecasts to increase predictably and efficiency.
- Performance bottlenecks are efficiently identified so timely action can be taken to correct issues.
- Automation removes the inefficient manual processes to cut admin costs and eliminate duplication of efforts so teams can focus on core business activities.
- Customer churn is low as CRM business users have direct access to the relationship details they need to engage clients and provide a good experience.
- CRM integrates with accounting and other back-office solutions to join processes and remove the duplication of tasks.
- Users can quickly check customer order histories to assess buying patterns and identify new sales opportunities.
- Mobile and field teams can work productively with reliable access to customer information they need via their smart devices.
- Sales cycles are shortened and win rates are improved as teams have visibility of which prospects are most likely to close.
- Personalized marketing communications and increased lead generation from customer lists with complete relationship and behavior details are archived in CRM.
- CRM manages customer contacts and customer service calls/tickets
Popular CRM software
The following table illustrates the different types of CRM software:
|
SAP CRM |
Salesforce |
Oracle Siebel |
|
OnContact |
Sage Act |
Prophet |
|
AIM CRM |
Relenta |
Webasyst |
|
Sugar CRM |
Probability indicator: ![]()
The challenges organizations face while incorporating CRM include:
- Database cleansing ensures client information is in the correct state
- Integrating with other IT applications, whether new or existing
- IT applications are very large and complex, requiring trainers for end users
- Lack of a clear transitional process
- Primary focus on product sales and market segmentation
- Metrics and KPIs are not monitored and tracked
- Weak functional organization of a company
- Lack of responses to customer recommendations and feedback
- Introducing technology solutions without the required frameworks and methodologies
Probability indicator: ![]()
Substantiate a rationale for picking the system over others and the factors that you considered while making the final selection. The following are the key factors for product selection. One can then leverage a decision matrix for the final data consolidation and share it with the customer executives.
The decision matrix is one of the approaches to leverage in this scenario. The decision matrix is one of the approaches to tackling this scenario. This has been explained in IT strategy and advisory section.

Probability indicator: ![]()
Application monitoring and performance management helps organizations monitor and optimize infrastructure performance and availability through the use of best practices by identifying and resolving problems in distributed environments. Many organizations begin with no visibility, forcing them into management that is reactive, ad hoc, and slow. The goal is to make sure you have in place the capabilities to assure that you can meet your service level agreements.
Benefits of APM
The benefits are listed as follows:
- Using advanced, robotic monitoring, you can provide an early warning of performance problems, reducing or avoiding the impact of interruptions on users.
- Implementing custom dashboards can enhance your insight into the status of key applications for individual lines of business.
- Deploying agent-based tracking helping you find and remediate difficult-to-isolate, sporadic problems.
- Implementing agentless solutions provides a low-touch approach to discovering and viewing your infrastructure topology and to isolating problems.
- Adding solutions that utilize application agents can improve the accuracy of diagnostics with increased visibility into the key performance indicators of each infrastructure component.
The following diagram depicting APM capabilities:

Figure 15: Application performance management capabilities
Probability indicator: ![]()
There are three major factors to costing a solution. For the first two parts, you will have to engage with the product vendor/ISV to get the information. While there are online tools and data available it's always a good practice to engage the ISV once the solution/building blocks are finalized. The third factor is predominately related to service aspects and will be governed by the billing rates for your organizations. This is calculated through either function points, use case-based, or WBS estimations. This stage will also include finalizing the team organization/structure before working on the effort estimation. This is done with the help from project managers and delivery managers.
This includes:
|
Component |
Description |
|
Part I: Software component |
Applications, products, tools, frameworks, monitoring software and antivirus tools. |
|
Part II: Hardware component |
Servers, networks, storages, disks. |
|
Part III: Services component |
Design, build, and testing phases that will be provided by SI/vendors support and maintained for the next 3-5 years |
Table 1: Costing of solution
Probability indicator: ![]()
Approach for cloud migration:
|
Steps |
Description |
|
Cloud assessment |
Financial assessment: TCO calculation
Compliance and security and technical assessment
Identify tools that can be re-used and the ones that need to be procured
Create cloud migration plan and measure success through metrics |
|
Proof of concept |
Build pilot and validate the technology solution in the cloud |
|
Moving your data |
Understand different storage options in the cloud
Migrate fileservers, RDBMS, and MySQL |
|
Moving your apps |
Forklift and hybrid migration strategy
Build cloud-aware layers or tiers
Create AMIs for each component |
|
Leveraging the cloud |
Automate elasticity and SDLC
Harden security
Create dashboard to manage resources and leverage multiple availability zones |
|
Optimization |
Optimize usage based on demand, improve efficiency, and implement monitoring and telemetry capability
Re-engineer applications and decompose relational databases |
Table 2: Cloud Migration Approach
Probability indicator: ![]()
Challenges
The following are the list of problems with silo organizations:
- Duplication of cost and effort
- Working at cross-purposes
- Lack of synergies
- Little knowledge transfer
- Lack of economies of scale
- The largest problem is a lack of alignment with the overall company strategy
Resolution
In order to correct silo problems, there is no need to re-organize the entire company. Here are the steps that can help break down walls and allow cross-pollination:
- Stimulate cross-LOB teams to work on company-wide initiatives. Employees will get to know each other, gain exposure, and even accept assignments in different functional areas.
- Abolish formality in the organizations and the need to go through a chain of commands before involving senior leadership.
- Define standardize systems and platforms across organization and give employees access to the same information. This will discourage information hoarding.
- Plan for comfortable spaces in each facility where cross-LOB teams can come together in a relaxed environment to brainstorm products/services, processes, and create solutions.
Probability indicator: ![]()