
Chapter 9. Site Statistics Gadget with Ajax—An Information Gadget
"The value of an idea lies in the using of it."
—Thomas Edison
IN THIS CHAPTER
The Goal
The Site Statistics Gadget provides a concise view of counter and statistics services. The data is provided by www.sitemeter.com (see Figure 9.1). The gadget uses Ajax technology to asynchronously acquire the data from a web APIs provided by SiteMeter. The gadget also shows how to extract a part of an online web page in the flyout window and display dynamically generated graphs and statistics that the server application creates. Ajax technology, as you saw in Part II, helps acquire data from online sources in an asynchronous way.
FIGURE 9.1. The Site Statistics Gadget from SiteMeter.

The goals of the Site Statistics Gadget are as follows:
- Provide a subset of a service provided by the free online service www.sitemeter.com
- Show statistical data for page visits and page views
- Include an additional feature for regions, browsers, and operating system information
- Provide a shortcut link to visit the website for detail statistics
- Include the capability to add multiple websites to the Site Statistics Gadget and to easily select between websites
Figure 9.2 shows how the gadget appears in the Sidebar.
FIGURE 9.2. Simple view of the Site Statistics Gadget in the Vista Sidebar.

Background—www.sitemeter.com
SiteMeter is an online web service that provides comprehensive real-time website tracking and counter tools. This gives customers instant access to vital information and data regarding their websites' audiences. It provides data related to visits, page views, and referral links in an easy-to-understand manner.
SiteMeter provides a counter widget, a chunk of JavaScript code that can be embedded in a website and provides a visitor counter and detailed statistics of page views and visits. The information is accumulated by the www.sitemeter.com provider and is accessible as an online web service.
The following code represents the Counter Widget, which is embedded in the website http://innovatewithgadgets.com.
<!-- SiteMeter XHTML Strict 1.0 -->
<script type="text/javascript"
src="http://s41.sitemeter.com/js/counter.js?site=s41vistagadgets">
</script>
This code has a dual purpose. The first is to display the number of visitors to the website, as shown in Figure 9.3. The second is to collect all visitor information and display statistical data in a ready-to-use format.
FIGURE 9.3. The Counter Widget shows the number of visits and links to sitemeter.com, which further displays the detailed visit statistics.

Note the URL the Counter Widget link is http://www.sitemeter.com/stats.asp?site=s41vistagadget.
Here s41vistagadget is the SiteMeter–unique code to identify the website http://innovatewithgadgets.com. This code is generated the first time you create a counter.
Site Summary Page
To display the number of visitors on the website, you can click on the counter and the code takes you to the www.sitemeter.com Site Summary page. The Site Summary page provides a view of the site usage summary (see Figure 9.4).
FIGURE 9.4. Site statistics for the website innovatewithgadgets.com at sitemeter.com.
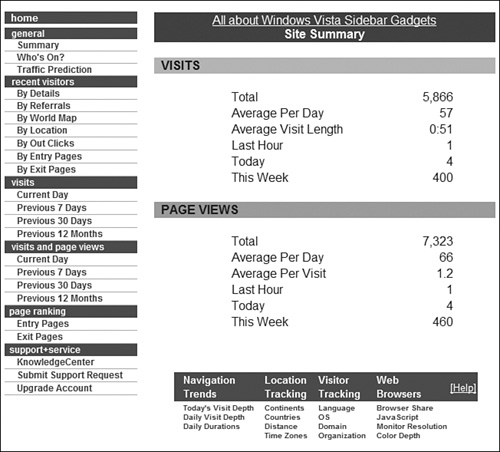
In addition to the summary, the free service also provides recent visitor information, number of visits, page views, page rankings, navigation trends, location tracking, visitor tracking, browser, operating system, and so on. For the example in this book, we are going to implement the most commonly used features in the Site Statistics Gadget.
The Site Statistics Gadget uses the features provided by the free service to create a ready-to-use information gadget. More information about the services provided by SiteMeter can be found on its website at http://www.sitemeter.com.
NOTE
The URL for the SiteMeter Widget is http://www.sitemeter.com/stats.asp?site=s41vistagadget.
s41vistagadget is the SiteMeter code that is generated the first time you create a counter for your website. This code is used to distinguish among multiple websites.
Features and Technology
The Site Statistics Gadget displays a subset of the basic online service provided by www.sitemeter.com. It uses a custom API provided by SiteMeter to pull information from the server. Features also include display of bar graphs and pie charts, such as those shown in Figure 9.5. These features are specific to the implementation of the online service and can also be customized using the data provided by SiteMeter's API.
FIGURE 9.5. The Site Statistics Gadget displays a graph directly from the server.

The following technologies are used for the Site Statistics Gadget:
- Application programming interface provided by www.sitemeter.com
- Loading a portion of a web page (HTML scraping) with Ajax and DOM
Application Programming Interface
The first challenge is to access the data from the online API provided by www.sitemeter.com. This is done using the following technology
- Text data using an Ajax methodology
- JavaScript and DOM to further parse and store data
The website http://www.sitemeter.com provides an API to generate the previous seven days of page visit reports. The SiteMeter code (as discussed earlier) is the key to all the information provided by the API, as well as the data displayed on the online web service. This code ties the information displayed in the gadget to a specific website. The following link displays the information of a website with the SiteMeter code sm5sitefreestuff:
tuff&p2=&p3=6&p4=0&p5=208%2E70%2E116%2E25&p6=HTML&p7=1&p8=%2E%3Fa%3Dstatistics&p9=
&rnd=47190
Within this URL you will find the text string p1= sm5sitefreestuff, which is similar to the code string that every SiteMeter account is issued. This link, when opened in a web browser, returns data similar to the following:
38,Sat.11/10|18,Sat.11/10|15,Sun.11/11|10,Sun.11/11|27,Mon.
![]() 11/12|9,Mon. 11/12|17,Tue.11/13|8,Tue.11/13|30,Wed.11/14|13,Wed.11/14|27,Thu.11/15|9,
11/12|9,Mon. 11/12|17,Tue.11/13|8,Tue.11/13|30,Wed.11/14|13,Wed.11/14|27,Thu.11/15|9,
![]() Thu.11/15|14,Fri.11/16|7,Fri.11/16|13,Sat.11/17|10,Sat.11/17|
Thu.11/15|14,Fri.11/16|7,Fri.11/16|13,Sat.11/17|10,Sat.11/17|
The format is
http://sm5.sitemeter.com/rpc/v6/server.asp?
a=GetChartData &
n=9 &
p1=sm5sitefreestuff &
p2= &
p3=6 &
p4=0 &
p5=208.70.116.25 &
p6=HTML &
p7=1 &
p8=.?a=statistics &
p9= &
rnd=47190
The parameters passed to the SiteMeter URL are different for different accounts. The p1= sm5sitefreestuff would have to be modified with the site user's code string in your widget so that users could see their own stats.
Note that the URL http://sm5.sitemeter.com uses the same prefix (the sm[server number] portion) as the code string. If a user has an account on server 42, this would need to point to http://s42.sitemeter.com and, as expected, his code string would have a similar prefix, such as s42mysitecode.
The SiteMeter server-naming convention uses the following prefixes:
sm1, sm2, sm3, sm4, sm5, sm6, sm7, sm8, sm9, s10, s11 -........ s50
Keep in mind that the account must be public. If the user has an account set to private, it returns no data.
Using an Ajax Methodology with Text Data
The Ajax XMLHTTPRequest object is used to pull the text data provided by the API. XMLHTTPRequest is an object that JavaScript uses to fetch data through the Internet. The data can be in the form of XML, HTML, text, or JSON. This is the core component of Ajax (Asynchronous JavaScript and XML) that makes an information gadget work.
Use this line to create an XMLHTTPRequest object:
var req = new ActiveXObject("Microsoft.XMLHTTP");
Table 9.1 lists the most common methods of the XMLHTTPRequest object, whereas Table 9.2 lists its most common properties.
TABLE 9.1. Common Methods of the XMLHTTPRequest Object
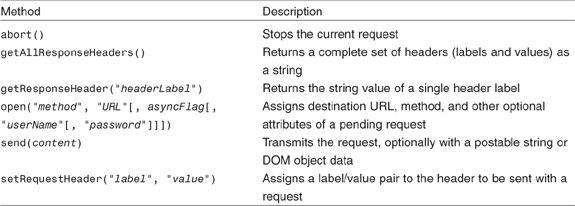
TABLE 9.2. Common Properties of the XMLHTTPRequest Object

Here is the portion of the function that pulls the information from the online API.
function getTextAjax()
{
blogtitle.title = System.Gadget.Settings.read("sitemeterTitle");
var SMC = System.Gadget.Settings.read("sitemeterCode");
var firstthree = Mid(SMC,0,3);
ajaxObj = new ActiveXObject("Microsoft.XMLHTTP");
myURL = "http://" + firstthree +
".sitemeter.com/rpc/v6/server.asp?a=GetChartData&n=9&p1=" + SMC +
"&p2=&p3=6&p4=0&p5=208%2E70%2E116%2E25&p6=HTML&p7=1
&p8=%2E%3Fa%3Dstatistics&p9=&rnd=47190";
ajaxObj.open("GET", myURL, true);
ajaxObj.onreadystatechange = function() {
if (ajaxObj.readyState === 4) {
if (ajaxObj.status === 200) {
loading.innerText = "";
page = 0;
parseData(ajaxObj.responseText);
content.style.visibility = "visible";
loading.style.visibility = "hidden";
} else {
var chkConn;
loading.innerText = "Unable to connect...";
chkConn = setInterval(getTextAjax, 30 * 60000);
}
} else {
loading.innerText = "...";
}
}
ajaxObj.send(null);
}
This function is similar to what was used in Part II for the MyBlog Gadget. The only difference is instead of fetching XML data, as in the case of the MyBlog Gadget, here the data is in text format.
Using this code, the SiteMeter API URL is opened with the SiteMeter code as the parameter, along with the parameters requesting the site statistics. The server responds with a string that is then passed to the parseData function. Note that we are using ajaxObj.responseText instead of ajaxObj.responseXML to get this string. The reason is that the return data is in the form of plain text. responseXML is used when the return data is in XML format so that it can be further parsed.
Using JavaScript and DOM to Parse Data
The next step after retrieving the data is to parse it and display it in human-readable format. In its simplest form, the parseData function looks like the following:
function parseData(Data)
{
SiteMeterDataValues = Data.split("|");
for (i=0; i<SiteMeterDataValues.length-1; i=i+2)
{
PageViews[i] = SiteMeterDataValues[i];
Visits[i] = SiteMeterDataValues[i+1];
}
cell0.innerHTML = '<div align="left"
onclick="showFlyout('0')">Summary</div>';
cell1.innerHTML = '<div align="left"
onclick="showFlyout('1')">Weekly</div>';
cell2.innerHTML = '<div align="left"
onclick="showFlyout('2')">Monthly</div>';
cell3.innerHTML = '<div align="left"
onclick="showFlyout('4')">Location</div>';
cell4.innerHTML = '<div align="left"
onclick="showFlyout('8')">Go Online</div>';
}
This function accepts the text data returned in the getTextAjax function. It splits the data in a JavaScript array, SiteMeterDataValues, and saves the corresponding values to the Pageviews and Visits arrays. The parseData function also generates the HTML data for the HTML cells to be displayed in the gadget window.
Loading a Portion of a Web Page with Ajax and DOM
Typically, you would want to display a portion of the web page in your gadget's flyout window (see Figure 9.6). This can be very useful for displaying ready-to-use information, such as if a website provides useful data in the HTML format, rather than in an XML format. In this scenario, displaying a portion of the web page directly in the gadget can be handy. The developer need not implement an extra layer to create the RSS feed and so on and use it in the gadget. This capability to load a portion of the web page directly in the gadget window provides considerable flexibility to the developer. In addition, there are the following benefits:
- No extra effort is required on the server application to extend the online service to accommodate the gadget's requirements.
- HTML data can be directly displayed in the gadget and does not need another library for loading and parsing, as it does in the case of XML data.
FIGURE 9.6. The Site Statistics Gadget displays a portion of the web page in the flyout window.

HTML code in a web page can have lot of nested tables and page elements, which can make traversing and parsing the data a bit tricky. The gadget should be properly tested before it is distributed.
A helpful utility is the Internet Explorer Developer Toolbar, a free Internet Explorer plug-in for quickly traversing a web page in real-time and understanding its elements and layout. It can be downloaded from http://www.microsoft.com/Downloads/details.aspx?FamilyID=e59c3964-672d-4511-bb3e-2d5e1db91038&displaylang=en.
Loading a web page feature can be divided into three parts:
- Preparing the gadget to accommodate the returned HTML
- Loading the web page, using Ajax, and inserting it into the gadget
- Extracting the HTML portion of the document for display in the flyout
Preparing the Gadget to Accommodate the HTML Data Returned
To populate the HTML data retrieved from an online page, you first have to create a hidden DIV element in the gadget main window (gadget.html). Use the following code:
<div id='sitesummary' style="visibility:hidden" ></div>
The purpose of the DIV element is to store the HTML returned from the Ajax function getHTMLAjax in the current page. (See code for the function in the next section.)
Using a DIV element to store the HTML has a number of advantages. First, because the HTML is now part of the gadget's main window Document object, DOM Level 1 methods such as GetElementById and GetElementByTagNames can be used to search the elements. Second, the DIV element easily accommodates the HTML portion from the online web page.
Another advantage is that after you have the HTML in raw format, you can use any mechanism, such as a regular expression search, to extract and parse information from it. Many JavaScript regular expression libraries are available that can be used for this purpose. As you will see in the sample code in the next section, having a DIV element as the container of the HTML data makes HTML parsing much easier.
Loading the Web Page, Using Ajax, and Inserting It into the Gadget
The XMLHTTPRequest object is used to retrieve the HTML. Here is the function that takes a URL as the parameter and saves the returned HTML in the gadget's DIV element sitesummary.
function getHTMLAjax(pageURL) {
htmlObj = new ActiveXObject("Microsoft.XMLHTTP");
htmlObj.open("GET", pageURL, true);
htmlObj.onreadystatechange = function() {
if (htmlObj.readyState === 4) {
if (htmlObj.status === 200) {
document.getElementById('sitesummary').innerHTML
= htmlObj.responseText;
parseHTML()
} else {
chkConn = setInterval(getHTMLAjax, 30 * 60000);
}
}
}
htmlObj.send(null);
}
Notice the SetInterval call, which, in the case of error, calls the getHTMLAjax function after 30 minutes. Details of this function were already discussed in Chapter 5, "Creating a Simple Gadget with RSS/Atom Feed."
Note that the HTML is returned as text and is inserted directly into the DIV element previously created to hold the data. The htmlObj.responseText property contains the HTML of the entire page. For example, if the URL passed in the function is http://www.sitemeter.com/?a=stats&s=s41vistagadgets, the DIV element sitesummary will have the complete source code of the web page and become the part of the gadget window's HTML page source.
Extracting the HTML Portion of the Document for Display in the Flyout
After you have the web page's HTML, the tricky part is to extract specific information from it. As you can see in Figure 9.7, the web page contains a lot of information, but the gadget needs to display just the statistics part. You can use the Internet Explorer Developer Toolbar (mentioned earlier) to get to the HTML element (in this case it's a table) that you want to extract.
FIGURE 9.7. The figure shows the <TABLE> selected in the Explorer Toolbar (lower left). It also shows the corresponding table selected in the web page that encapsulates the site summary with the visits and page views blocks.

NOTE
The Internet Explorer Developer Toolbar can be enabled from the Internet Explorer menu bar by clicking View, Explorer bar, IE Developer Toolbar.
The Developer Toolbar also makes it easier to understand the layout and hierarchy of elements. Figure 9.7 shows the element hierarchy, which illustrates the table that has the information we want to display in the flyout window. The following function, parseHTML, parses the HTML document to acquire the table. This table is then stored in the global variable SiteMeterSummary.
function parseHTML()
{
try{
tcMain = document.getElementById("Table_01");
if (tcMain)
{
var TableID = tcMain.childNodes[0] ;
var dataTable = TableID.childNodes[1].childNodes[0].childNodes[0]
.childNodes[0].childNodes[1].childNodes[1].childNodes[1]
.childNodes[0].childNodes[0].childNodes[1].childNodes[0];
if (dataTable)
{
var str = dataTable.outerHTML
if (str)
{
SiteMeterSummary = str;
}
}
}
}
catch
(
document.write('Error occured in parseHTML!'),
}
}
There are a number of methods to traverse the DOM nodes of an HTML page. This is one of the simplest methods, but any change in the web page HTML can break this code. This method uses childNodes hierarchy, which is a W3C standard (DOM Level 1), to retrieve a collection of HTML elements. The HTML data retrieved is stored in the variable str, which is then stored in the global variable SiteMeterSummary.
More information on childNodes can be found at http://msdn2.microsoft.com/en-us/library/ms537445.aspx, and the W3C DOM Level 1 specification at http://www.w3.org/TR/2000/WD-DOM-Level-1-20000929/.
This method, parseHTML, is implementation specific and the hierarchy is applied based on the table structure of this particular page. For example, a particular web page might have table ID myuniquetable1 specified, which you want to extract. In that case you can use the getElementById function directly rather than the childNodes hierarchy.
function parseHTML()
{
tcMain = document.getElementById("myuniquetable1");
if (tcMain)
{
var str = tcMain.outerHTML
if (str)
{
SiteMeterSummary = str;
}
}
}
Design Considerations
The Site Statistics Gadget is an information gadget, so the design needs to be simple and functional. With this goal in mind, design considerations should focus on
- Theme and images used in the gadget
- Layout of the gadget
- Usability of the gadget
The following sections take a look at these design considerations from the perspective of building the SiteMeter gadget.
Theme and Images of the Gadget
For the Site Statistics Gadget, the design starts with the theme, which is the website's logo and color scheme. Figure 9.8 shows the logo.
FIGURE 9.8. The Site Statistics Gadget icon with the SiteMeter logo gives the gadget an identity.

NOTE
It's important to note that the Site Statistics Gadget and the icons and logos used in the gadget are included with the permission of the website www.sitemeter.com. If you want to create a gadget for a third-party website and/or use its logos, icons, and so on, make sure that you have permission to do so.
The gadget's icon was created to match the theme. Notice how the graph in the logo is symbolic of the gadget's core functionality. Next is the gadget window (see Figure 9.9). The information gadget needs to be simple and feature rich, so a green color scheme matching the website and a simple layout is best.
FIGURE 9.9. The Site Statistics Gadget in the Sidebar mimics the www.sitemeter.com theme.

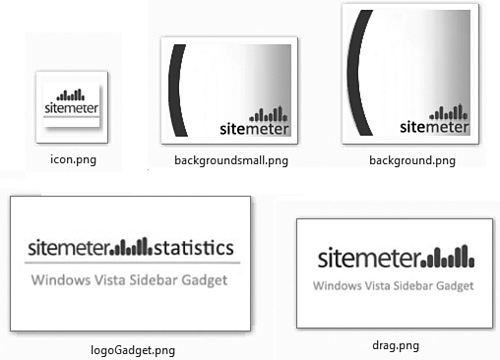
The website's logo, www.sitemeter.com, gives the gadget a sense of identity. Figure 9.10 shows some of the images used in the gadget to simulate the theme.
FIGURE 9.10. All the images used in the Site Statistics Gadget use the same color scheme.
Layout of the Gadget
The layout of the gadget is similar to the sample framework in that it utilizes the same file structure (see Figure 9.11). It needs a code file for each of the three pages—the gadget window, the flyout window, and the Settings page. The gadget framework created in Part II can be reused.
The gadget manifest is changed to accommodate information specific to the Site Statistics Gadget:
<?xml version="1.0" encoding="utf-8" ?>
<gadget>
<name>- Site Statistics -</name>
<namespace>Innovate.Gadgets</namespace>
<version>1.0</version>
<author name="Rajesh Lal">
<logo src="images/logo.png" />
<info url="www.innovatewithgadgets.com" />
</author>
<copyright>Copyright© 2008</copyright>
<description>Counter 'n' Statistics provided by Sitemeter.com</description>
<icons>
<icon width="70" height="80" src="images/icon.png" />
</icons>
<hosts>
<host name="sidebar">
<base type="HTML" apiVersion="1.0.0" src="gadget.html" />
<permissions>Full</permissions>
<platform minPlatformVersion="1.0" />
<defaultImage src="images/drag.png"/>
</host>
</hosts>
</gadget>
FIGURE 9.11. The file structure and layout of the Site Statistics Gadget is built upon the MyBlog Gadget framework.

As you can see in the gadget manifest, the title and description have changed but all other details are almost the same, apart from the fact that images now refer to the images specifically created for the Site Statistics Gadget.
Usability of the Gadget
The gadget's usability involves the way the gadget interacts with the user. In other words, what options does the gadget provide to the user to make it easy to traverse through different websites? In this case, the options that the gadget provides include enabling the user to specify more than one website and to easily navigate the site statistics for each website.
The standard mouseover effects display arrows in the title to traverse the different websites being monitored by the SiteMeter service. This keeps the gadget clutter free.
Figure 9.12 illustrates two instances of the Site Statistics Gadget for the sites www.innovatewithgadgets.com and www.widgets-gadgets.com.
FIGURE 9.12. Unobtrusive traversing through multiple website statistics keeps the gadget interface clutter free.
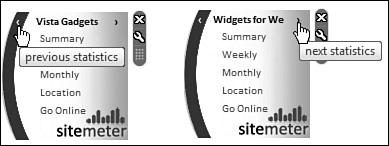
Notice in Figure 9.12 how the proper use of tooltip information enhances the usability. Double-clicking on the title refreshes the site summary data.
Developing the Gadget
Using an existing framework makes creating a gadget much easier. The first part is integration, followed by refining the framework further to meet your needs. Here, we start with the gadget framework created in Chapter 7, "The MyBlog Gadget Revisited," and customize it according to our requirements.
To start, make a copy of the MyBlog Gadget project and open the folder as a website from within Visual Studio and then make changes to it. To test the gadget side by side while developing it, just copy the project source in the Users gadget folder (%UserProfile%AppDataLocalMicrosoftWindows SidebarGadgets).
In Visual Studio, go to the File menu, click Open and then the name of the submenu website, and give the location to the path of the folder. Make sure you have selected File System first. The source of the Site Statistics project and the gadget are included with this book's online supplemental materials. You can open the folder directly in Visual Studio to go through them. After you open the website you will see a file structure similar to Figure 9.11 in the Solutions Explorer.
The development of the gadget can be divided into three parts:
- Integrating the existing framework
- Retrieving data for the site summary using the API and the online web page
- Displaying graphs and pie charts based on the API and SiteMeter code
Each of these parts is detailed in the following sections.
Integrating the Existing Framework
Because the existing framework for the MyBlog Gadget is also an information gadget, you need most of the common functionality in this gadget.
The place to start is with changes in the manifest file gadget.xml and then the images for the logo, background, and so on. We then need to customize the Settings page for adding and removing items and to accommodate the title and SiteMeter code string.
A Mini Me version of the gadget option will be kept to display the gadget in a smaller window. This helps to conserve gadget real estate and provides an extra check box for added features. See Figure 9.13 for the Settings page customization. Most of these changes are done in the Settings.html and the Settings.js files.
FIGURE 9.13. The Settings page for the Site Statistics gadget with added features and SiteMeter code.

The Added Features check box extends the basic gadget to display other statistical data related to the web browsers, operating systems, and regional information that does not show in the gadget's default simple view.
By default the gadget window has the following options:
- Site summary
- Weekly statistical view
- Monthly statistical view
- Location summary
- Shortcut link to go to the website
When the Added Features option is selected, yearly summary, country view, operating system, and browser are also available (see Figure 9.14).
FIGURE 9.14. The Site Statistics Gadget with Added Features checked shows more options.

Added features provide the following in addition to the basic features:
- Yearly statistics
- Statistics by region
- Data on operating systems
- Types of web browsers used
Retrieving Data for Site Summary Using API and Online Web Page
Retrieving the data is done using functions related to two categories: the HTML data and the text data. The getHTMLAjax function parses the online web page and extracts the site summary. This HTML data is then further parsed using the parseHTML function. The getTextAjax function calls the online API and fetches the data in plain text. The parseData function then processes this information. These two function calls are wrapped inside the getData function, which is called during the first-time setup of the gadget.
Here is the code for the getData function, called inside the setup function that loads when the gadget loads the first time:
function setup()
{
SystemSetup();
Resize();
getData();
}
function getData()
{
getHTMLAjax("http://www.sitemeter.com/?a=stats&s=" +
System.Gadget.Settings.read("sitemeterCode") + "&gadget=true");
getTextAjax();
}
The following sections go through the HTML- and text-related functions in more detail.
The getHTMLAjax Function
The getHTMLAjax function loads the web page from which you need to fetch information—in this case, the statistics page where the summary is displayed. You need to get the summary portion of the HTML from that page and display it in the flyout window. This process is done in two parts: loading the HTML page and then extracting the HTML portion of the data.
function getHTMLAjax(pageURL)
{
htmlObj = new ActiveXObject("Microsoft.XMLHTTP");
htmlObj.open("GET", pageURL, true);
htmlObj.onreadystatechange = function()
{
if (htmlObj.readyState === 4)
{
if (htmlObj.status === 200)
{
document.getElementById('sitesummary').innerHTML =
htmlObj.responseText;
parseHTML()
}
else {
chkConn = setInterval(getHTMLAjax, 30 * 60000);
}
}
}
htmlObj.send(null);
}
As you can see in the function, pageURL is a variable that contains the SiteMeter page that has the detailed summary. The XMLHTTP object is used to load the page, and the HTML of the page is stored in the sitesummary element of the gadget window.
The parseHTMLAjax Function
After storing the HTML of the page in the sitesummary DIV element, the next step is to filter the required data; that is, the HTML table containing the Summary, Visits, and Page View portions. For this, first you need to figure out the closest table that has a unique ID in the HTML page. This is done with the IE Developer Toolbar as shown previously in Figure 9.7. In this case the ID of the table is Table_01, and the table that has the required HTML portion is inside the Table_01 in the following hierarchy, as shown in the code:
function parseAjax()
{
tcMain = document.getElementById("Table_01");
if (tcMain)
{
var TableID = tcMain.childNodes[0] ;
var dataTable = TableID.childNodes[1].childNodes[0].childNodes[0]
.childNodes[0].childNodes[1].childNodes[1].childNodes[1].
childNodes[0].childNodes[0].childNodes[1].childNodes[0];
if (dataTable)
{
var str = dataTable.outerHTML
SiteMeterSummary = str;
}
}
}
dataTable stores the HTML data of the required portion that needs to be displayed in the gadget. The outerHTML of the data table is stored in the variable SiteMeterSummary, to be displayed in the flyout window.
The getTextAjax Function
The getTextAjax function calls the online API to retrieve information from the server. This sends the SiteMeter code string as one of the parameters in the URL and retrieves the text data, which then has to be parsed.
function getTextAjax() {
error.style.visibility = "hidden";
loading.style.visibility = "visible";
content.style.visibility = "hidden";
loading.style.visibility = "visible";
loading.title = "Connecting...";
blogtitle.innerText = Mid(System.Gadget.Settings.read("sitemeterTitle"),0,14);
blogtitle.title = System.Gadget.Settings.read("sitemeterTitle");
var SMC = System.Gadget.Settings.read("sitemeterCode");
var firstthree = Mid(SMC,0,3);
ajaxObj = new ActiveXObject("Microsoft.XMLHTTP");
myURL = "http://" + firstthree + ".sitemeter.com/rpc/v6/server.asp?a=
GetChartData&n=9&p1=" + SMC + "&p2=&p3=6&p4=0&p5=208%2E70%2E116%2E25
&p6=HTML&p7=1&p8=%2E%3Fa%3Dstatistics&p9=&rnd=47190";
ajaxObj.open("GET", myURL, true);
ajaxObj.onreadystatechange = function() {
if (ajaxObj.readyState === 4) {
if (ajaxObj.status === 200) {
loading.innerText = "";
page = 0;
parseData(ajaxObj.responseText);
content.style.visibility = "visible";
loading.style.visibility = "hidden";
} else {
var chkConn;
loading.innerText = "Unable to connect...";
chkConn = setInterval(getTextAjax, 30 * 60000);
}
} else {
loading.innerText = "...";
}
}
ajaxObj.send(null);
}
In this code, myURL contains the API URL that needs to be called to get the data for the week this web address is opened, using the XMLHTTP object. The parseData function is used to parse the returned data, which takes the parameter ajaxObj.responseText.
The parseData Function
This function parses the data retrieved from the server and displays the elements in the gadget main window. This function also takes care of the Added Features option.
function parseData(Data)
{
SiteMeterDataValues = Data.split("|");
for (i=0; i<SiteMeterDataValues.length-1; i=i+2)
{
PageViews[i] = SiteMeterDataValues[i];
Visits[i] = SiteMeterDataValues[i+1];
}
if (System.Gadget.Settings.read("completeView") ==true)
{
cell0.innerHTML = '<div align="left"
onclick="showFlyout('0')">Summary</div>';
cell1.innerHTML = '<div align="left"><a
onclick="showFlyout('1')">Week</a> /<a
onclick="showFlyout('2')">Mon</a> /<a
onclick="showFlyout('3')">Year</a></div>';
cell2.innerHTML = '<div align="left"><a
onclick="showFlyout('4')">Region</a> /<a
onclick="showFlyout('5')">Location</a></div>';
cell3.innerHTML = '<div align="left"><a
onclick="showFlyout('6')">OS</a> /<a
onclick="showFlyout('7')">Browser</a></div>';
cell4.innerHTML = '<div align="left" onclick="showFlyout('8')">Go
Online</div>';
}
else
{
cell0.innerHTML = '<div align="left"
onclick="showFlyout('0')">Summary</div>';
cell1.innerHTML = '<div align="left"
onclick="showFlyout('1')">Weekly</div>';
cell2.innerHTML = '<div align="left"
onclick="showFlyout('2')">Monthly</div>';
cell3.innerHTML = '<div align="left"
onclick="showFlyout('4')">Location</div>';
cell4.innerHTML = '<div align="left" onclick="showFlyout('8')">Go
Online</div>';
}
}
In this code, the data is split and saved into two arrays for future use: page views and visits. The function parseData also generates the HTML for the gadget window. The variable completeView is based on the Added Features check box in the Settings page. As you can see, for each of the cells a unique number is passed in the showFlyout function. This number can vary from one to eight. The showFlyout function is discussed in more detail in the next section.
Graphs and Pie Charts Based on the API
The graphs and pie charts that make the gadget so rich and user friendly come directly from the SiteMeter website. Although these could theoretically be created from the data returned from the service, it's much easier to use the same API to display the charts that are used on the website.
It is necessary to provide different parameters to the web API when talking to the service. And, based on the parameters, different graphs are generated and displayed on the web page. This feature is implemented in the flyout window when the content is generated for display.
The showFlyout Function
The showFlyout function is called when the user clicks on the cell. The number passed to this function is used to distinguish between the cells the user has clicked. For example, if the user clicks on the last cell with the text Go Online, the parameter 8 is passed to the showFlyout function. This action triggers a new web browser with the URL as the statistics page on the SiteMeter.
In the gadget window, the showFlyout function uses the following function call for opening a browser with the SiteMeter page for that particular code:
System.Shell.execute(statsURL);
The statsURL is built based on the SiteMeter code and then passed to the shell execute function to open the web browser.
function showFlyout(i)
{
if (i==System.Gadget.Settings.read("currentClickedCell"))
{
System.Gadget.Flyout.show = false;
System.Gadget.Settings.write("currentClickedCell", -1);
}
else
{
flyoutType = i;
if (i==8)
{
var firstthree = Mid(System.Gadget.Settings.
read("sitemeterCode"),0,3);
var statsURL = "http://www.sitemeter.com/?a=stats&s=" +
System.Gadget.Settings.read("sitemeterCode") +
"&gadget=true"
System.Shell.execute(statsURL);
}
else
{
System.Gadget.Settings.write("currentClickedCell", i);
System.Gadget.Flyout.show = true;
}
}
}
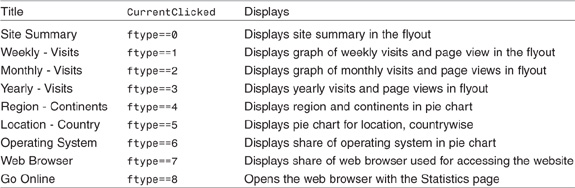
The showFlyout function also stores the clicked cell index if it is other than 8 in the variable currentClickedCell, which is used when the flyout window is loaded. Table 9.3 shows the different values of the currentclicked cell passed to the showFlyout function and further stored in the flyoutType variable used in the buildMyContent function.
TABLE 9.3. Different Values of the Flyout Type Stored When the User Clicks on the Corresponding Cell
The buildMyContent Function
The following shows the function buildMyContent, which is called on the page load of the flyout window.
function buildMyContent()
{
var ftype = System.Gadget.document.parentWindow.flyoutType
var flyoutSiteSummary =
System.Gadget.document.parentWindow.SiteMeterSummary;
var SMC = System.Gadget.Settings.read("sitemeterCode");
firstthree = Mid(SMC,0,3);
try
{
if ( ftype==0)
{
flyoutTitle ="Site Summary ";
dataFlyout = "<center>" + flyoutSiteSummary + "</center>";
}
if ( ftype==1)
{
flyoutTitle ="Weekly - Visits and Page Views";
ImagePath= "http://" + firstthree + ".sitemeter.com
![]() /rpc/v6/server.php?a=GetChart&n=9&p1=" + SMC + "&p2=&p3=6&p4=0&p5=
/rpc/v6/server.php?a=GetChart&n=9&p1=" + SMC + "&p2=&p3=6&p4=0&p5=
![]() 71%2E159%2E229%2E88&p6=HTML&p7=1&p8=%2E%3Fa%3Dstatistics&p9=&rnd=59693" ;
71%2E159%2E229%2E88&p6=HTML&p7=1&p8=%2E%3Fa%3Dstatistics&p9=&rnd=59693" ;
dataFlyout = '<br><h3><font face ="Calibiri" color="#006699">' +
![]() flyoutTitle + '</font> <a title ="More details at sitemeter
flyoutTitle + '</font> <a title ="More details at sitemeter
![]() statistics page" href="http://www.sitemeter.com/?a=stats&s=' + SMC + '&r=6&
statistics page" href="http://www.sitemeter.com/?a=stats&s=' + SMC + '&r=6&
![]() gadget=true" ><img src="images/up.gif" border=0/></a></h3><hr noshade="true"
gadget=true" ><img src="images/up.gif" border=0/></a></h3><hr noshade="true"
![]() size="1"><img src=' + ImagePath + ' border=0></font>'
size="1"><img src=' + ImagePath + ' border=0></font>'
}
if ( ftype==2)
{
flyoutTitle ="Monthly - Visits and Page Views";
ImagePath= "http://" + firstthree +".sitemeter.com/rpc/v6/server.
![]() php?a=GetChart&n=9&p1=" + SMC + "&p2=&p3=12&p4=0&p5=71%2E159%2E229%2E88&p6=
php?a=GetChart&n=9&p1=" + SMC + "&p2=&p3=12&p4=0&p5=71%2E159%2E229%2E88&p6=
![]() HTML&p7=1&p8=%2E%3Fa%3Dstatistics&p9=&rnd=32494" ;
HTML&p7=1&p8=%2E%3Fa%3Dstatistics&p9=&rnd=32494" ;
dataFlyout = '<br><h3><font face ="Calibiri" color="#006699">' +
![]() flyoutTitle + '</font> <a title ="More details at sitemeter
flyoutTitle + '</font> <a title ="More details at sitemeter
![]() statistics page" href="http://www.sitemeter.com/?a=stats&s=' + SMC + '&r=
statistics page" href="http://www.sitemeter.com/?a=stats&s=' + SMC + '&r=
![]() 12&gadget=true" ><img src="images/up.gif" border=0/></a></h3><hr noshade=
12&gadget=true" ><img src="images/up.gif" border=0/></a></h3><hr noshade=
![]() "true" size="1"><img src=' + ImagePath + ' border=0></font>'
"true" size="1"><img src=' + ImagePath + ' border=0></font>'
}
if ( ftype==3)
{
flyoutTitle ="Yearly - Visits and Page Views";
ImagePath= "http://" + firstthree + ".sitemeter.com/rpc/v6/server
![]() .php?a=GetChart&n=9&p1=" + SMC + "&p2=&p3=33&p4=0&p5=71%2E159%2E229%2E88&p6=
.php?a=GetChart&n=9&p1=" + SMC + "&p2=&p3=33&p4=0&p5=71%2E159%2E229%2E88&p6=
![]() HTML&p7=1&p8=%2E%3Fa%3Dstatistics&p9=&rnd=40437" ;
HTML&p7=1&p8=%2E%3Fa%3Dstatistics&p9=&rnd=40437" ;
dataFlyout = '<br><h3><font face ="Calibiri" color="#006699">' +
![]() flyoutTitle + '</font> <a title ="More details at sitemeter
flyoutTitle + '</font> <a title ="More details at sitemeter
![]() statistics page" href="http://www.sitemeter.com/?a=stats&s=' + SMC + '&r=
statistics page" href="http://www.sitemeter.com/?a=stats&s=' + SMC + '&r=
![]() 33&gadget=true" ><img src="images/up.gif" border=0/></a></h3><hr noshade=
33&gadget=true" ><img src="images/up.gif" border=0/></a></h3><hr noshade=
![]() "true" size="1"><img src=' + ImagePath + ' border=0></font>'
"true" size="1"><img src=' + ImagePath + ' border=0></font>'
}
if (ftype==4)
{
flyoutTitle ="Region - Continents";
ImagePath= "http://" + firstthree + ".sitemeter.com/rpc/v6/server.
![]() php?a=GetChart&n=9&p1=" + SMC + "&p2=&p3=81&p4=0&p5=71%2E159%2E229%2E88&p6=
php?a=GetChart&n=9&p1=" + SMC + "&p2=&p3=81&p4=0&p5=71%2E159%2E229%2E88&p6=
![]() HTML&p7=1&p8=%2E%3Fa%3Dstatistics&p9=&rnd=33756" ;
HTML&p7=1&p8=%2E%3Fa%3Dstatistics&p9=&rnd=33756" ;
dataFlyout = '<br><h3><font face ="Calibiri" color="#006699">' +
![]() flyoutTitle + '</font> <a title ="More details at sitemeter
flyoutTitle + '</font> <a title ="More details at sitemeter
![]() statistics page" href="http://www.sitemeter.com/?a=stats&s=' + SMC + '&r=
statistics page" href="http://www.sitemeter.com/?a=stats&s=' + SMC + '&r=
![]() 81&gadget=true" ><img src="images/up.gif" border=0/></a></h3><hr noshade=
81&gadget=true" ><img src="images/up.gif" border=0/></a></h3><hr noshade=
![]() "true" size="1"><img src=' + ImagePath + ' border=0></font>'
"true" size="1"><img src=' + ImagePath + ' border=0></font>'
}
if (ftype==5)
{
flyoutTitle ="Location - Countries";
ImagePath= "http://" + firstthree + ".sitemeter.com/rpc/v6/server.
![]() php?a=GetChart&n=9&p1=" + SMC + "&p2=&p3=83&p4=0&p5=75%2E15%2E87%2E230&p6=
php?a=GetChart&n=9&p1=" + SMC + "&p2=&p3=83&p4=0&p5=75%2E15%2E87%2E230&p6=
![]() HTML&p7=1
HTML&p7=1
&p8=%2E%3Fa%3Dstatistics&p9=&rnd=74995" ;
dataFlyout = '<br><h3><font face ="Calibiri" color="#006699">' +
![]() flyoutTitle + '</font> <a title ="More details at sitemeter
flyoutTitle + '</font> <a title ="More details at sitemeter
![]() statistics page" href="http://www.sitemeter.com/?a=stats&s=' + SMC + '&r=83&
statistics page" href="http://www.sitemeter.com/?a=stats&s=' + SMC + '&r=83&
![]() gadget=true" ><img src="images/up.gif" border=0/></a></h3><hr noshade="true"
gadget=true" ><img src="images/up.gif" border=0/></a></h3><hr noshade="true"
![]() size="1"><img src=' + ImagePath + ' border=0></font>'
size="1"><img src=' + ImagePath + ' border=0></font>'
}
if (ftype==6)
{
flyoutTitle ="Operating System";
ImagePath= "http://" + firstthree + ".sitemeter.com/rpc/v6/server.php
![]() ?a=GetChart&n=9&p1=" + SMC + "&p2=&p3=19&p4=0&p5=75%2E15%2E87%2E230&p6=HTML&p7=
?a=GetChart&n=9&p1=" + SMC + "&p2=&p3=19&p4=0&p5=75%2E15%2E87%2E230&p6=HTML&p7=
![]() 1&p8=%2E%3Fa%3Dstatistics&p9=&rnd=48531" ;
1&p8=%2E%3Fa%3Dstatistics&p9=&rnd=48531" ;
dataFlyout = '<br><h3><font face ="Calibiri" color="#006699">' +
![]() flyoutTitle + '</font> <a title ="More details at sitemeter
flyoutTitle + '</font> <a title ="More details at sitemeter
![]() statistics page" href="http://www.sitemeter.com/?a=stats&s=' + SMC + '&r=
statistics page" href="http://www.sitemeter.com/?a=stats&s=' + SMC + '&r=
![]() 19&gadget=true" ><img src="images/up.gif" border=0/></a></h3><hr noshade=
19&gadget=true" ><img src="images/up.gif" border=0/></a></h3><hr noshade=
![]() "true" size="1"><img src=' + ImagePath + ' border=0></font>'
"true" size="1"><img src=' + ImagePath + ' border=0></font>'
}
if (ftype==7)
{
flyoutTitle ="Web browser used";
ImagePath= "http://" + firstthree + ".sitemeter.com/rpc/v6/server.php
![]() ?a=GetChart&n=9&p1=" + SMC + "&p2=&p3=13&p4=0&p5=75%2E15%2E87%2E230&p6=
?a=GetChart&n=9&p1=" + SMC + "&p2=&p3=13&p4=0&p5=75%2E15%2E87%2E230&p6=
![]() HTML&p7=1&p8=%2E%3Fa%3Dstatistics&p9=&rnd=97912" ;
HTML&p7=1&p8=%2E%3Fa%3Dstatistics&p9=&rnd=97912" ;
dataFlyout = '<br><h3><font face ="Calibiri" color="#006699">' +
![]() flyoutTitle + '</font> <a title ="More details at sitemeter
flyoutTitle + '</font> <a title ="More details at sitemeter
![]() statistics page" href="http://www.sitemeter.com/?a=stats&s=' + SMC + '&r=
statistics page" href="http://www.sitemeter.com/?a=stats&s=' + SMC + '&r=
![]() 13&gadget=true" ><img src="images/up.gif" border=0/></a></h3><hr noshade=
13&gadget=true" ><img src="images/up.gif" border=0/></a></h3><hr noshade=
![]() "true" size="1"><img src=' + ImagePath + ' border=0></font>'
"true" size="1"><img src=' + ImagePath + ' border=0></font>'
}
document.write(dataFlyout);
}
catch(e)
{
document.write('Error occured in buildMyContent function'),
}
}
This function needs two values: the SiteMeter code and the variable SMC. The first three characters of the SiteMeter code distinguish the server as described earlier in this chapter, in the "Application Programming Interface" section. This is stored in the variable with the name firstthree.
As per Table 9.3, the buildMyContent function creates the HTML to be displayed in the flyout window. This function calls the online URL with different parameters to generate the image of the server statistics. The HTML is created based on the web API that generates the image to be displayed. The contents of the data flyout are finally rendered in the window using the function document.write. Figure 9.15 shows the graph view for the Monthly Visits selection by the user.
FIGURE 9.15. The flyout window generates and displays HTML based on which cell the user clicked in the gadget main window.

Let's go through an example where the flyout window type variable ftype value is 2. The value of 2 means that the user clicked on the monthly summary link in the gadget main window and the corresponding graph needs to be displayed in the flyout. This calls the following portion of the code:
if ( ftype==2)
{
flyoutTitle ="Monthly - Visits and Page Views";
ImagePath= "http://" + firstthree +".sitemeter.com
![]() /rpc/v6/server.php?a=GetChart&n=9&p1=" + SMC + "&p2=&p3=12&p4=0&p5=71%2E159%
/rpc/v6/server.php?a=GetChart&n=9&p1=" + SMC + "&p2=&p3=12&p4=0&p5=71%2E159%
![]() 2E229%2E88&p6=HTML&p7=1&p8=%2E%3Fa%3Dstatistics&p9=&rnd=32494" ;
2E229%2E88&p6=HTML&p7=1&p8=%2E%3Fa%3Dstatistics&p9=&rnd=32494" ;
dataFlyout = '<br><h3><font face ="Calibiri" color="#006699">'
![]() + flyoutTitle + '</font> <a title ="More details at sitemeter
+ flyoutTitle + '</font> <a title ="More details at sitemeter
![]() statistics page" href="http://www.sitemeter.com/?a=stats&s=' + SMC + '&r=
statistics page" href="http://www.sitemeter.com/?a=stats&s=' + SMC + '&r=
![]() 12&gadget=true" ><img src="images/up.gif" border=0/></a></h3><hr noshade=
12&gadget=true" ><img src="images/up.gif" border=0/></a></h3><hr noshade=
![]() "true" size="1"><img src=' + ImagePath + ' border=0></font>'
"true" size="1"><img src=' + ImagePath + ' border=0></font>'
}
The code can be thought as assigning values to three variables: First is the flyoutTitle variable, which stores the heading of the flyout window. Next is the imagepath variable, which displays the actual graph or pie chart (in this case graph), based on the web API provided by www.sitemeter.com. The last variable is the dataFlyout, which basically encapsulates the first two variables, only in an HTML format that is written back to the flyout's HTML page.
Similarly, a value of 7 for ftype displays the statistics on browser usage for the website as shown in the following code (see Figure 9.16). Notice the difference in the imagepath variable.
if (ftype==7)
{
flyoutTitle ="Web browser used";
ImagePath= "http://" + firstthree +
".sitemeter.com/rpc/v6/server.php?a=GetChart&n=9&p1=" + SMC + "
![]() &p2=&p3=13&p4=0&p5=75%2E15%2E87%2E230&p6=HTML&p7=1&p8=%2E%3Fa%3Dstatistics&
&p2=&p3=13&p4=0&p5=75%2E15%2E87%2E230&p6=HTML&p7=1&p8=%2E%3Fa%3Dstatistics&
![]() p9=&rnd=97912" ;
p9=&rnd=97912" ;
dataFlyout = '<br><h3><font face ="Calibiri" color="#006699">' +
![]() flyoutTitle + '</font> <a title ="More details at sitemeter
flyoutTitle + '</font> <a title ="More details at sitemeter
![]() statistics page" href="http://www.sitemeter.com/?a=stats&s=' + SMC + '&r=
statistics page" href="http://www.sitemeter.com/?a=stats&s=' + SMC + '&r=
![]() 13&gadget=true" ><img src="images/up.gif" border=0/></a></h3><hr noshade="true"
13&gadget=true" ><img src="images/up.gif" border=0/></a></h3><hr noshade="true"
![]() size="1"><img src=' + ImagePath + ' border=0></font>'
size="1"><img src=' + ImagePath + ' border=0></font>'
}
FIGURE 9.16. A flyout window showing the pie chart for the share of web browsers.
