Chapter 1
Getting Started with Analytics
Why should you care about analytics? Because networking—like every other industry—is undergoing transformation. Every industry needs to fill data scientist roles. Anyone who is already in an industry and learns data science is going to have a leg up because he or she already has industry subject matter expert (SME) skills, which will help in recognizing where analytics can provide the most benefit.
Data science is expected to be one of the hottest job areas in the near future. It is also one of the better-paying job areas. With a few online searches, you can spend hours reading about the skills gap, low candidate availability, and high pay for these jobs. If you have industry SME knowledge, you are instantly more valuable in the IT industry if you can help your company further the analytics journey. Your unique expertise combined with data science skills and your ability to find new solutions will set you apart.
This book is about uncovering use cases and providing you with baseline knowledge of networking data, algorithms, biases, and innovative thinking techniques. This will get you started on transforming yourself. You will not learn everything you need to know in one book, but this book will help you understand the analytics big picture, from the data to the use cases. Building models is one thing; building them into productive tools with good workflows is another thing; getting people to use them to support the business is yet another. You will learn ways to identify what is important to the stakeholders who use your analytics solutions to solve their problems. You will learn how to design and build these use cases.
What This Chapter Covers
Analytics discovery can be boiled down to three main themes, as shown in Figure 1-1. Understanding these themes is a critical success factor for developing effective use cases.
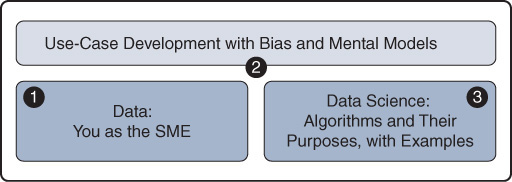
Data: You as the SME
You, as an SME, will spend the majority of your time working with data. Understanding and using networking data in detail is a critical success factor. Your claim to fame here is being an expert in the networking space, so you need to own that part. Internet surveys show that 80% or more of data scientists’ time is spent collecting, cleaning, and preparing data for analysis. I can confirm this from my own experience, and I have therefore devoted a few chapters of this book to helping you develop a deeper understanding of IT networking data and building data pipelines. This area of data prep is referred to as “feature engineering” because you need to use your knowledge and experience to translate the data from your world into something that can be used by machine learning algorithms.
I want to make a very important distinction about data sets and streaming data here, early in this book. Building analytics models and deploying analytics models can be two very different things. Many people build analytics models using batches of data that have been engineered to fit specific algorithms. When it comes time to deploy models that act on live data, however, you must deploy these models on actual streaming data feeds coming from your environment. Chapter 2, “Approaches for Analytics and Data Science,” provides a useful new model and methodology to make this deployment easier to understand and implement. Even online examples of data science mostly use captured data sets to show how to build models but lack actual deployment instructions. You will find the methodology provided in this book very valuable for building solutions that you can explain to your stakeholders and implement in production.
Use-Case Development with Bias and Mental Models
The second theme of this book is the ability to find analytics use cases that fit your data and are of interest to your company. Stakeholders often ask the questions “What problem are you going to solve?” and “If we give you this data and you get some cool insights, what can we do about them?” If your answers to these questions are “none” and “nothing,” then you are looking at the wrong use cases.
This second theme involves some creative thinking inside and outside your own mental models, thinking outside the box, and seeing many different perspectives by using bias as a tool. This area, which can be thought of as “turning on the innovator,” is fascinating and ever growing. Once you master some skills in this space, you will be more effective at identifying potential use cases. Then your life becomes an exercise in prioritizing your time to focus on the most interesting use cases only. This book defines many techniques for fostering innovative thinking so you can create some innovative use cases in your own area of expertise.
Data Science: Algorithms and Their Purposes
The third theme of this book is the intuition behind some major analytics use cases and algorithms. As you get better at uncovering use cases, you will understand how the algorithms support key findings or insights. This understanding allows you to combine algorithms with your mental models and data understanding to create new and insightful use cases in your own space, as well as adjacent and sometimes opposing spaces.
You do not typically find these themes of networking expert, data expert, and data scientist in the same job roles. Take this as innovation tip number one: Force yourself to look at things from other perspectives and step out of your comfort zone. I still spend many hours a week of my own time learning and trying to gain new perspectives. Chapter 5, “Mental Models and Cognitive Bias,” examines these techniques. The purpose of this book is to help expand your thinking about where and how to apply analytics in your job role by taking a different perspective on these main themes. Chapter 7, “Analytics Use Cases and the Intuition Behind Them,” explores the details of common industry uses of analytics. You can mix and match them with your own knowledge and bias to broaden your thinking for innovation purposes.
I chose networking use cases for this book because networking has been my background for many years. My customer-facing experience makes me an SME in this space, and I can easily relate the areas of networking and data science for you. I repeat that the most valuable analytics use cases are found when you combine data science with your own domain expertise (which SMEs have) in order to find the insights that are most relevant in your domain. However, analytics use cases are everywhere. Throughout the book, a combination of popular innovation-fostering techniques are used to open your eyes, and your mind, to be able to recognize use cases when you see them.
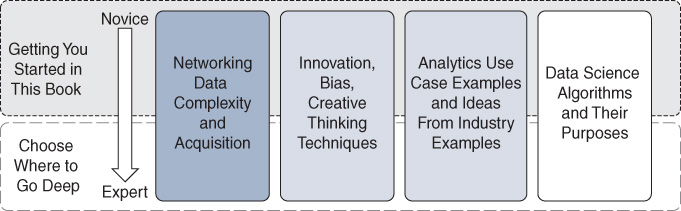
After reading this book, you will have analytics skills related to different job roles, and you will be ready to engage in conversation on any of them. One book, however, is not going to make you an expert. As shown in Figure 1-2, this book prepares you with the baseline knowledge you need to take the next step in a number of areas, as your personal or professional interest dictates. The depth that you choose will vary depending on your interest. You will learn enough in this book to understand your options for next steps.
What This Book Does Not Cover
Data science and analytics is a very hot area right now. At the time of this writing, most “hot new jobs” predictions have data science and data engineering among the top five jobs for the next decade. The goal of this book is to get you started on your own analytics journey by filling some gaps in the Internet literature for you. However, a secondary goal of this book is to avoid getting so bogged down in analytics details and complex algorithms that you tune out.
This book covers a broad spectrum of useful material, going just deep enough to give you a starting point. Determining where to drill deep versus stay high-level can be difficult, but this book provides balanced material to help you make these choices. The first nine chapters of this book provide you with enough guidance to understand a solution architecture on a topic, and if any part of the solution is new to you, you will need to do some research to find the final design details of your solution.
Building a Big Data Architecture
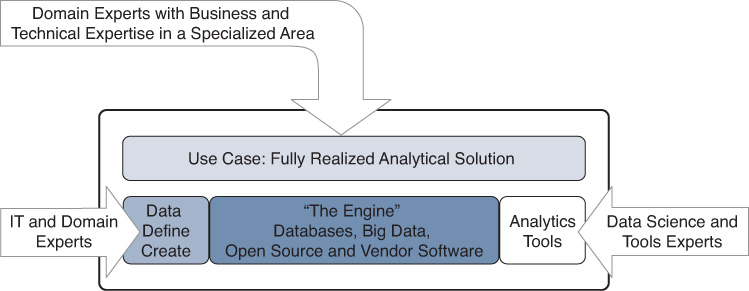
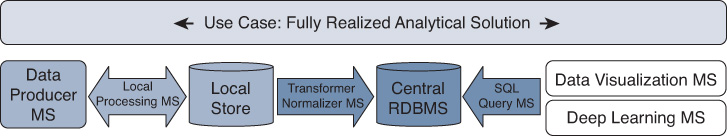
An overwhelming number of big data, data platform, data warehouse, and data storage options are available today, but this book does not go into building those architectures. Components and functions provided in these areas, such as databases and message busses, may be referenced in the context of solutions. As shown in Figure 1-3, these components and functions provide a centralized engine for operationalizing analytics solutions.
These data processing resources are central to almost all analytics solutions. Suggestions for how to build and maintain them are widely documented, and these resources are available in the cloud for very reasonable cost. While it is interesting to know how to build these architectures, for a new analytics professional, it is more important to know how to use them. If you are new to analytics, learning data platform details will slow down your learning in the more important area of analytics algorithms and finding the use cases.
Methods and use cases for the networking domain are lacking. In addition, it is not easy to find innovative ways to develop interesting and useful data science use cases across disparate domains of expertise. While big data platforms/systems are a necessary component of any deployed solution, they are somewhat commoditized and easy to acquire, and the trend in this direction continues.
Microservices Architectures and Open Source Software
Fully built and deployed analytics solutions often include components reflecting some mix of vendor software and open source software. You build these architectures using servers, virtual machines, containers, and application programming interface (API) reachable functions, all stitched together into a working pipeline for each data source, as illustrated in Figure 1-4. A container is like a very lightweight virtual machine, and microservices are even lighter: A microservice is usually a container with a single purpose. These architectures are built on demand, as needed.
Based on the trends in analytics, most analytics pipelines are expected to be deployed as such systems of microservices in the future (if they are not already). Further, automated systems deploy microservices at scale and on demand. This is a vast field of current activity, research, and operational spending that is not covered in this book. Popular cloud software such as OpenStack and Kubernetes, along with network functions virtualization (NFV), has proven that this functionality, much like the building of big data platforms, is becoming commoditized as automation technology and industry expertise in this space advance.
R Versus Python Versus SAS Versus Stata
This book does not recommend any particular platform or software. Arguments about which analytics software provides the best advantages for specific kinds of analysis are all over the Internet. This book is more concept focused than code focused, and you can use the language of your choice to implement it. Code examples in this book are in Python. It might be a cool challenge for you to do the same things in your own language of choice. If you learn and understand an algorithm, then the implementation in another language is mainly just syntax (though there are exceptions, as some packages handle things like analytics vector math much better than others). As mentioned earlier, an important distinction is the difference between building a model and deploying a model. It is possible that you will build a model in one language, and your software development team will then deploy it in a different language.
Databases and Data Storage
This book does not cover databases and data storage environments. At the center of most analytics designs, there are usually requirements to store data at some level, either processed or raw, with or without associated schemas for database storage. This core component exists near or within the central engine. Just as with the overall big data architectures, there are many ways to implement database layer functionality, using a myriad of combinations of vendor and open source software. Loads of instruction and research are freely available on the Internet to help you. If you have not done it before, take an hour, find a good site or blog with instructions, and build a database. It is surprisingly simple to spin up a quick database implementation in a Linux environment these days, and storage is generally low cost. You can also use cloud-based resources and storage. The literature surrounding the big data architecture is also very detailed in terms of storage options.
Cisco Products in Detail
Cisco has made massive investments in both building and buying powerful analytics platforms such as Tetration, AppDynamics, and Stealthwatch. This book does not cover such products in detail, and most of them are already covered in depth in other books. However, because these solutions can play parts in an overall analytics strategy, this book covers how the current Cisco analytics solutions fit into the overall analytics picture and provides an overview of the major use cases that these platforms can provide for your environment. (This coverage is about the use cases, however, not instructions for using the products.)
Analytics and Literary Perspectives
No book about analytics would be complete without calling out popular industry terminology and discussion about analytics. Some of the terminology that you will encounter is summarized in Figure 1-5. The rows in this figure show different aspects of data and analytics, and the columns show stages of each aspect.
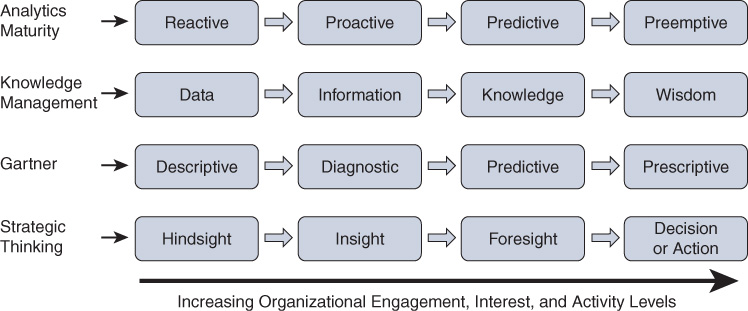
Run an Internet search on each of the aspect row headings in Figure 1-5 to dig deeper into the initial purpose and interpretation. How you interpret them should reflect your own needs. These are continuums, and these continuums are valuable in determining the level of “skin in the game” when developing groundbreaking solutions for your environment.
If you see terminology that resonates with you, that is what you should lead with in your company. Start there and grow up or down, right or left. Each of the terms in Figure 1-5 may invoke some level of context bias in you or your audience, or you may experience all of them in different places. Every stage and row has value in itself. Each of these aspects has benefits in a very complete solutions architecture. Let’s quickly go through them.
Analytics Maturity
Analytics maturity in an organization is about how the organization uses its analytics findings. If you look at analytics maturity levels in various environments, you can describe organizational analytics maturity along a scale of reactive to proactive to predictive to preemptive—for each individual solution. As these words indicate, analytics maturity describes the level of maturity of a solution in the attempt to solve a problem with analytics.
For example, reactive maturity when combined with descriptive and diagnostic analytics simply means that you can identify a problem (descriptive) and see the root causes (diagnostic), but you probably go out and fix that problem through manual effort, change controls, and feet on the street (reactive). If you are at the reactive maturity level, perhaps you see that a network device has consumed all of its memory, and you have identified a memory leak, and you have to schedule an “emergency change” to reboot/upgrade it. This is a common scenario in less mature networking environments. This need to schedule this emergency change and impact schedules of all involved is very much indicative of a reactive maturity level.
Continuing with the same example, if your organization is at the proactive maturity level, you are likely to use analytics (perhaps regression analysis) to proactively go look for the memory leak trend in all your other devices that are similar to this one. Then you can proactively schedule a change during a less expensive timeframe. You can identify places where this might happen using simple trending and heuristics.
At the predictive maturity level, you can use analytics models such as simple extrapolation or regression analysis to determine when this device will experience a memory leak. You can then better identify whether it needs to be in this week’s change or next month’s change, or whether you must fix it after-hours today. At this maturity level, models and visualizations show the predictions along with the confidence intervals assigned to memory leak impacts over time.
With preemptive maturity, your analytics models can predict when a device will have an issue, and your automated remediation system can automatically schedule the upgrade or reload to fix this known issue. You may or may not get a request to approve this automated work. Obviously, this “self-healing network” is the holy grail of these types of systems.
It is important to keep in mind that you do not need to get to a full preemptive state of maturity for all problems. There generally needs to be an evaluation of the cost of being preemptive versus the risk and impact of not being preemptive. Sometimes knowing is good enough. Nobody wants an analytics Rube Goldberg machine.
Knowledge Management
In the knowledge management context, analytics is all about managing the data assets. This involves extracting information from data such that it provides knowledge of what has happened or will happen in the future. When gathered over time, this information turns into knowledge about what is happening. After being seen enough times, this in-context knowledge provides wisdom about how things will behave in the future. Seeking wisdom from data is simply another way to describe insights.
Gartner Analytics
Moving further down the chart, popularized research from Gartner describes analytics in different categories as adjectives. This research first starts with descriptive analytics, which describes the state of the current environment, or the state of “what is.” Simple descriptive analytics often gets a bad name as not being “real analytics” because it simply provides data collection and a statement of the current state of the environment. This is an incorrect assessment, however: Descriptive analytics is a foundational component in moving forward in analytics. If you can look at what is, then you can often determine, given the right expertise, what is wrong with the current state of “what is” and how descriptive analytics contributes to your getting into that state. In other words, descriptive analytics often involves simple charts, graphs, visualizations, or data tables of the current state of the environment that, when placed into the hands of subject matter experts (SME), are used to diagnose problems in the environment.
Where analytics begins to get interesting to many folks is when it moves toward predictive analytics. Say that you know that some particular state of descriptive analytics is a diagnostic indicator pointing toward some problem that you are interested in learning more about. You might then develop analytics systems that automatically identify the particular problem and predict with some level of accuracy that it will happen. This is the simple definition of predictive analytics. It is the “what will happen” part of analytics, which is also the “outcome” of predictive analytics from the earlier part of the maturity continuum. Using the previous example, perhaps you can see that memory in the device is trending upward, and you know the memory capacity of the device, so you can easily predict when there will be a problem. When you know the state and have diagnosed the problem with that state, and when you know how to fix that problem, you can prescribe the remedy for that condition. Gartner aptly describes this final category as prescriptive analytics. Let’s compare this to the preemptive maturity: Preemptive means that you have the capability to automatically do something based on your analytics findings, whereas prescriptive means you actually know what do.
This continuum of descriptive analytics used for diagnostic analytics to support predictive analytics leads to prescriptive analytics. Prescriptive analytics is used to solve a problem because you know what to do about it. This flow is very intuitive and useful in understanding analytics from different perspectives.
Strategic Thinking
The final continuum on this diagram falls into the realm of strategic thinking, which is possibly the area of analytics most impacted by bias, as discussed in detail later in this book. The main states of hindsight, insight, and foresight map closely to the Gartner categories, and Gartner often uses these terms in the same diagrams. Hindsight is knowing what has already happened (sometimes using machine learning stats). Insight in this context is knowing what is happening now, based on current models and data trending up to this point in time. As in predictive analytics, foresight is knowing what will happen next. Making a decision or taking action based on foresight is simply another way to show that fully actionable items perceived to be coming in the future are actioned.
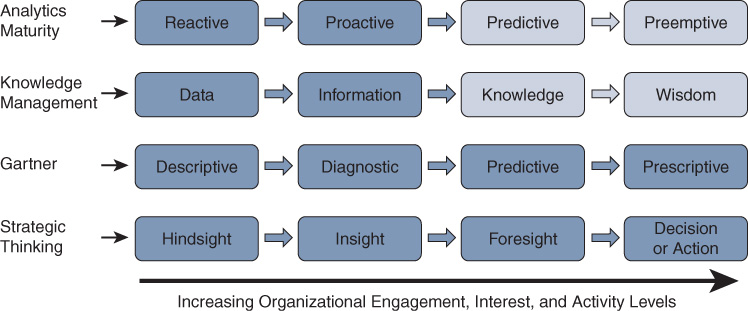
Striving for “Up and to the Right”
In today’s world, you can summarize any comparison topic into a 2×2 chart. Go out and find some 2×2 chart, and you immediately see that “up and to the right” is usually the best place to be. Look again at Figure 1-5 to uncover the “up and to the right” for analytics. Cisco seeks to work in this upper-right quadrant, as shown in Figure 1-6. Here is the big secret in one simple sentence: From experience, seek the predictive knowledge that provides the wisdom for you to take preemptive action. Automate that, and you have an awesome service assurance system.
Moving Your Perspective
Depending on background, you will encounter people who prefer one or more of these analytics description areas. Details on each of them are widely available. Once again, the best way forward is to use the area that is familiar to your organization. Today, many companies have basic descriptive and diagnostic analytics systems in place, and they are proactive such that they can address problems in their IT environment before they have much user impact. However, there are still many addressable problems happening while IT staff are spending time implementing these reactive or proactive measures. Building a system that adds predictive capabilities on top of prescriptive analytics with preemptive capabilities that result from automated decision making is the best of all worlds. IT staff can then turn their focus to building smarter, better, and faster people, processes, tools, and infrastructures that bubble up the next case of predictive, prescriptive, and preemptive analytics for their environments. It really is a snowball effect of success.
Stephen Covey, in his book The Seven Habits of Highly Successful People, calls this exercise of improving your skills and capabilities “sharpening the saw.” “Sharpening the saw” is simply a metaphor for spending time planning, educating, and preparing yourself for what is coming so that you are more efficient at it when you need to do it. Covey uses an example of cutting down a tree, which takes eight hours with a dull saw. If you take a break from cutting and spend an hour sharpening the saw, the tree cutting takes only a few hours, and you complete the entire task in less than half of the original estimate of eight hours. How is this relevant to you? You can stare at the same networking data for years, or you can take some time to learn some analytics and data science and then go back to that same data and be much more productive with it.
Hot Topics in the Literature
In a book about analytics, it is prudent to share the current trends in the press related to analytics. The following are some general trends related to analytics right now:
Neural networks—Neural networks, described in Chapter 8, “Analytics Algorithms and the Intuition Behind Them,” are very hot, with additions, new layers, and new activation functions. Neural networks are very heavily used in artificial intelligence, reinforcement learning, classification, prediction, anomaly detection, image recognition, and voice recognition.
Citizen data scientist—Compute power is cheap and platforms are widely available to run a data set through black-box algorithms to see what comes out the other end. Sometimes even a blind squirrel finds a nut.
Artificial intelligence and the singularity are hot topics. When will artificial intelligence be able to write itself? When will all jobs be lost to the machines? These are valid concerns as we transition to a knowledge worker society.
Automation and intent-based networking—These areas are growing rapidly. The impact of automation is evident in this book, as not much time is spent on the “how to” of building analytics big data clusters. Automated building of big data solutions is available today and will be widely available and easily accessible in the near future.
Computer language translation—Computer language translation is now more capable than most human translators.
Computer image comparison and analysis—This type of analysis, used in industries such as medical imaging, has surpassed human capability.
Voice recognition—Voice recognition technology is very mature, and many folks are talking to their phones, their vehicles, and assistants such as Siri and Alexa.
Open source software—Open source software is still very popular, although the pendulum may be swinging toward people recognizing that open source software can increase operational costs tremendously and may provide nothing useful (unless you automate it!).
An increasingly hot topic in all of Cisco is full automation and orchestration of software and network repairs, guided by intent. Orchestration means applying automation in a defined order. What is intent? Given some state of policy that you “intend” your network to be, you can let the analytics determine when you deviate and let your automation go out and bring things back in line with the policy. That is intent-based networking (IBN) in one statement. While IBN is not covered in this book, the principles you learn will allow you to better understand and successfully deploy intent-based networks with full-service assurance layers that rely heavily on analytics.
Service assurance is another hot term in industry. Assuming that you have deployed a service—either physical or virtual, whether a single process or an entire pipeline of physical and virtual things—service assurance as applied to a solution implies that you will keep that solution operating, abiding by documented service-level agreements (SLAs), by any means necessary, including heavy usage of analytics and automation. Service assurance systems are not covered in detail in this book because they require a fully automated layer to take action in order to be truly preemptive. Entire books are dedicated to building automated solutions. However, it is important to understand how to build the solutions that feed analytics findings into such a system; they are the systems that support the decisions made by the automated tools in the service assurance system.
Summary
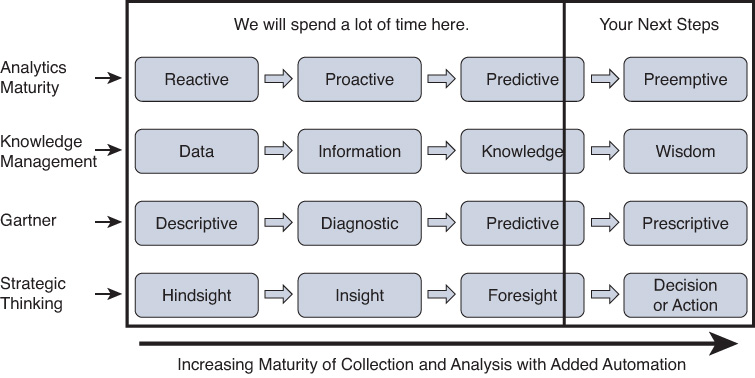
This chapter defines the scope of coverage of this book, and the focus of analytics and generating use cases. It also introduces models of analytics maturity so you can see where things fit. You may now be wondering where you will be able to go next after reading this book. Most of the time, only the experts in a given industry take insights and recommended actions and turn them into fully automated self-healing mechanisms. It is up to you to apply the techniques that you learn in this book to your own environment. After reading this book, you can choose to next learn how to set up systems to “do something about it” (preemptive) when you know what do to (wisdom and prescriptive) and have decided that you can automate it (decision or action), as shown in Figure 1-7.
The first step in teaching you to build your analytics skills is getting a usable analytics methodology as a foundation of knowledge for you to build upon as you progress through the chapters of this book. That occurs in the next chapter.