25
DATA CENTER ELECTRICAL DESIGN
Malik Megdiche1, Jay Park2, and Sarah Hanna2
1 Schneider Electric, Eybens, France
2 Facebook, Inc., Fremont, CA, USA
25.1 INTRODUCTION
In order to design an optimal data center, one must go through the process of determining its specific business needs. Planning and listing the priorities and the required functionality will help determine the best topology for the data center. Outlining the key ideas and concepts will help structure a focused and effective document.
To adequately define the basic functionality requirements, business needs, and desired operations of the data center, consider the following criteria:
- The facility's uptime
- The electrical equipment to be deployed
- The electrical design strategy
The basic requirements, business needs, and desired operations are collectively known as the backbone requirements. Based on these requirements, the designer of the power system will first need to answer the several questions before going in the classical steps of an electrical design as shown in Figure 25.1.
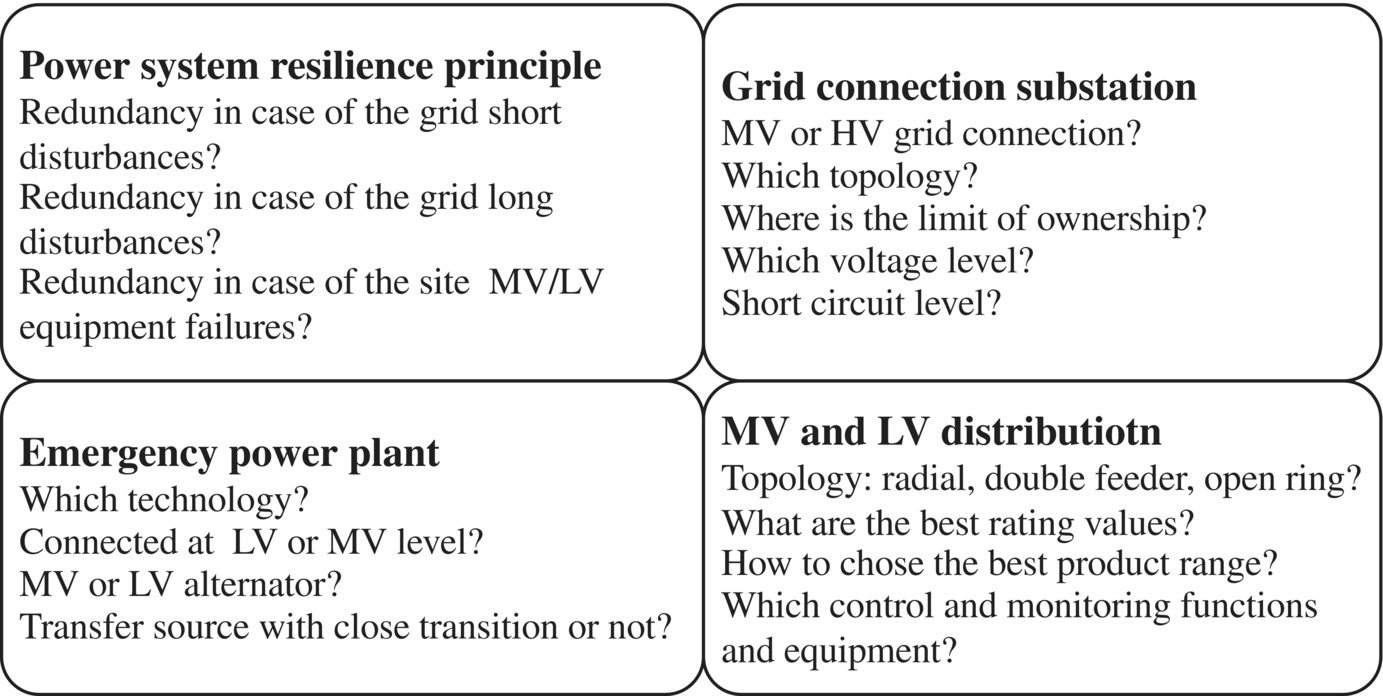
FIGURE 25.1 Questions related to the data center power system.
Source: © Schneider Electric.
25.2 DESIGN INPUTS
25.2.1 Uptime Level
First, determine the required uptime of the facility. Can the system allow some downtime?
If it can, you must address how much downtime can occur without affecting business operations. Due to the criticality of their businesses, financial institutions, colocation facilities, or institutions directly related to revenue generation require the highest levels of uptime. Less mission‐critical organizations have the flexibility to lower their uptime requirements significantly.
To determine the criticality of the information technology (IT) process, several questions need to be asked:
- Can the IT process tolerate some interruptions and how many interruptions per year?
- Is the IT process providing IT redundancy so that a part of the IT loads can be shut down without IT process loss of continuity?
Several types of power system failures can be defined as follows:
- Grid short disturbances such as severe voltage sags (10–30 times/year) and short interruptions (0.5–10 times/year)
- Grid long interruptions (0.1–1 time/year)
- Site electrical distribution equipment failures (0.01–0.001 failure/year for a switchboard) and planned maintenances (each approximately 3–5 years)
Depending on the criticality of the business, the data center facility needs backup equipment to face or not one or several of the power system interruption. Several levels of service continuity can then be defined:
- Level 1: No redundancy
- Level 2: Backup in case of grid short perturbations
- Level 3: Backup in case of grid short and long interruptions
- Level 4: Backup in any case (grid or on‐site distribution equipment failures) by achieving full redundancy on the whole data center facility
Reliability performances in between level 3 and 4 are also common when considering an architecture that is redundant in most of the cases but still one or several rare failures that could lead to the loss of servers (single failure points).
25.2.2 IT Load
A server rack is characterized in an electrical point of view by:
- The rated voltage and power,
- The diversity factor to take into account the real power usage of the racks,
- The power factor,
- Single phase or three phases,
- Single or dual inputs,
- Dual power supply (that takes 50/50% on each cord) or single power supply with embedded static transfer switch (STS) (that takes 100% one side and 0% on the other side),
- Its ability to withstand voltage drop (normally in accordance with the ITI curve),
- The maximum residual current leakage,
- The maximum inrush current,
- The maximum total harmonic distortion of current (THDi) at full load,
- The configuration of the IT room determined by the number of racks per row, the number of rows, and the number or row per IT room.
Classically design institute takes a power factor of 0.9, but nowadays new server power supply shows power factor above 0.95 (Fig. 25.2). The THDi are also now below 20% at full load.
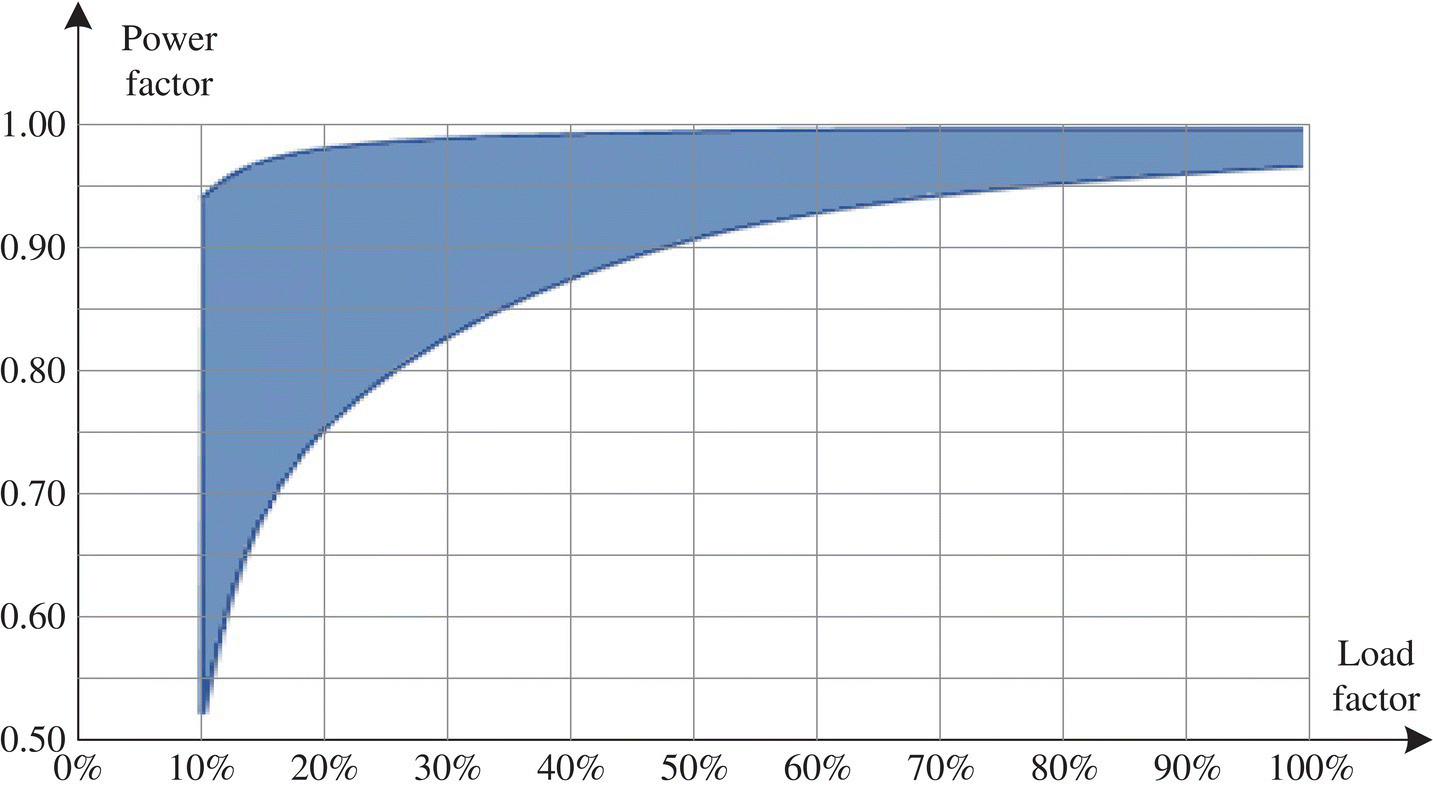
FIGURE 25.2 Measurements of actual power supply power factor.
Source: Data extracted from APC White Paper 200.
During operation, it is quite common that the data center power systems are underloaded (about 50% of the design capacity) due to the gap between the installed capacity and the actual load because there is an uncertainty on the actual load (server load factor and IT load planning). A way to improve the cost effectiveness of the power system is to provide a power system that is modular and scalable to match the IT growth plan and also to use some diversity factors (also named as “overbooking”) to take into account the real power usage of the servers while keeping a safety margin to ensure no risk of overloading the distribution equipment (Fig. 25.3).
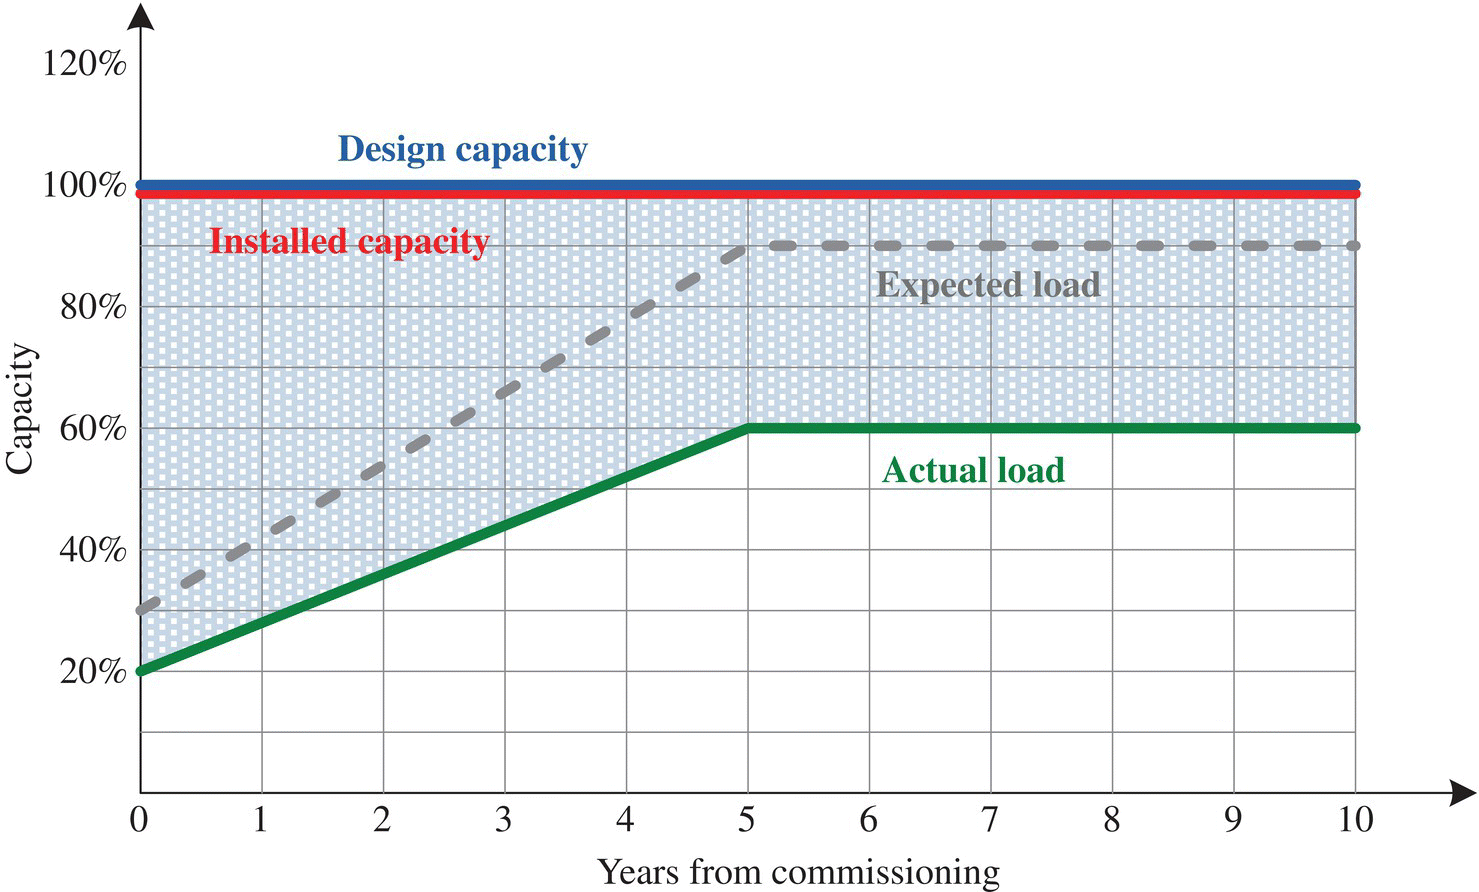
FIGURE 25.3 Design and installed capacity during the life of data center.
Source: Data Extracted from APC White Paper 37.
25.2.3 Cooling Loads
Depending on the cooling technology selected for the data center, for each mechanical load [chillers, pumps, CRAH (computer room air handling) units, fans, direct expansion (DX) units, etc.], consider the following:
- Rated power
- Rated voltage
- Maximum load consumptions according to extreme conditions
- Starting currents
- Sensitivity to power supply interruption (loads that are not supplied through UPS (uninterruptible power supply) need to be able to restart after the generator backup has reenergized the system without any disruption of the servers)
25.2.4 Other Loads
Building loads (lighting, security, access control, fire protection, control rooms, offices, storage rooms, etc.) and critical auxiliaries (for backup generators and medium voltage (MV) and low voltage (LV) switchboards) that not only represent a small part of the power but also are important for the data center operation.
25.2.5 Modularity and Scalability
Depending on its IT growth plan, the data center facility will need a level of modularity and scalability in order to grow up in accordance to the IT growth to optimize the capital expense investment.
25.2.6 Key Performance Indicators
The main key performance indicators of the data center owner such as reliability and availability target, capital expense, operating expense, and/or footprint are valuable information for the data center designers during the optimization of the overall infrastructure.
25.3 ARCHITECTURE RESILIENCE
25.3.1 Grid Supply Reliability Performance
The architecture of the HV/MV grid of a country, shown in Figure 25.4, consists of the following:
- Power generation sites about hundreds of MW interconnected by a meshed HV network called the transmission system.
- The sub‐transmission system is used to supply the HV/MV substation using also a meshed topology.
- From the HV/MV substation, MV distribution networks are supplying the MV customers and MV/LV distribution transformers using classically open loops topology to be able to reconfigure the power system in case of a fault on the MV feeders.
- From the MV/LV transformers, the LV networks supply the LV customers using a radial architecture.
At HV level:
- When a fault occurs on the HV lines or substations, the fault is cleared in less than 100–200 ms without losing any customers thanks to a meshed topology equipped with zone protection substations. However during the fault clearing, a voltage drop will affect several substations next to the fault.
- When the HV power system experiences very critical events, several emergency actions can be performed to avoid a complete blackout including shedding low priority MV feeders or HV customers.
- If a blackout occurs at HV level, the HV system follows a restart procedure to recover step by step the different parts of the system and will take few hours.
At MV level:
- When a fault occurs on an MV feeder, the fault is cleared in 150–500 ms by the feeder protection. The protection includes classically several reclosing operations.
- If the fault is momentary, the restoration time can be 500 ms to several seconds. If not, a fault location and restoration process will take few minutes to few hours to locate, isolate the faulty section, and restore the healthy sections.
The reliability performance of the grid supply depends on the country and the location in the country. To give a rough idea, Table 25.1 shows an idea of the utility reliability when connected at MV level or HV level.
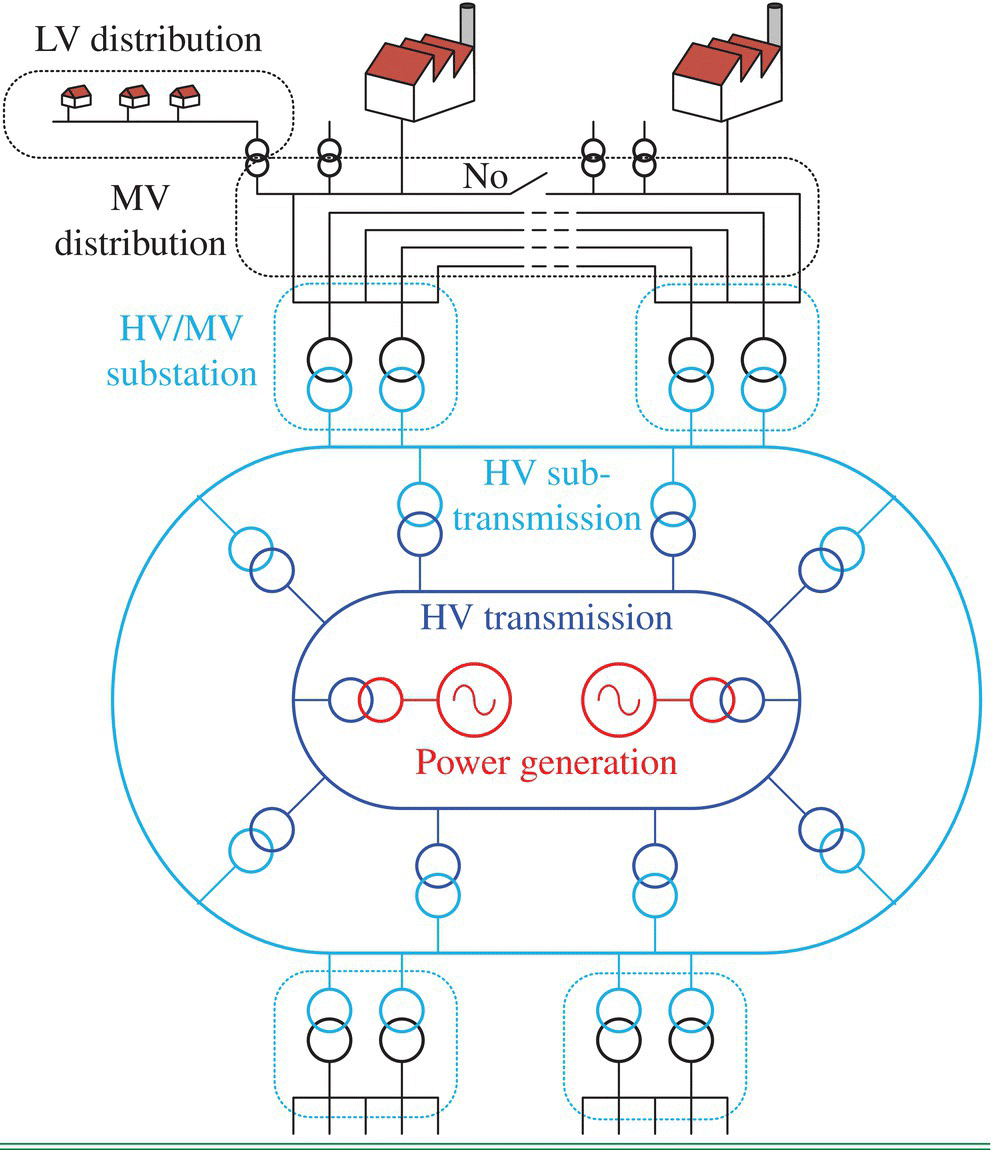
FIGURE 25.4 Topology of the utility grid in a country.
Source: © Schneider Electric.
TABLE 25.1 Electrical utility reliability indexes
| Reliability performance of electrical utility in Europe | Order of magnitude frequency (per year) | |
|---|---|---|
| MV grid connection | HV grid connection | |
| Regional blackout > 4 hours | 0.01–0.02 | 0.01–0.02 |
| Long interruptions > 3 min | 0.5–5 | 0.1 |
| Short interruptions < 3 min | 0.5–20 | 0.5 |
| Severe voltage drops | 10–100 | 5–15 |
Depending on the data center site maximum apparent power and according to the grid characteristics, the data center site will be supplied with an MV grid connection or with an HV grid connection with a dedicated HV/MV substation.
25.3.2 Backup of the Grid Supply in Case of Short Interruptions
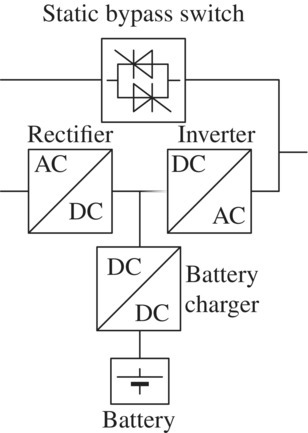
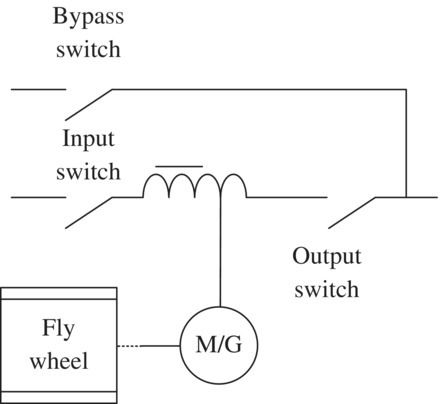
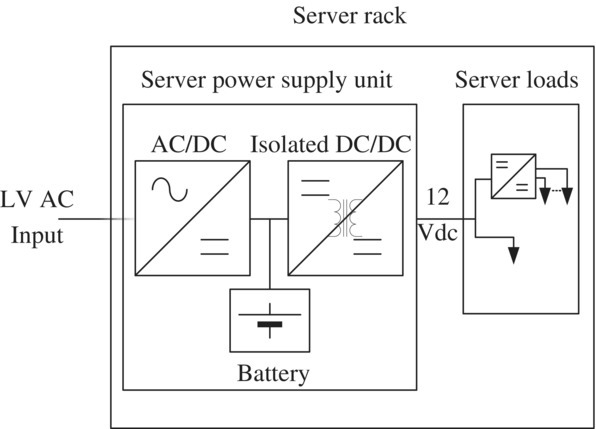
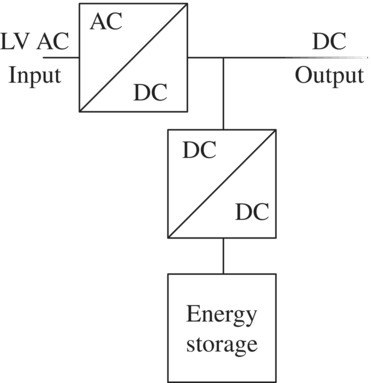
In case of utility short interruptions (below 3‐min interruptions), UPS technologies with small storage are needed. Several technologies can be used shown in Table 25.2. The most widely used in data center are the static UPS using lead–acid batteries or lithium batteries. As UPS and its energy storage are important parts of the LV equipment cost and losses, there is a big trend to find new ways to improve both CAPEX and OPEX (capital expenditures and operating expenditures) of the UPS products:
- New static UPS products using new power conversion topology
- UPS function embedded at the server power supply unit (PSU) level
- Investigations in the area of the direct current (DC) UPS where the output is in DC instead of alternative current
The UPS energy storage autonomy can be set according to:
- The generator starting and loading time
- The IT requirements like the IT process emergency shutdown that will need the time to properly shut down the IT to not lose any data before the power blackout.
TABLE 25.2 Different UPS technologies
| Static AC UPS | Rotary AC UPS |
 |
 |
| UPS at rack level | Static DC UPS |
 |
 |
25.3.3 Backup of the Grid Supply in Case of Long Interruptions
For a backup in case of long interruption, the most common solution is the use of standby generators with fuel storage associated with a PLC (programmable logic controller) that manages the start and stop sequences and an automatic transfer switch that allows the switch between utility and generator backup as shown in Figure 25.5.
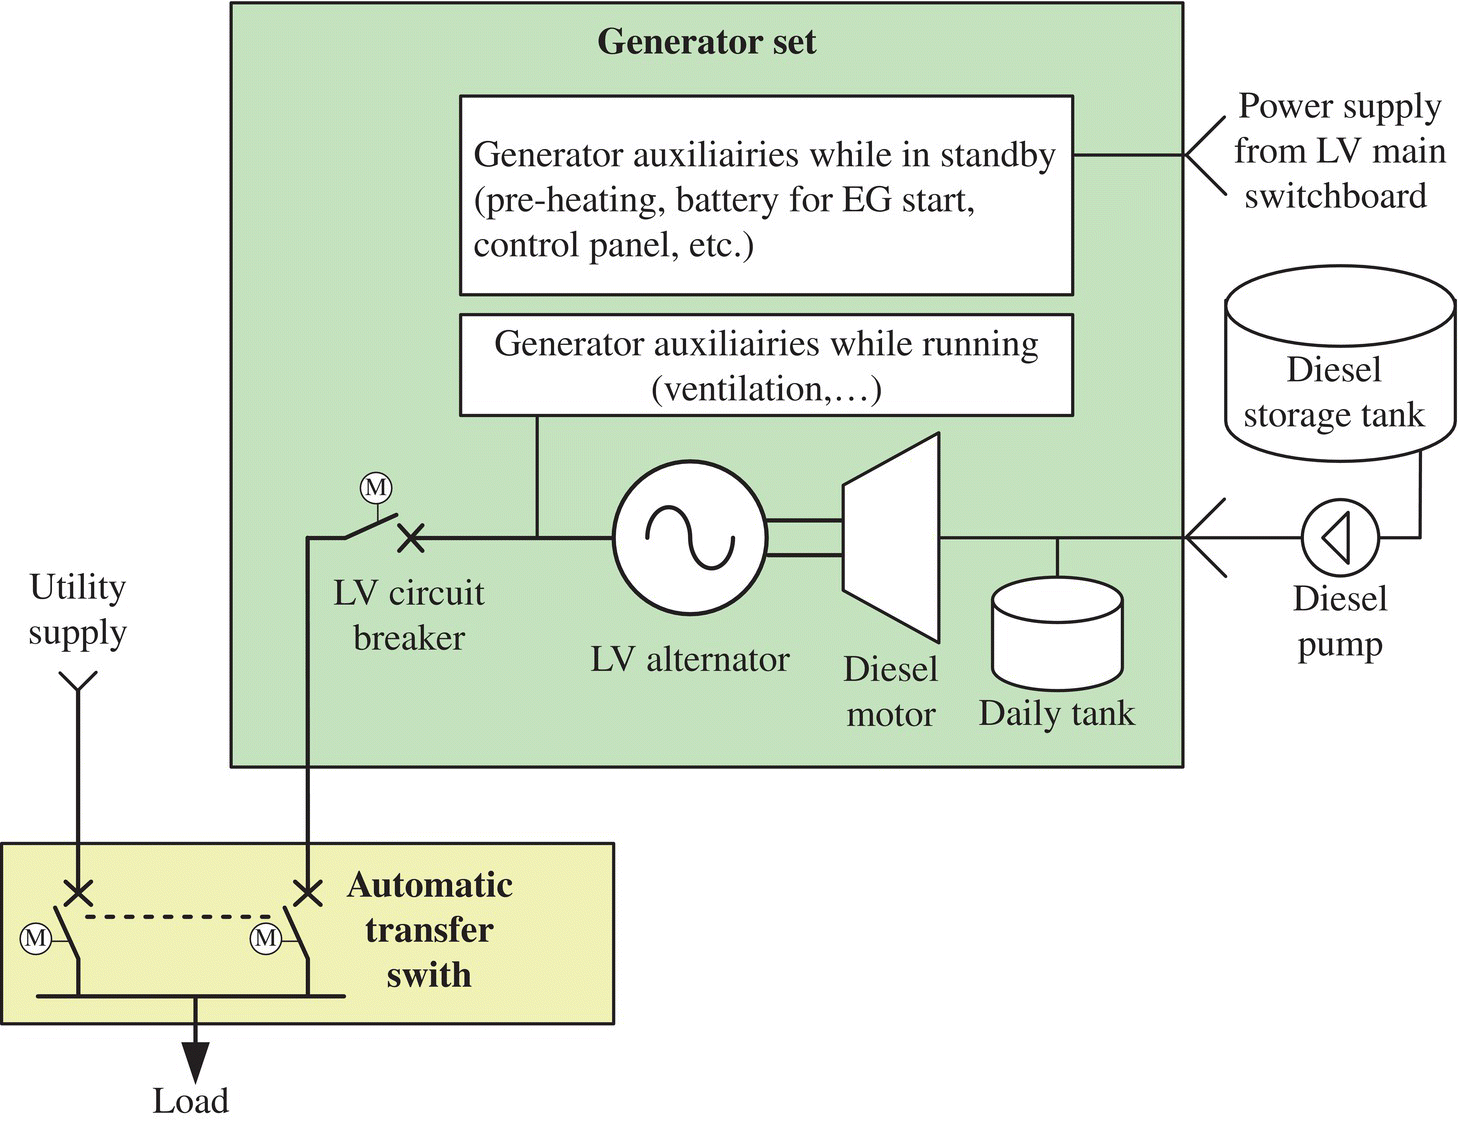
FIGURE 25.5 Diesel generator backup architecture.
Source: © Schneider Electric.
A redundant utility grid incomer and substation can be a solution but, in case of HV blackout, there will be always a risk to lose the two redundant grid substations at the same time. Moreover, depending on the grid characteristics, a redundant grid connection can be more expensive than a standby diesel power plant. Due to this single failure point, data centers use diesel backup generators. However, there are some cases where it could be interesting such as a data center an HV grid connection using redundant HV lines, a redundant HV/MV substation and an IT process that can tolerate a black out each 50 years.
Other technologies are also investigated such as gas generators and fuel cells.
25.3.4 Backup in Case of a Failure in the Data Center Electrical Distribution
There are three main hierarchies of electrical data center design: N, N + 1, and 2N. The N design system uses the exact number of equipment or systems without any built‐in redundancy. N + 1 designs have one additional system built in for redundancy, while 2N refers to designs that have double the equipment required, which provides maximum redundancy.
25.3.4.1 N Topology
This topology has no redundancy except a backup in case of the utility failure using a UPS unit with a standby generator as shown in Figure 25.6. Using this topology, several single failure points will lead to server shutdown including failures and planned maintenance on the LV distribution.
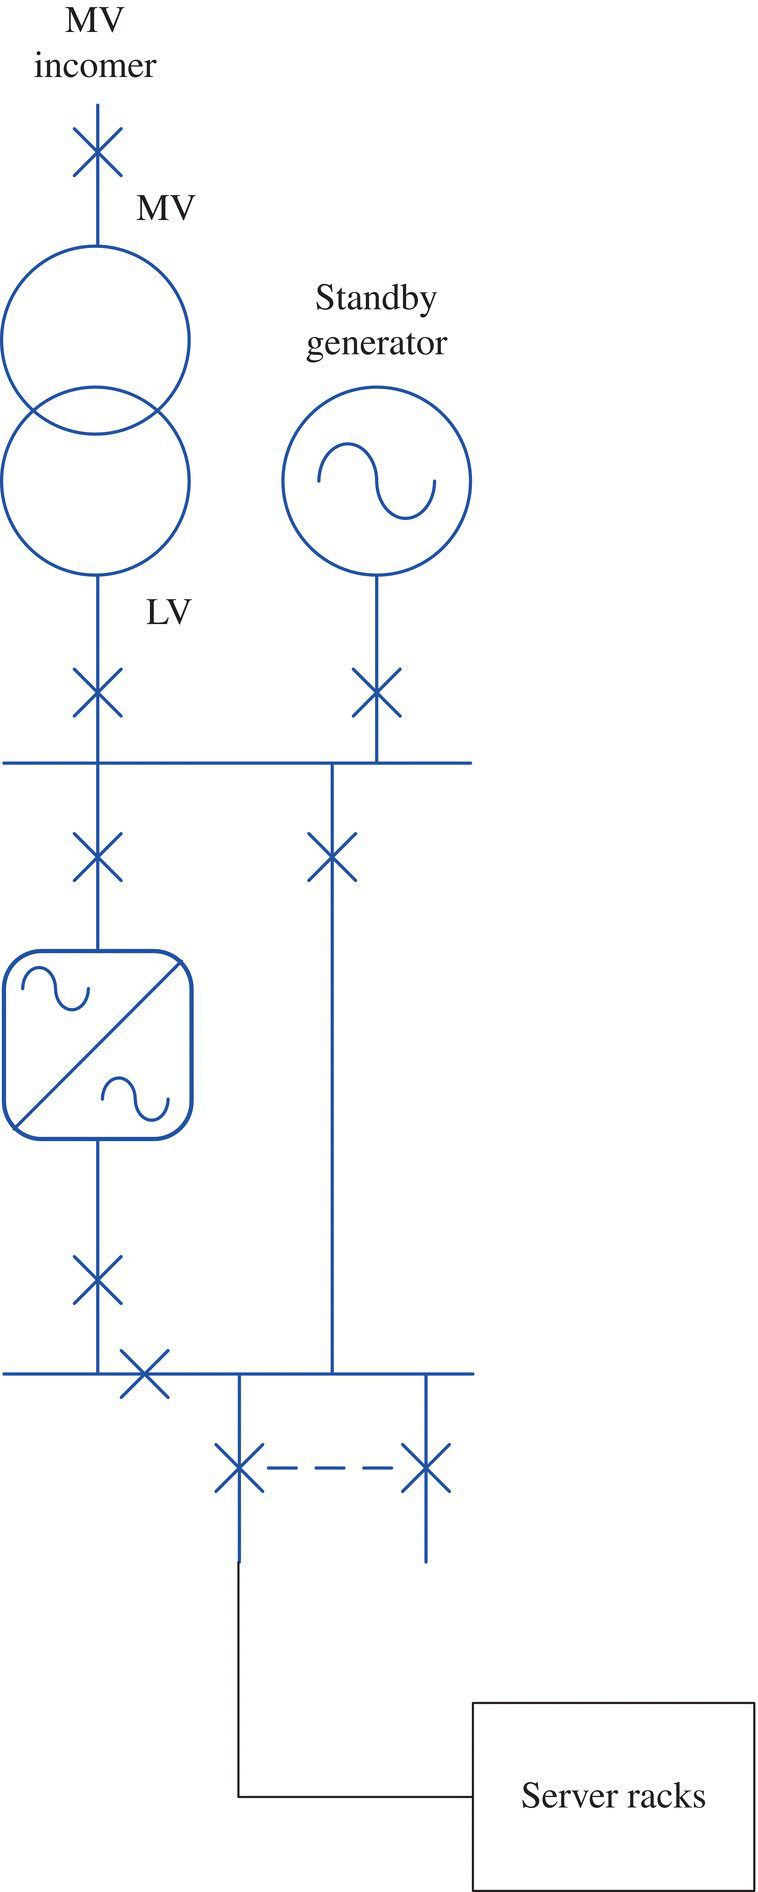
FIGURE 25.6 Topology with N redundancy.
Source: © Schneider Electric.
25.3.4.2 2N Redundant Topology
In this topology, power flows from the utility through the UPS/power distribution unit (PDU) of two separate systems and connects to the server. A 2N configuration, as shown in Figure 25.7, provides redundancy throughout the system, accommodating single‐ or dual‐corded racks.
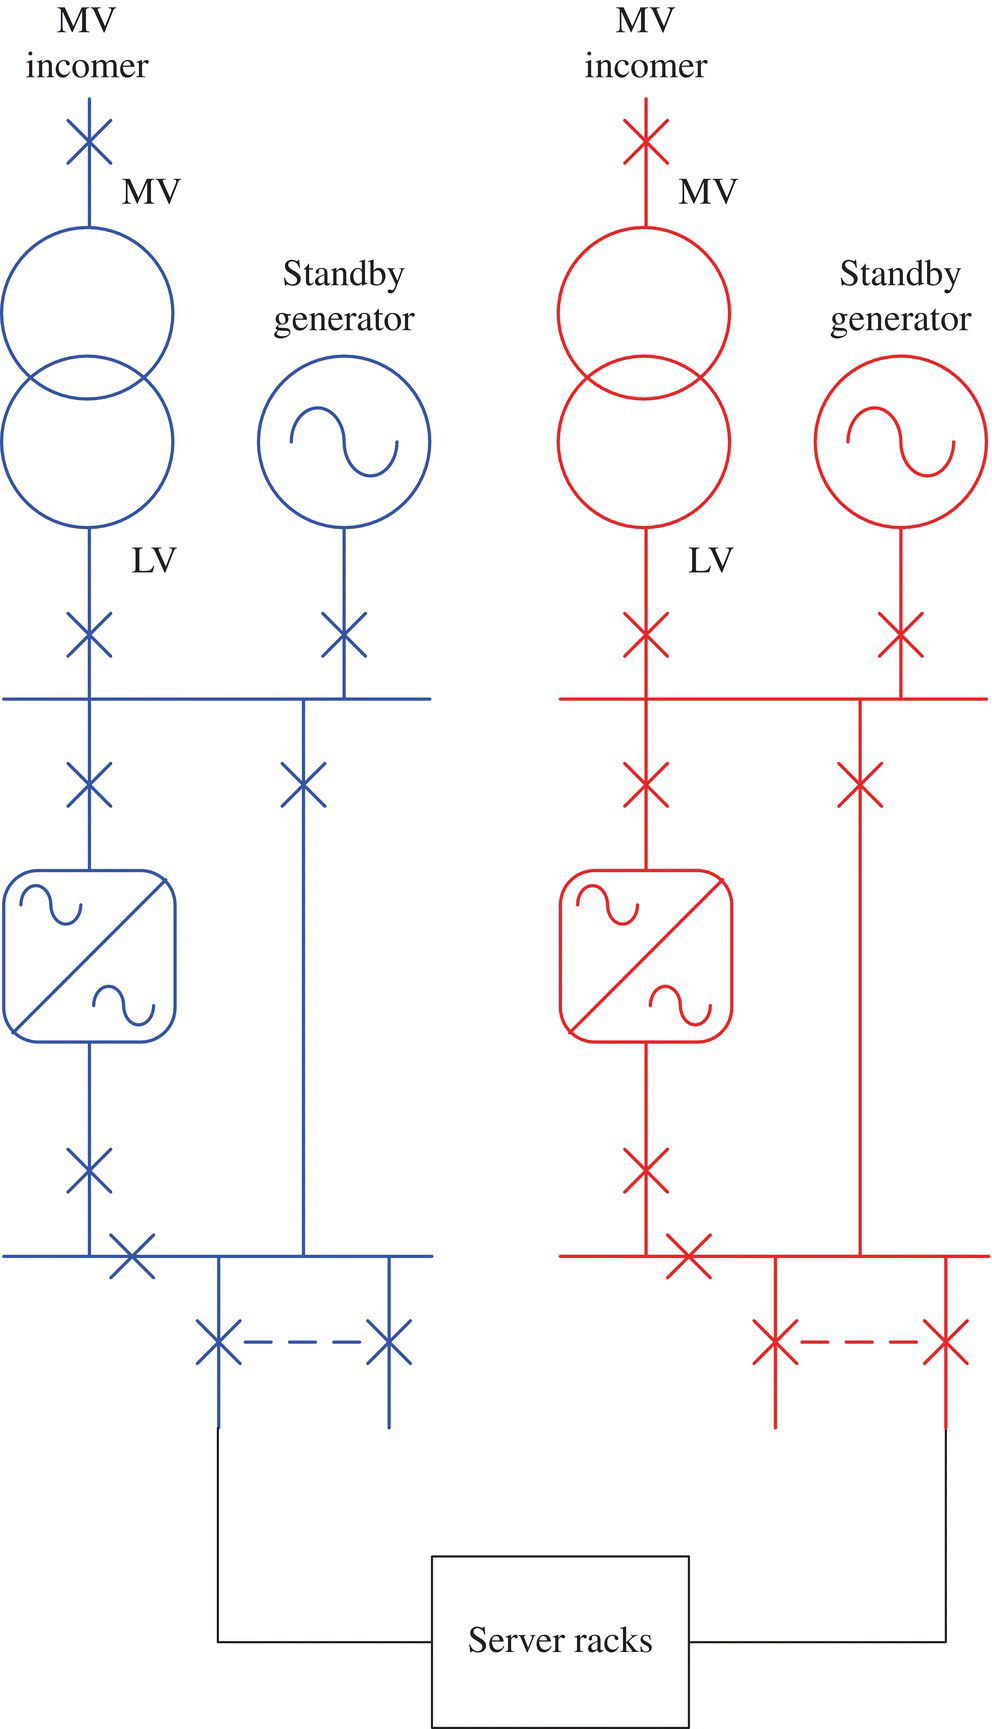
FIGURE 25.7 Topology with 2N redundancy.
Source: © Schneider Electric.
25.3.4.3 N + 1 Block Redundant Topology
In this topology, also known as a catcher system, power flows from the utility through the UPS/PDU and connects to the server. As shown in Figure 25.8, each set of PDUs has a UPS dedicated to it, with one reserve to provide power in case of an outage. A block redundant topology accommodates single‐ or dual‐corded rack configurations providing redundancy at both the UPS and PDU levels.
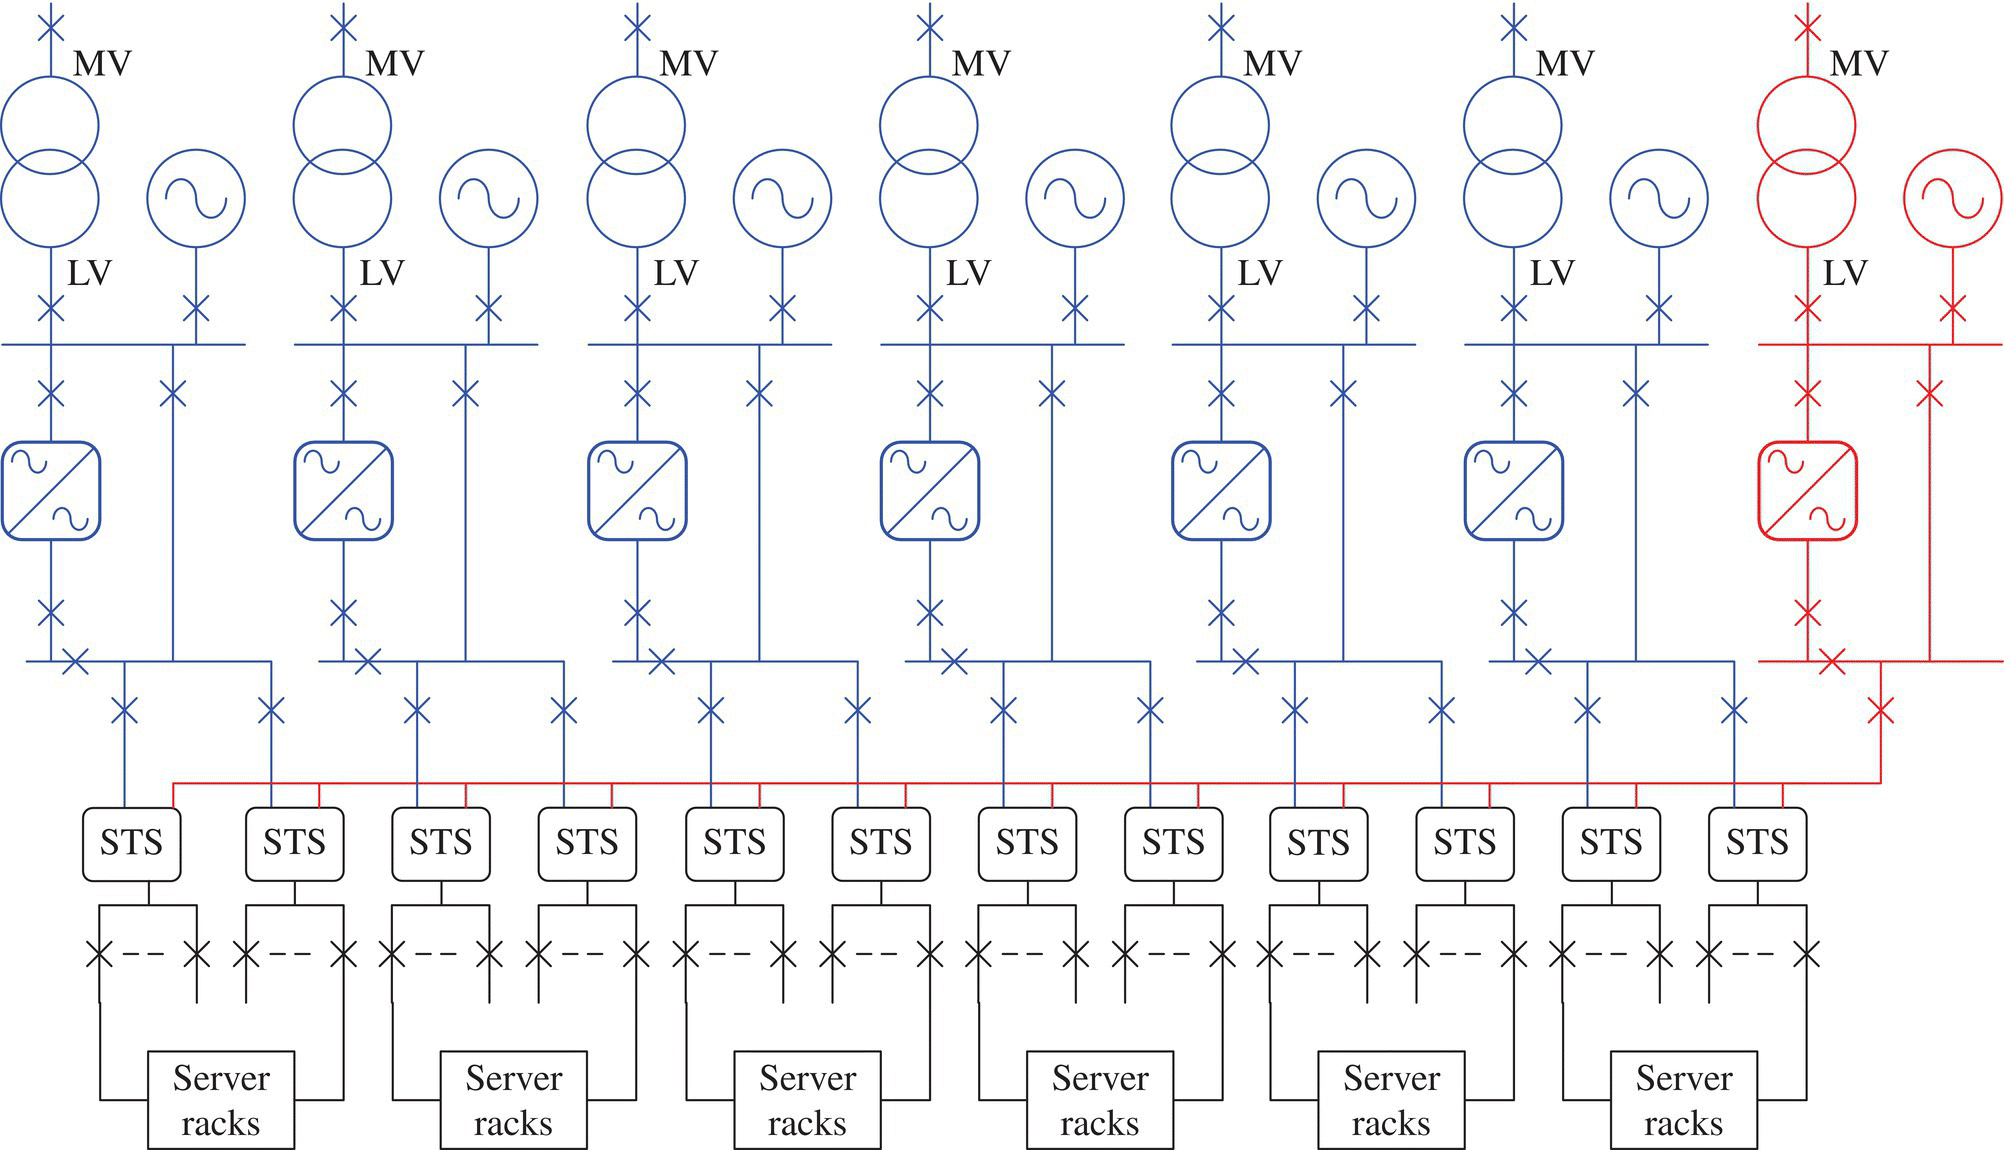
FIGURE 25.8 Topology with 6 + 1 block redundancy.
Source: © Schneider Electric.
In normal condition, each block is loaded at 100% maximum, and the reserve block is off load. If one block fails, the STS will switch the loads on reserve block in less than 10 ms.
25.3.4.4 N + 1 Distributed Redundant Topology
In this topology, power flows from the utility through the UPS/PDU and connects to the server. The data center load is distributed across the PDUs, leaving enough capacity for the UPS. As shown in Figure 25.9, if there are four systems in the data center, each system should be loaded to 75% maximum in normal conditions; if one system fails, the load is transferred to the remaining live systems.

FIGURE 25.9 Topology with 3 + 1 distributed redundancy.
Source: © Schneider Electric.
A distributed redundant topology accommodates single‐ or dual‐corded rack configurations, providing redundancy at the system level.
25.3.4.5 N + 1 Diesel Rotary UPS Unit Topology
This topology was designed with diesel rotary UPS (DRUPS or Diesel Rotary UPS) technology to achieve a cost‐effective design with N + 1 units. At MV level, N + 1 DRUPS are suppling several MV/LV blocks (Fig. 25.10). The load is shared between all the DRUPS units using the paralleling bus. If a DRUPS fails, the remaining units will supply the loads without any change. If a short circuit occurs downstream the DRUPS, the fault will be cleared by the zone protections. During the short circuit, the chokes on the common bus are designed to keep the voltage in an acceptable range according to the ITI curve.
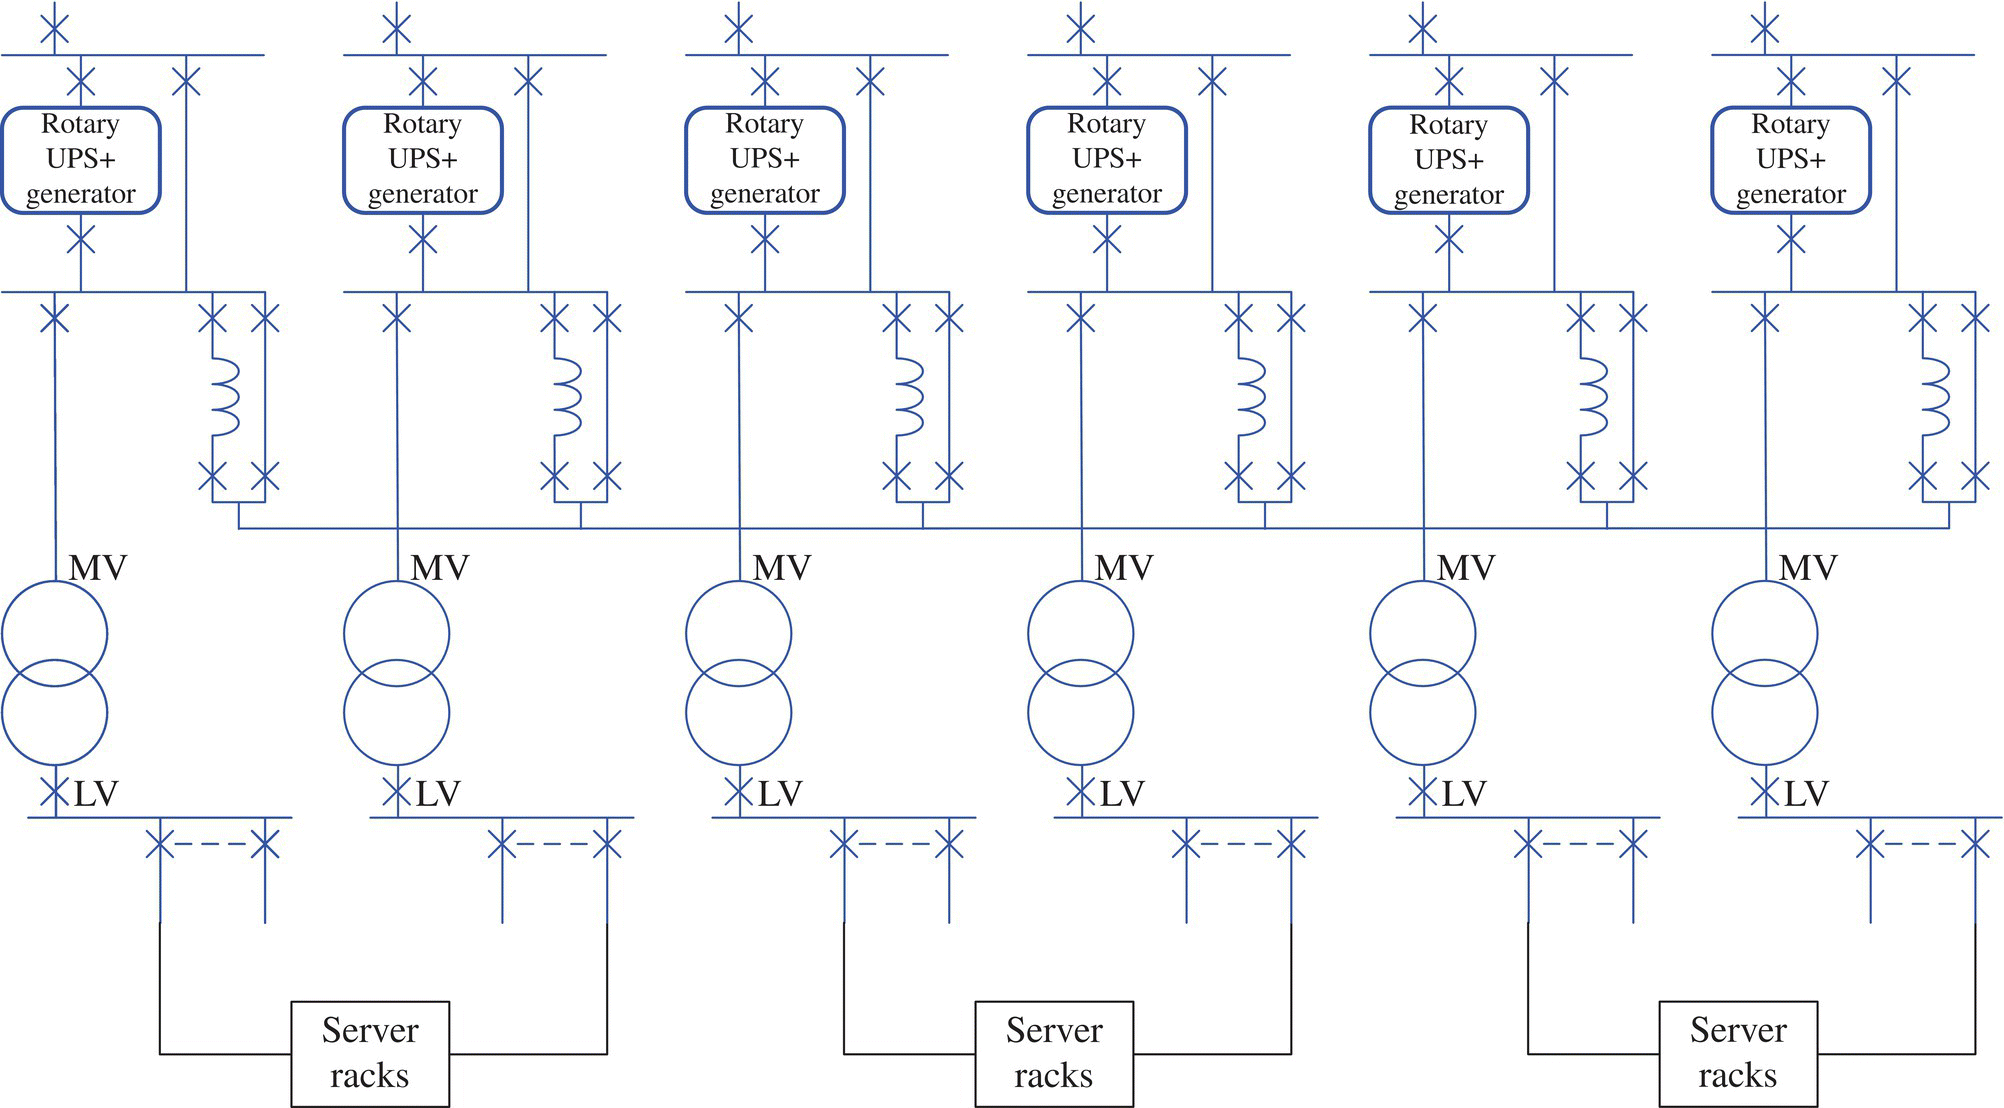
FIGURE 25.10 Topology with iso‐paralleling bus with 5 + 1 redundant DRUPS (diesel rotary UPS) at MV level.
Source: © Schneider Electric.
25.3.4.6 N + 1 Block Redundancy Using IT Redundancy
In this topology, there is no redundancy at the block level. The N + 1 redundancy is achieved at IT level. If a block fails, the loss of the servers supplied by the failed block is backed up by the other servers, and the IT processes do not experience any blackout. This kind of architecture needs a bit more investment on IT infrastructure but gives the advantage to not design any redundancy at LV level (Fig. 25.11).

FIGURE 25.11 Topology with 6 + 1 redundant blocks.
Source: © Schneider Electric.
25.3.5 “Classical” Misunderstanding of What Is a Full Redundant Power System for Data Center
The Tier classification that defines four levels of data center architecture reliability has been widely adopted by the data center business. Here is a definition of the four levels:
- Tier I “Basic capacity”: No redundancy required
- Tier II “Redundant capacity components”: Redundancy on nonreliable equipment
- Tier III “Concurrently maintainable”: Tier II requirements + each equipment can be removed and repaired without a data center blackout
- Tier IV “Fault tolerant”: Tier III + fault‐tolerant architecture (no single failure point)
However the classification does not consider any utility into the reliability performances of the data center infrastructure. This is not acceptable if the grid performs very poor with several power black‐out per week, but this is acceptable if the grid has an availability above 99%. Due to the tier classification assumption, it is common that people consider that an architecture similar to the one shown in Figure 25.12 is not fault tolerant. This “classical” misunderstanding, especially on end‐user side, leads to some useless oversizing of the generator power plant to reach the requirements of Tier III or Tier IV levels.
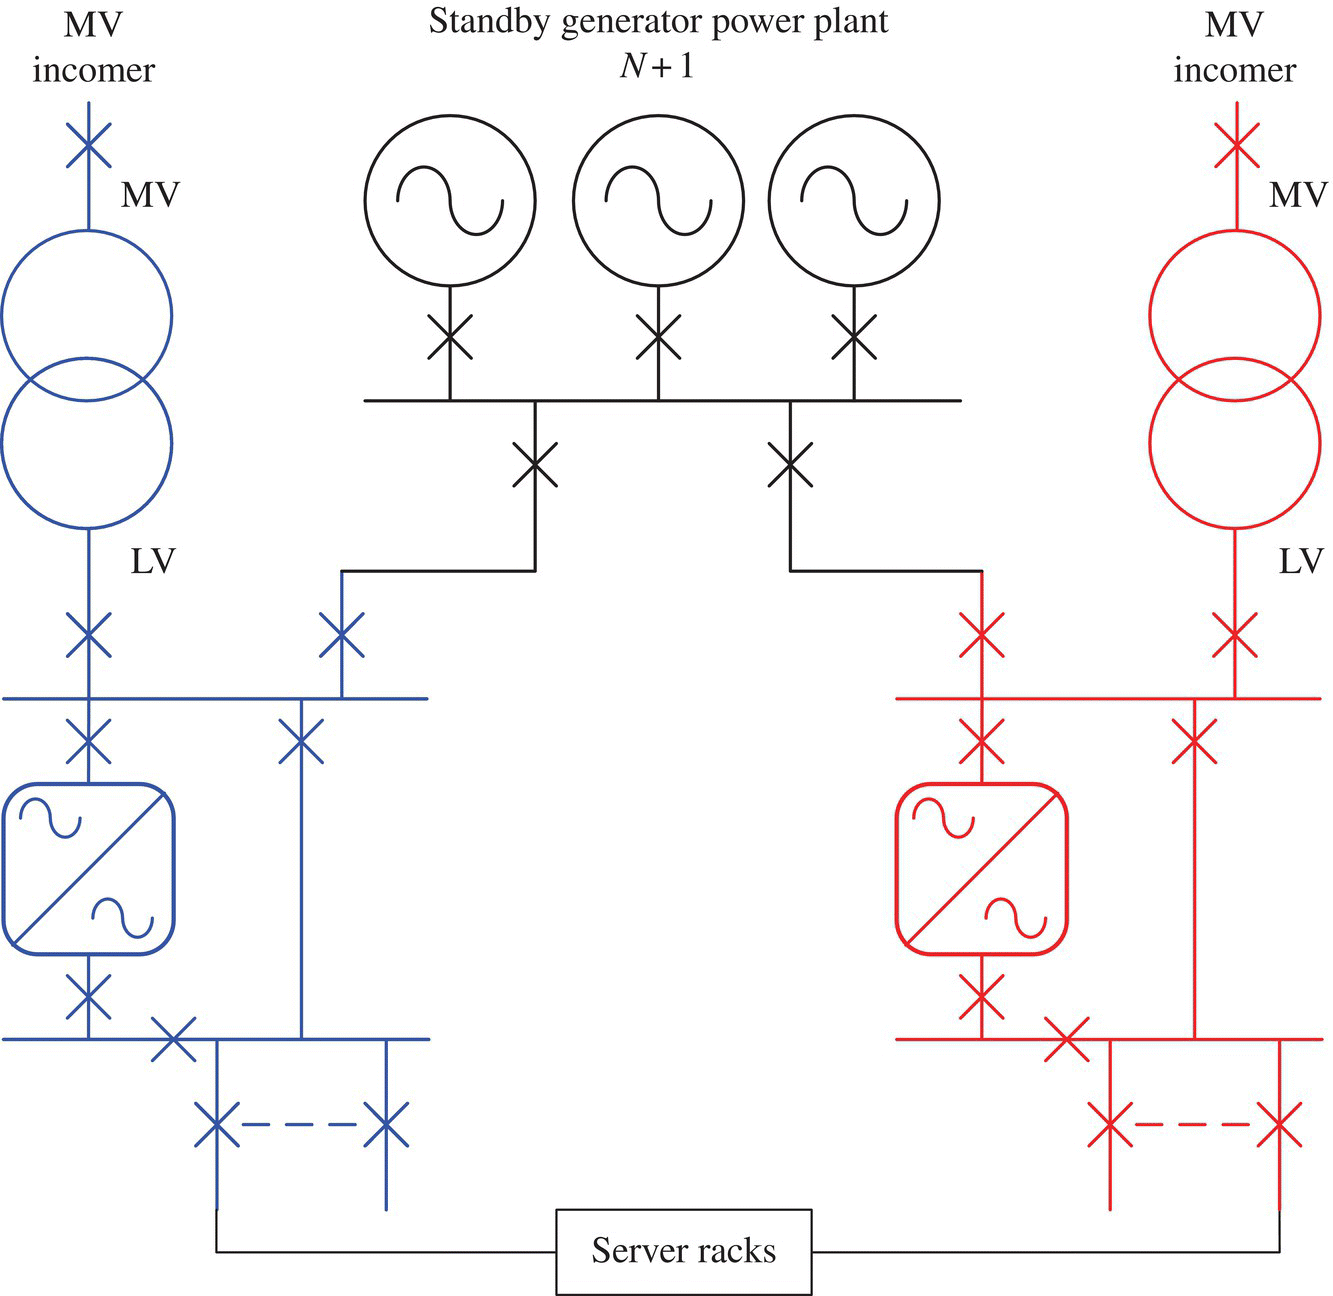
FIGURE 25.12 Example of a fault‐tolerant architecture.
Source: © Schneider Electric.
25.3.6 Shutdown of One Path of Double‐Corded Server for Planned Maintenance
The redundancy of IT equipment power supply is designed to provide fault tolerance and also to allow maintenance operation on one path, while the server racks are supplied by the other path.
However, it is quite common that end users ask for no planned shutdown of one path of double‐corded server. This is particularly hard to achieve for LV (low voltage) distribution between the main LV switchboard and the servers.
This requirement can lead to two main drawbacks:
- The data center owner will spend more money to respect these requirements by adding more circuit breakers (CB) to make bypasses during planned maintenance activities.
- Or the data center owner will take more risks by deleting some planned tests and maintenance activities like switchboard cleaning and protection tests.
25.3.6.1 Topology Comparison
The Table 25.3 outlines the most common data center topologies along with their pros and cons.
TABLE 25.3 Data center electrical topologies comparison
Source: © Schneider Electric.
| N redundant | 2N redundant | N + 1 block redundant |
N + 1 distributed redundant |
N + 1 isolated parallel bus |
N + 1 block redundant and IT redundancy |
|
|---|---|---|---|---|---|---|
| Redundancy level | No Redundancy on the LV distribution | Maximum redundancy, two identical systems | One system capacity worth of redundancy | One system capacity worth of redundancy | One system capacity worth of redundancy | One system capacity worth of redundancy |
| Pros |
|
|
|
|
|
|
| Cons |
|
|
|
|
|
|
25.4 ELECTRICAL DESIGN CHALLENGES
25.4.1 Load Balance Calculation
Before going deeper in the MV and LV design, the first step of the electrical design is to calculate the maximum current and power for each piece of equipment starting from the loads up to the grid connection.
To perform this calculation, the maximum permanent loads need to be known to make the power system load flow and set the correct current ratings. A particular attention needs to be paid to the following:
- The maximum IT load is often overestimated, and diversity should be used in many cases to not oversize the whole data center infrastructure.
- The maximum cooling load consumptions can be also overestimated particularly when cooling design is not ended. Classically, the maximum cooling consumption needs to be calculated by the mechanical engineer according to the environmental characteristics and according to the customer additional safety margin requirements.
- The different operating modes of the electrical installation (site supplied by utility or generator, UPS online mode or on line plus battery charging or bypass mode or in manual bypass mode).
For an accurate load flow, the LV cable losses, the UPS losses, the power factor of the load, the UPS input power factor, the MV/LV transformers losses, and reactive consumption need to be considered.
When specifying the equipment, the capacity of each device in terms of active power (kW), reactive power (KVAR), and maximum current (Amps) needs to be checked.
25.4.2 Grid Connection Substation
25.4.2.1 Connection to the MV Grid
If the maximum apparent power of the data center is below 10–20 MVA, depending on the local grid characteristics, the site will be connected at an MV level. Various architectures of MV grid connection are possible and are also depending on the local grid standards. Some examples of different alternatives are given in Figures 25.13–25.16.
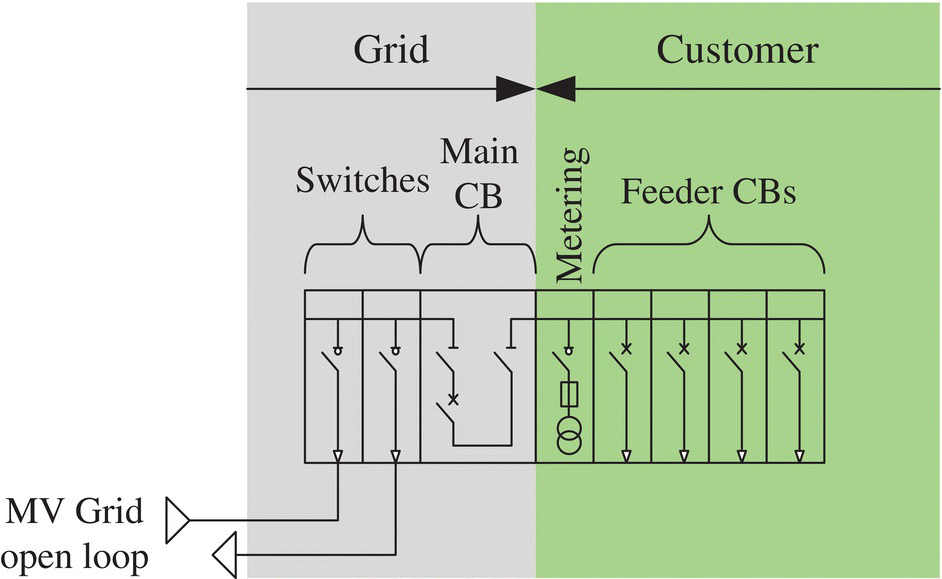
FIGURE 25.13 Example of a single MV grid substation with a single MV incomer (French standard).
Source: © Schneider Electric.
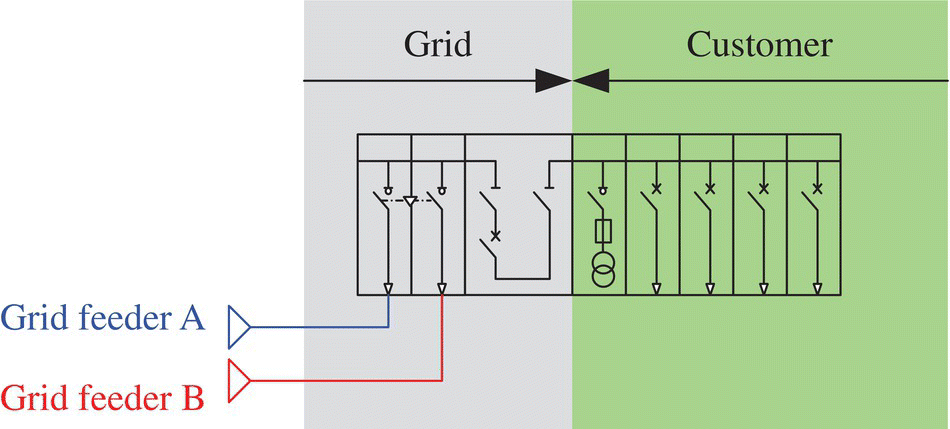
FIGURE 25.14 Example of a single MV grid substation with two redundant MV incomers (French standard).
Source: © Schneider Electric.

FIGURE 25.15 Example of two redundant MV grid substations with a single MV incomer (French standard).
Source: © Schneider Electric.

FIGURE 25.16 Example of two redundant MV grid substations with two redundant MV incomers (French standard).
Source: © Schneider Electric.
When connected to an MV grid, the MV protection selectivity is not easy using only time‐graded selectivity. As shown in Figure 25.17, the grid MV feeder protection is classically set with 500 ms delay. The setting of the main protection at the grid connection substation is required to be set at 200 ms. This means that the protection selectivity between the different MV protections on the site can only be achieved using overcurrent protection with logic selectivity or other protections like differential protections.

FIGURE 25.17 Protection selectivity for MV grid connection.
Source: © Schneider Electric.
Another challenge is the use of the close transition between the MV grid and the MV generator power plant. Depending on the grid requirements and the size of the generator power plant, the paralleling operation between the power plant and the grid may not be allowed because of the following:
- The grid equipment could not withstand the additional short‐circuit current contribution from the generator power plant.
- The generator power plant could perturbate the grid protection system.
25.4.2.2 Connection to the HV Grid
If the site apparent power is above 10 or 20 MVA depending on the local grid characteristics, the site will be connected at HV level with an on‐site HV/MV substation.
When considering the planned maintenance on the HV/MV transformers, the HV/MV transformers are classically redundant. For the HV substation, several architectures can be designed according to the redundancy and the HV utility standards (Figs. 25.18–25.20).
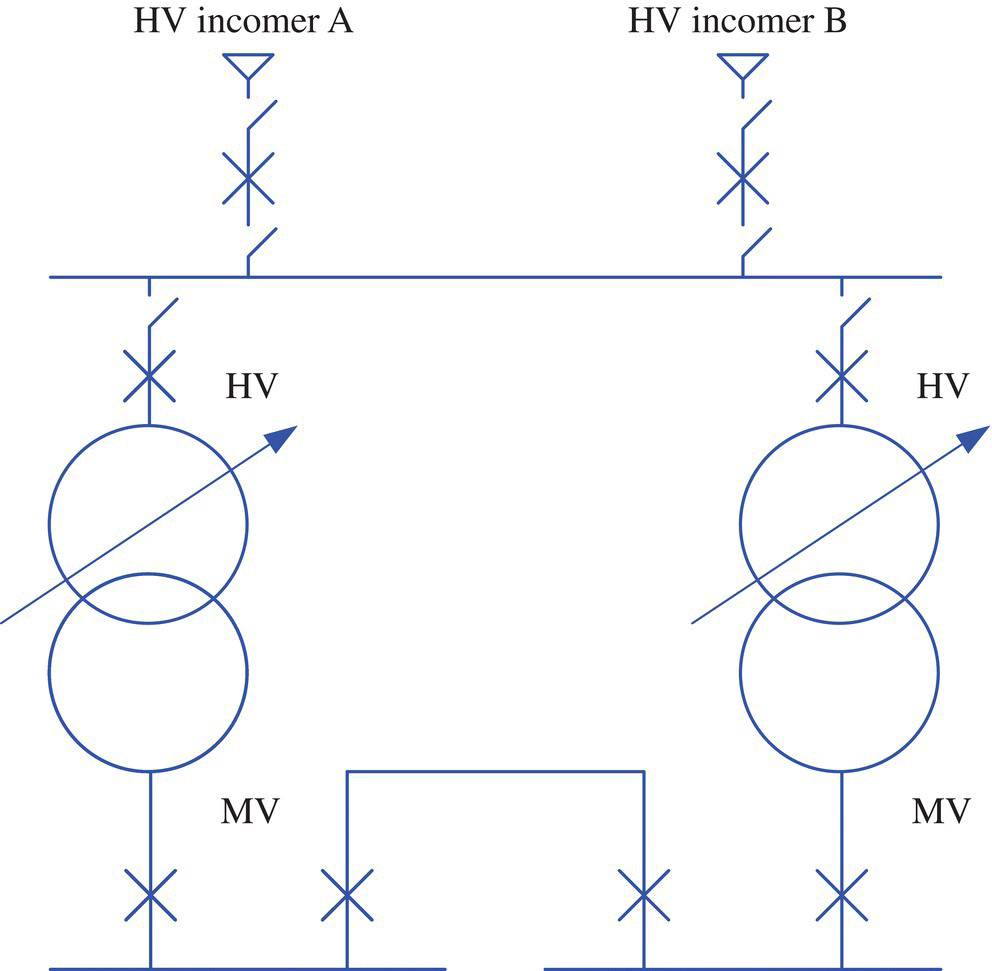
FIGURE 25.18 Example of an HV substation “single bus bar” with redundant incomers and transformers.
Source: © Schneider Electric.
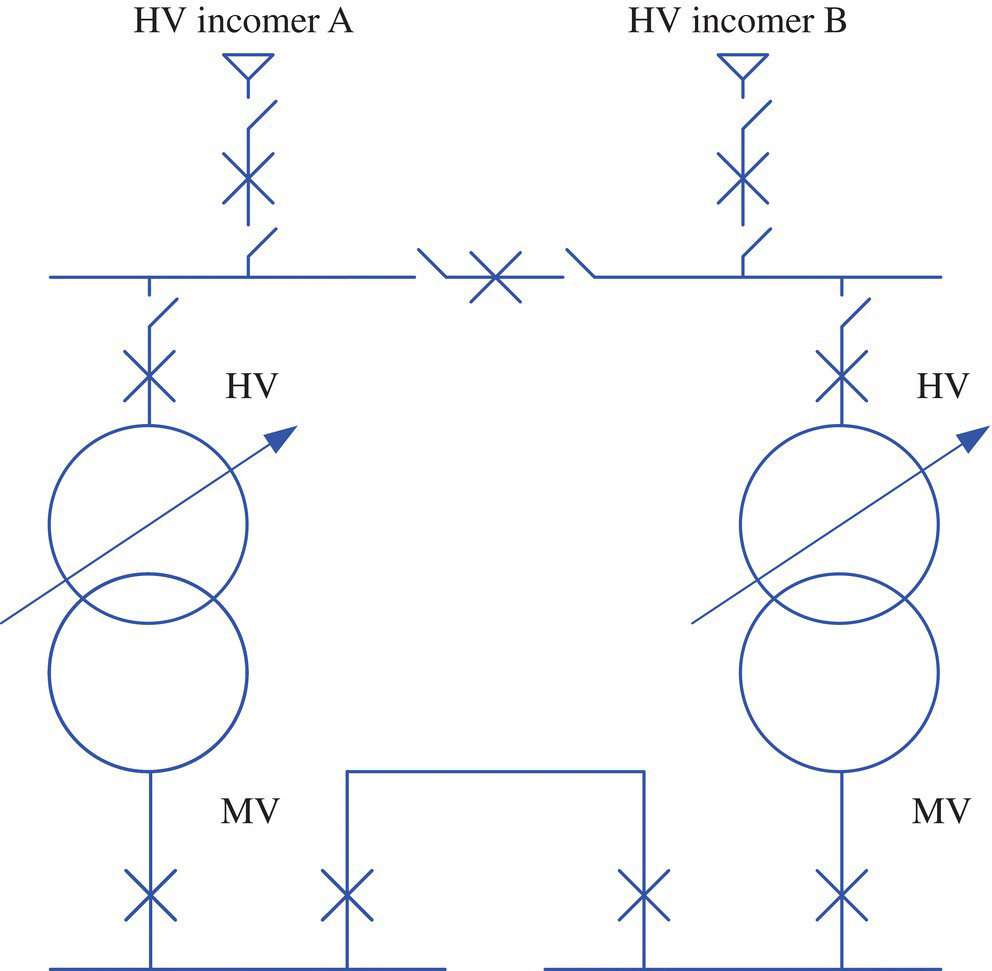
FIGURE 25.19 Example of an HV substation “single bus bar with a tie” with redundant incomers and transformers.
Source: © Schneider Electric.

FIGURE 25.20 Example of an HV substation “double bus bar” with redundant incomers and transformers.
Source: © Schneider Electric.
In terms of operating, various ways to operate the HV/MV substation are possible depending on the utility requirements and the operational cost:
- The incoming lines can be loaded at the same time or used as the main line and the other in standby.
- The incoming lines can be coupled if allowed by the utility to provide a better reliability performance.
- The HV/MV transformers can be used both active or one transformer as the main and the other one as backup and de‐energized to avoid the off‐load losses.
- The HV/MV transformers are never operating in parallel to minimize the short‐circuit current at MV level.
For rated voltage above 50 kV, two kinds of HV substation technology are used depending on the site characteristics:
- Outdoor air‐insulated switchgear (AIS) where the bus bars and the disconnectors are completely air insulated and the CB are using breaking technics in SF6 gas
- Indoor gas‐insulated metal‐enclosed switchgear (GIS) where all the components are isolated in SF6 gas in a metallic enclosure that brings more flexibility to choose the HV substation location, more safety during operation and maintenance, and no sensitivity toward the environment
AIS gives the advantages to use cost‐effective equipment cost but has a larger footprint and needs more civil works. GIS is far more compact and generates less constraints to install. Classically, AIS are more used in areas where the land is cheap, whereas GIS is more adapted to urban area.
Having an HV/MV substation on‐site gives the opportunity to set the most optimized MV distribution equipment matching the data center needs, which is not the case when the data center is connected to the MV grid as the voltage and the short‐circuit level are set by the utility HV/MV substation. When the customer owns the HV/MV substation, the MV voltage level and the short‐circuit level can be set thanks to the HV/MV transformer characteristics as shown in Figure 25.21.

FIGURE 25.21 Different options for sizing the HV/MV transformers.
Source: © Schneider Electric.
The main key parameters of the HV/MV transformer to specify are the primary voltage, the secondary voltage, the rated power, and the short circuit impedance ZT (%). According to IEC MV voltages, the transformer secondary voltage level can be set to match the best cost‐effective MV products. To select the MV equipment rated voltage, a common practice to mitigate the overvoltages is to select the rated voltage of the MV equipment by applying a margin of 10% on the normal operating voltage as shown in Table 25.4.
TABLE 25.4 Standard voltages according to IEC 62271‐1
Source: © Schneider Electric.
| Rated voltage | Rated power‐frequency voltage (50 Hz—1 min) | Rated lightning impulse withstand voltage (1.2/5 μs 50 Hz) | Normal operating voltage |
|---|---|---|---|
| kV rms | kV rms | kV peak | kV rms |
| 7.2 | 20 | 60 | 3.3–6.6 |
| 12 | 28 | 75 | 10–11 |
| 17.5 | 38 | 95 | 13.8–15 |
| 24 | 50 | 125 | 20–22 |
| 36 | 70 | 170 | 25.8–33 |
The transformer short‐circuit current at MV level can be decreased by increasing the transformer impedance, decreasing the power ratings (diving the transformer in two smaller ones or using double secondary winding transformer), or increasing the output voltage rating. Depending on the project characteristics, it can be interesting to spend a small over cost on the HV/MV transformers and make savings using cost‐effective MV switchboards and smaller cross sections for MV cables.
HV/MV transformers are classically oil type and installed outdoor. The sizing of the transformer apparent power can be done according to its natural cooling capacity (oil natural air natural) or forced cooling capacity (oil natural air forced). Sizing with the forced cooling capacity gives the best cost‐effective solution, whereas it can decrease the reliability of the transformer if the real load of the data center reaches a value that requires the transformer forced cooling capacity. As the HV/MV transformers are generally redundant and as there are the generator backup downstream, sizing the transformer using forced cooling capacity can be acceptable. HV/MV transformers are also generally equipped with on‐load tap changer (OLTC) to compensate actively the voltage variation on the HV grid and also the voltage drop across the HV/MV transformers due to load variations.
Another key point is that the data center owner needs to start the HV interconnection process in the early phase of the project because the time line required for an HV grid connection substation studies, design, and construction can last for several years:
- The interconnection agreement process requires 1–2 years of studies to make the assessment of the impacts on the transmission system, evaluate the cost of the upgrades on the transmission system, and get the approval from the transmission provider.
- The construction time line can take 2–3 years including the engineering, the equipment procurement, the civil works, the installation, and the commissioning tests.
25.4.3 Backup Generators
The key points in designing the emergency power plant are to ensure the correct level of reliability and to design the best cost‐optimized solution because generators represent a significant part of the power system cost of a data center.
25.4.3.1 Generator Connection
The emergency backup generators can be connected at LV on the main LV switchboard as an alternative source as shown in Figure 25.22.

FIGURE 25.22 Generator connected at LV level.
Source: © Schneider Electric.
The other alternative is to design a power plant connected at MV level to backup several MV/LV transformers as shown in Figure 25.23.
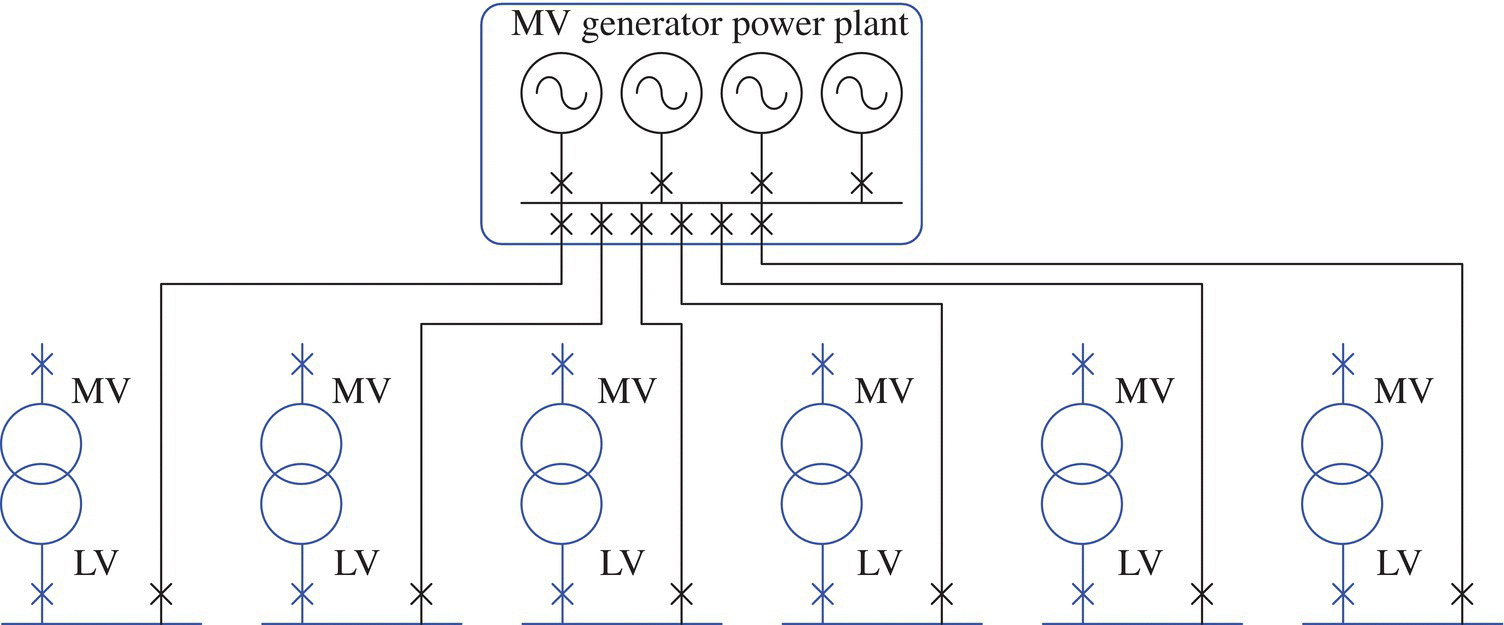
FIGURE 25.23 Generator connected at MV level.
Source: © Schneider Electric.
A table giving a comparison between both solutions is shown in Table 25.5.
TABLE 25.5 Comparison between generator connected at LV level or at MV level
| Generator connected at LV level | Generator connected at MV level |
|---|---|
| The generator redundancy level is set according to the redundancy level of the MV/LV power trains | The generator redundancy level is set according to the redundancy level of the MV/LV power trains |
| The solution is less scalable | The number of generators can be set according to the real load providing a good scalability |
| The size of the generator is designed according to the load of the main LV switchboard | The size of the generator is designed according to the best cost‐effective size (depends on the project characteristics) |
| Not always suitable for close transition option due to issues with high short‐circuit current | Suitable for close transition option if the site is supplied by the HV grid (not always suitable if the site is connected to the MV grid) |
| Generator size: from few kW to 3.2 MW | Generator size: from 2 to 10 MW |
| Voltage from 380 to 690 V | Voltage from 4.16 to 15 kV with MV alternator No voltage limit if using a step‐up transformer |
25.4.3.2 Generator Reliability
For critical applications, regarding the reliability of both utility and generator, the backup generators should be redundant. As shown in Figure 25.24, one MV utility and one generator give a reliability performance of one data center blackout each 30 years, while having redundant generators gives a blackout each 1,000 years.
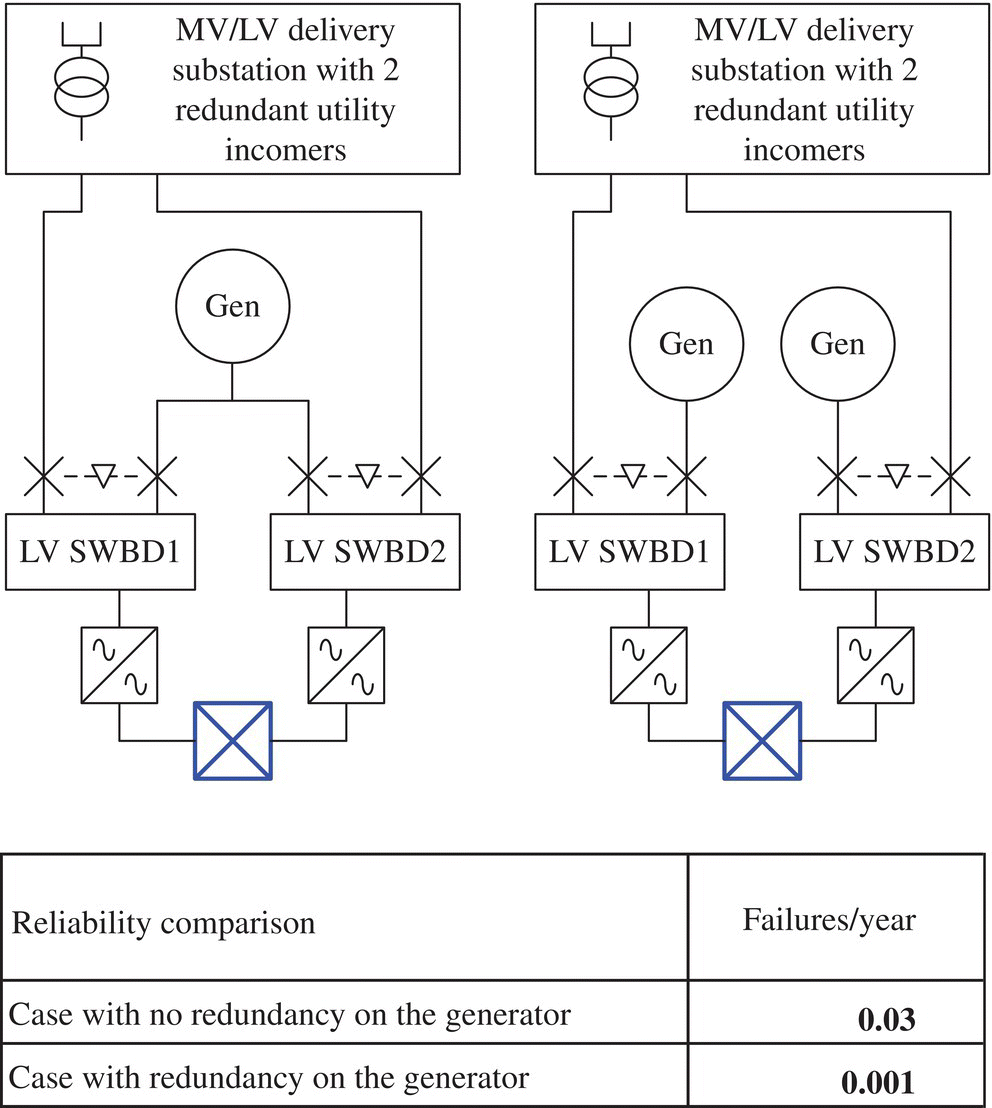
FIGURE 25.24 Reliability improvement considering generator redundancy.
Source: © Schneider Electric.
To lower the cost, the challenge is to use N + 1 (or N + 2 if required) redundancy instead of 2N redundancy.
Considering a generator power plant using multiple units in parallel with N + 1 redundancy, several levels of redundancy can be applied on the other equipment of the power plant depending on the reliability target of the end user:
- Redundancy on the auxiliary power supply and the diesel pump distribution
- Redundancy on the power plant main PLC that manage the starting and shutdown sequences and the number of units in operation
- Redundancy on the power plant electrical distribution (required if the customer wants to comply with Tier III or Tier IV classification or if a very high reliability is targeted)
To maintain a good level of availability, the generators need to be monitored and tested on a regular basis:
- The monitoring includes classically the battery state of charge.
- Off‐load test that will detect any failure on the starting system and a part of the generator block itself.
- On‐load test that will detect any failures of the generator.
The on‐load test can be done in several ways:
- Test on a load bank at full load
- Test on the real load using close transition transfer
- Real backup test by doing a real shutdown of the utility incomer
25.4.3.3 Close Transition Versus Open Transition
When using an automatic transfer switch to switch from a source to another source, there are several ways to make the transfer when both sources are available as shown in Figure 25.25. Close or soft transitions have the advantage to avoid any interruption for the loads when a changeover is required for planned maintenance or test and provide less stress for the UPS batteries and nonsecure loads such as the chillers. However the close transition increases the short‐circuit current level due to the generator contribution in case of short circuit during the paralleling operation of both utility and generator. This short‐circuit current level can have a significant impact on the cost of the electrical distribution equipment.
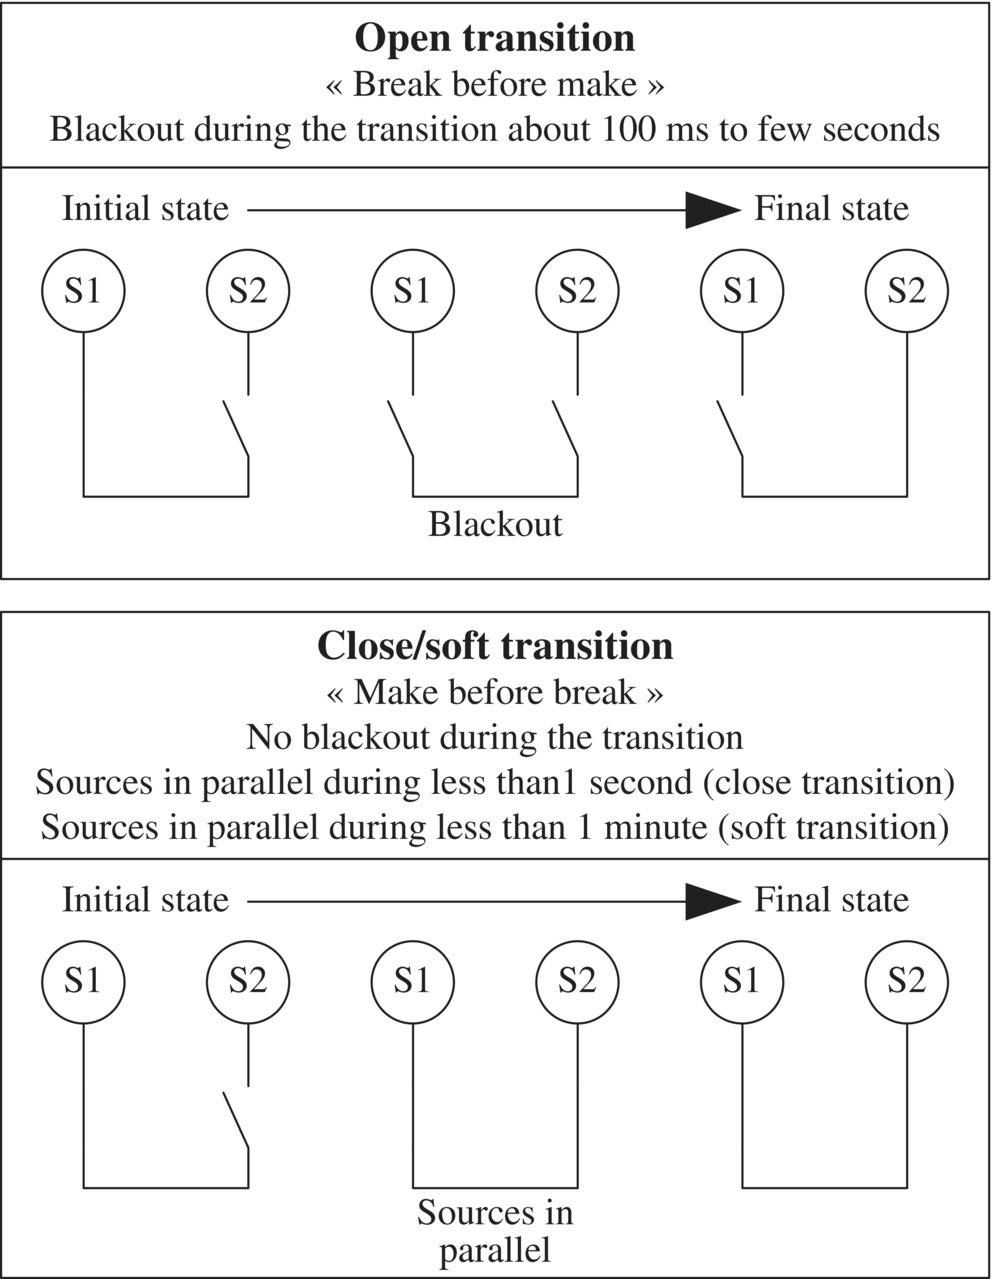
FIGURE 25.25 Different ways to make a changeover.
Source: © Schneider Electric.
25.4.3.4 LV Generator Starting Sequence
For a single generator, the starting time to reach the rated speed is about 5 seconds. When the generator is ready to take the load, the ATS transfer the switchboard load on the generator with a blackout in the case of an open transition. The main loads that will be reenergized are the UPS and the nonsecure cooling loads such as the chillers. The load impact depends on the load characteristics:
- The UPS will transfer the IT load from battery to the input main 1 after a delay; classically the UPS will transfer the load with a ramp up/down, which will minimize the load impact on the generator.
- The chillers will start after few minutes; classically the chiller includes some drives that will provide a smooth starting sequence.
The load impact has to be defined for each project and checked according to the generator capability.
25.4.3.5 MV Generator Power Plant Starting Sequence
In the case of an MV power plant with several generators, all the generators start at the same time and are coupled one by one to the generator bus taking less than 10 seconds per generator for synchronizing.
When the power plant is ready to take the load, the ATS transfer the switchboard load on the power plant with a blackout in the case of an open transition. As the main loads are supplied through the MV/LV transformers, the power plant will need to supply the inrush current due to magnetization of the transformers. For an MV/LV transformer, the maximal peak inrush is about 9 times the peak rated current when the transformer is energized by a perfect source. However, this value is much lower when the transformer is energized by a source with a lower short‐circuit power as shown in Figure 25.26. Moreover, when considering several transformers energized at the same time, the total current will be above the sum of all individual maximum inrush currents.

FIGURE 25.26 Simulation of MV/LV transformer inrush currents.
Source: © Schneider Electric.
These inrush currents will have two main impacts:
- Overcurrents that could trip the overcurrent protections
- Voltage drop due to reactive power impact that could trip the undervoltage and overvoltage protections
- Overvoltage due to the alternator voltage regulator (AVR) overshoot
To ensure correct operations:
- The overcurrent protections and undervoltage protections must be delayed to avoid any spurious trip;
- The reactive power impact has to be checked according to the generator AVR capability to avoid any voltage overshoot, but generally the generator does not experience any stability issue when energizing a transformer with an apparent power that is twice the alternator power.
25.4.3.6 Generator Power Rating
ISO‐8528‐1 standard defines the generator ratings according to four operational categories. In each category, the generator rating is defined by the maximum power output considering its running time and its load profile as shown in Figure 25.27.
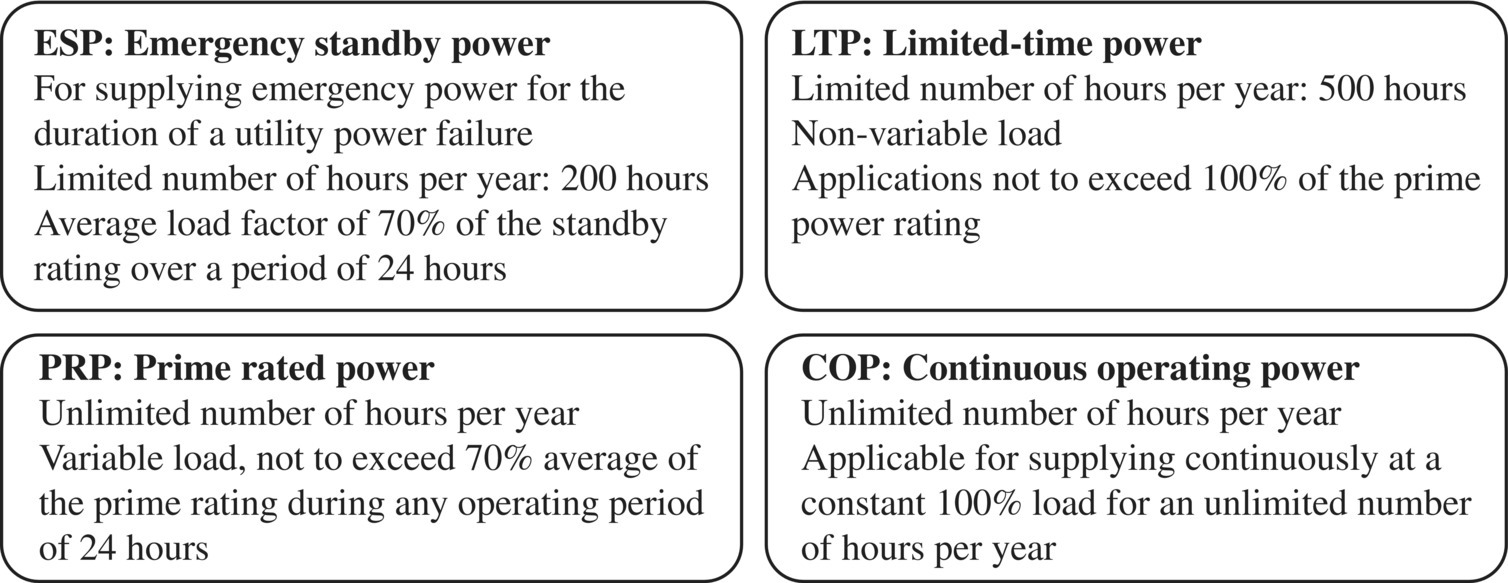
FIGURE 25.27 ISO 8528‐1 generator set ratings.
The same generator has different ratings according its operational categories. For data center applications, the mission profile of a backup generator is the following:
- Emergency operation in case of utility failure at 100% load (about less than 1% of the time)
- Nonemergency running time (for tests and maintenance purpose) less than 200 hours
According to the data center generator operational characteristics, the best solution is in between PRP and COP ratings, that is why, when specifying the generator power rating, the data center designers should not refer to the ISO‐8528‐1 but should mention the real mission profile and let the generator supplier providing its best solution.
25.4.4 MV Power System Design
The main topics for the MV power system are first the MV topology that should be in adequacy with the resilience principle depending if the generators are located at LV level or MV level.
25.4.4.1 MV Distribution Topologies
When the UPS and generators are located at LV level, the redundancy is full ensured at LV level. In this case, two alternatives are possible. Suppling all the MV/LV transformers without any redundancy as shown in Figures 25.28 and 25.29 will expose the data center site to run for a long period (1 month or more) in case of a major failure on the main MV substation.
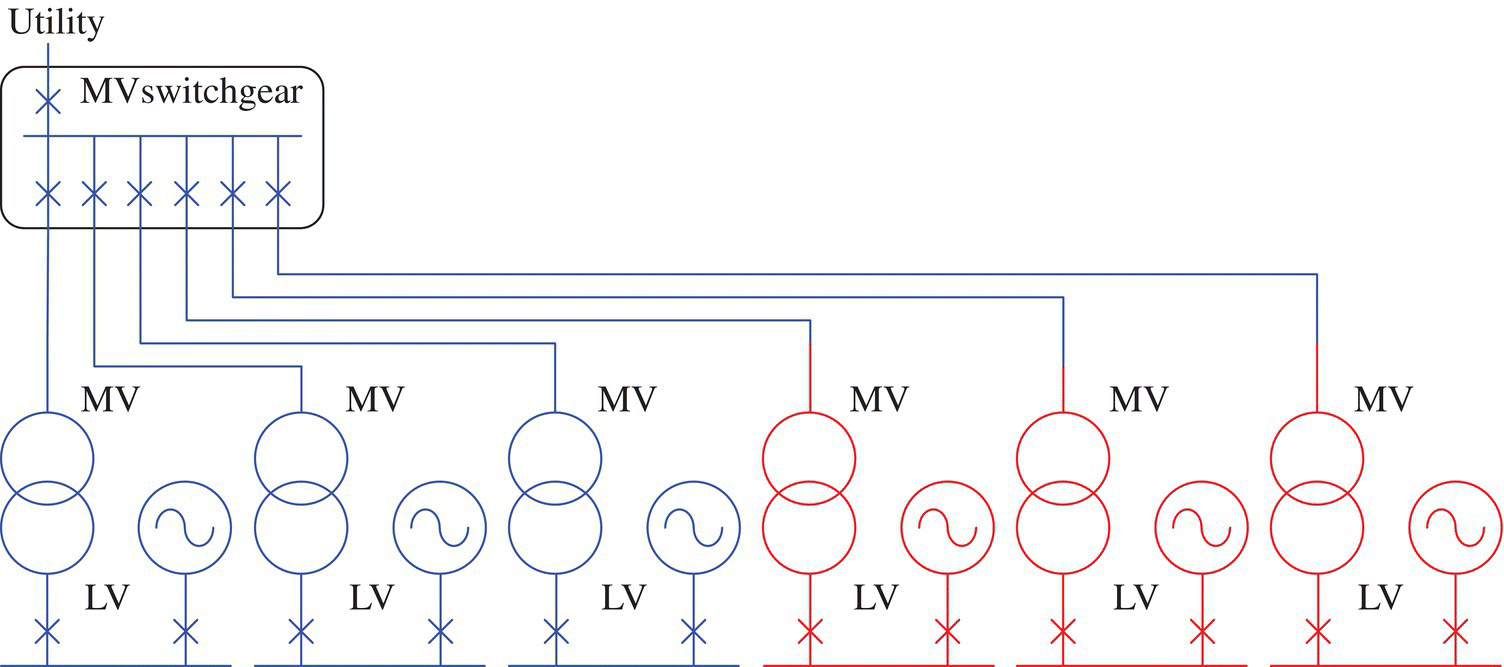
FIGURE 25.28 2N architecture with LV generators and nonredundant MV distribution.
Source: © Schneider Electric
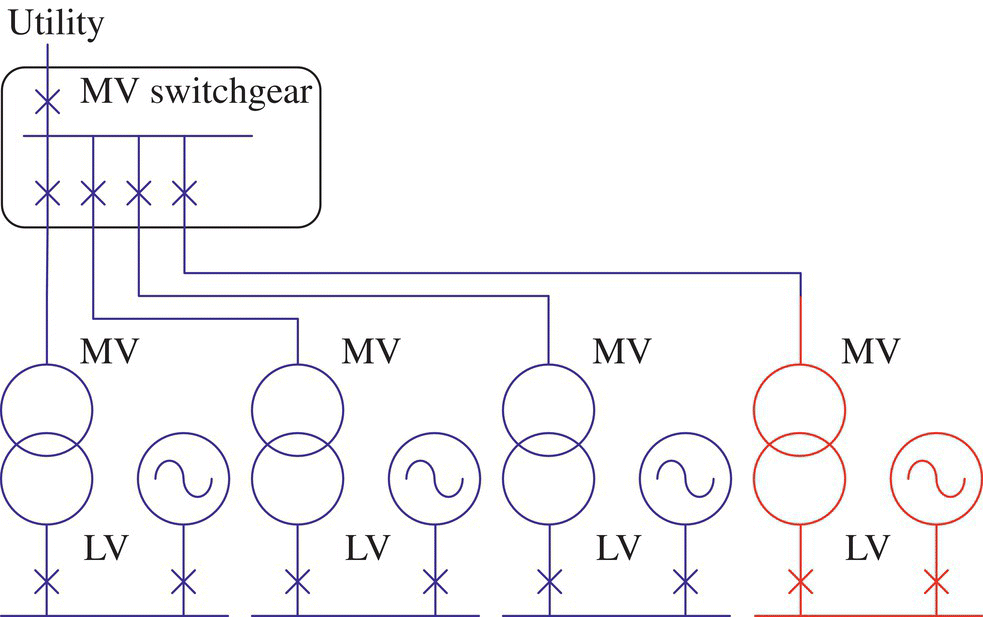
FIGURE 25.29 N + 1 architecture with LV generators and nonredundant MV distribution.
Source: © Schneider Electric.
However, running the data center on its generators for a long period can be a nuisance to suppliers and others. For example, if running a large data center continuously, it will have to refill the diesel tank frequently in a constraint area as well as air pollution emission that is not allowed by local regulatory. To avoid such situation, a solution is to provide redundancy even at MV level with two redundant MV switchboards as shown in Figure 25.30. A more cost‐effective alternative is to use an open loop distribution as the utility does as shown in Figure 25.31.
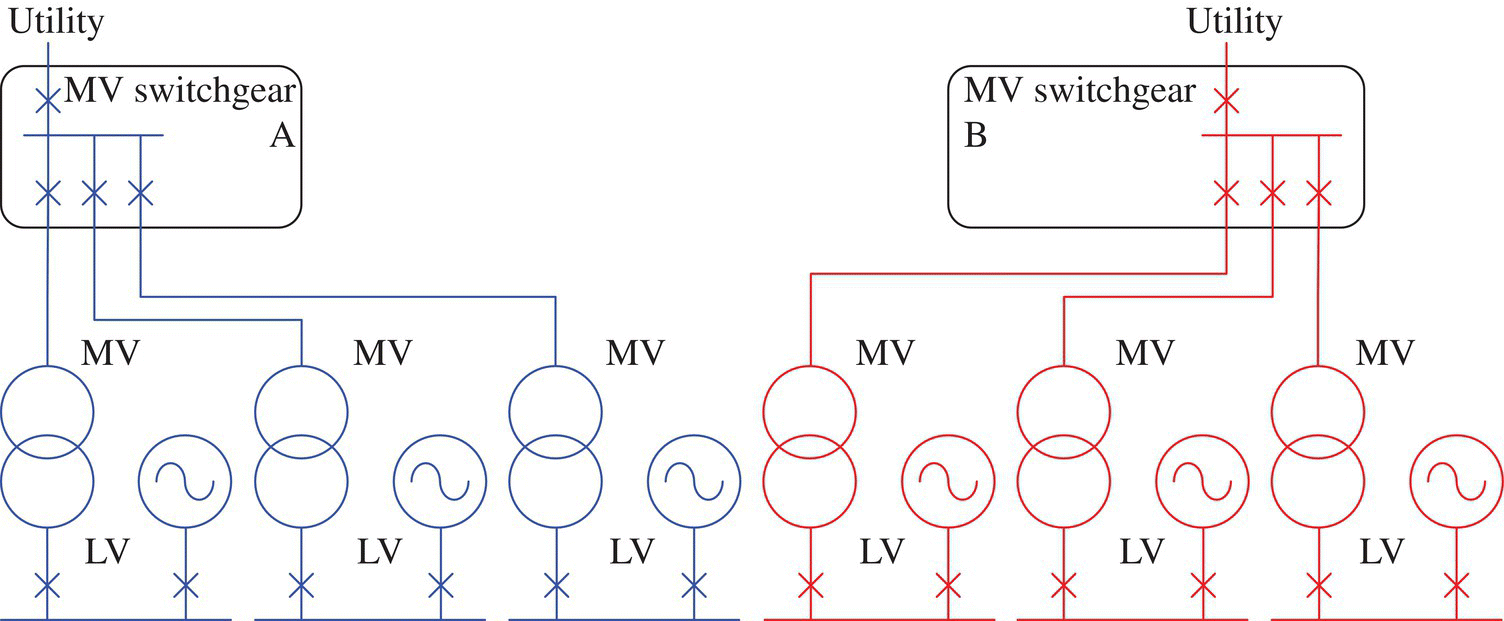
FIGURE 25.30 2N architecture with LV generators and redundant MV distribution.
Source: © Schneider Electric.
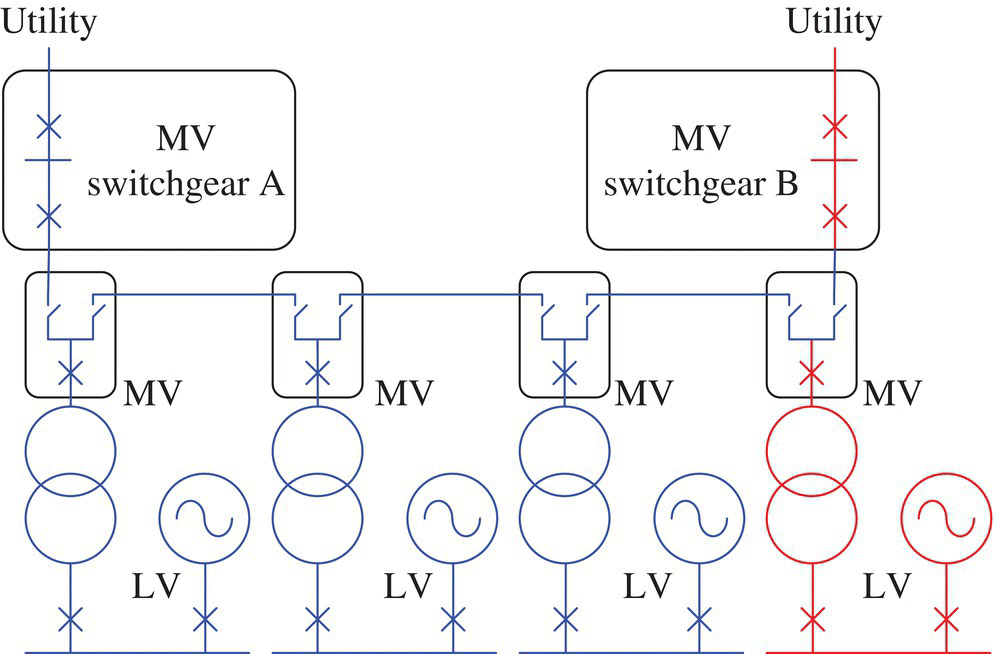
FIGURE 25.31 N + 1 architecture with LV generators and redundant MV distribution.
Source: © Schneider Electric.
In the case of an MV power plant, a redundant MV distribution is needed to ensure the overall redundancy of the data center. For 2N LV redundancy principle, the simplest MV distribution consists of two redundant MV switchboards supplied by a utility incomer or a generator incomer using an automatic transfer logic and a single MV generator board as shown in Figure 25.32.
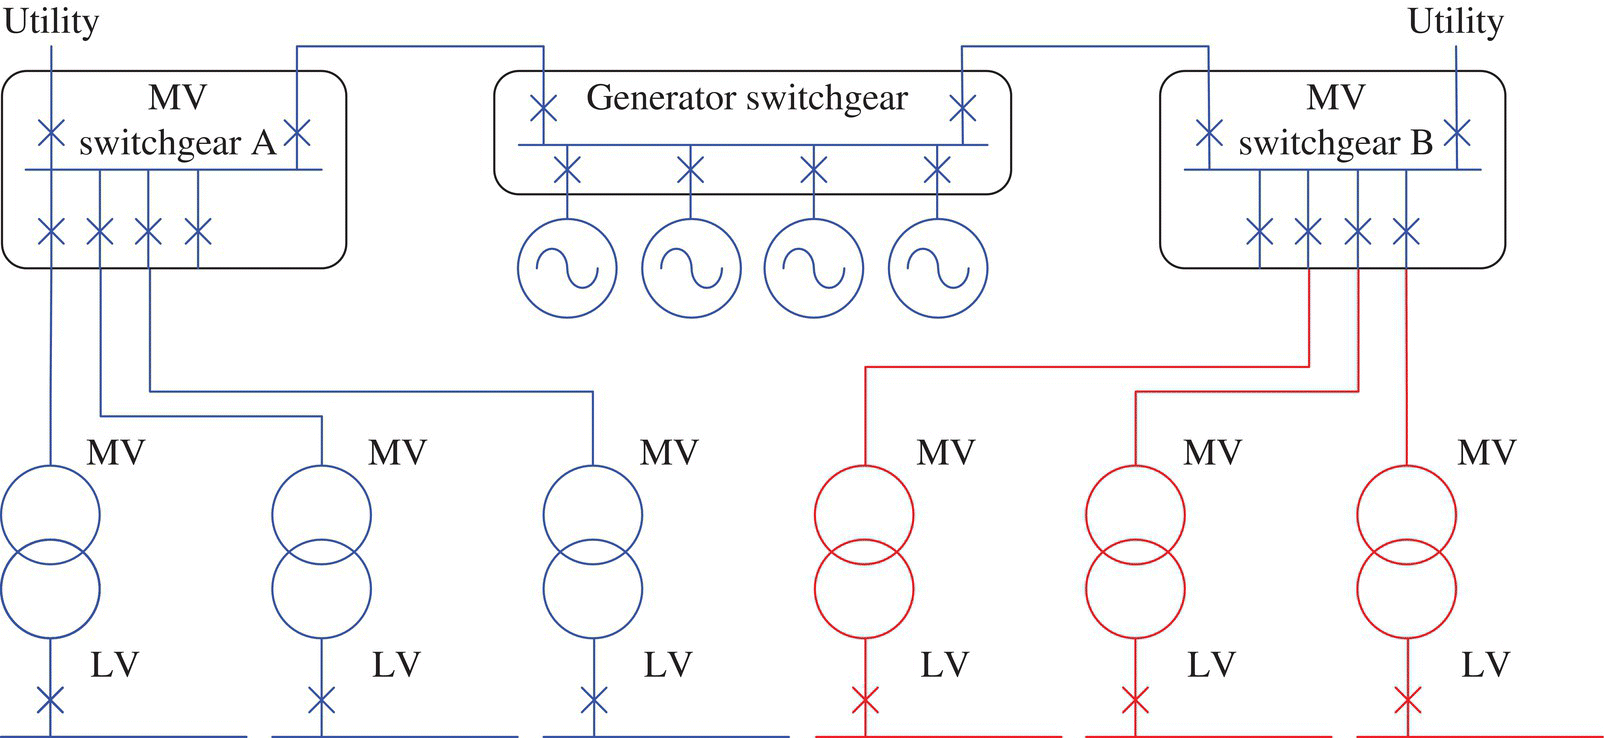
FIGURE 25.32 2N architecture with MV generators.
Source: © Schneider Electric.
If MV/LV power trains are designed with N + 1 redundancy, then the MV/LV transformers needed an MV automatic transfer switch to be able to be supplied by MV switchgear A or B as shown in Figure 25.33.
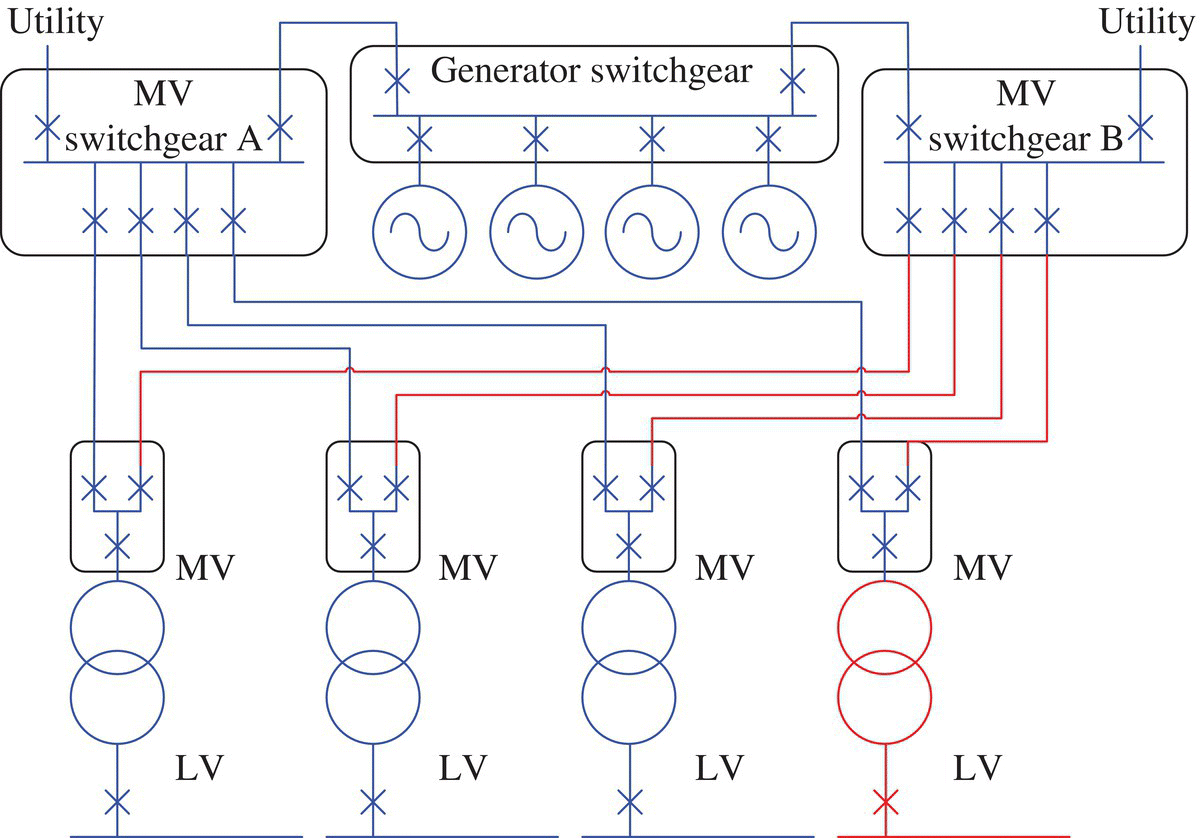
FIGURE 25.33 N + 1 architecture with MV generators.
Source: © Schneider Electric.
If the data center needs to meet Tier IV requirements according to the Tier classification, the MV generator power plant needs to be fully redundant by itself without considering the utility. In this case, the generator MV distribution cannot be achieved with a single bus. As generators are classically designed with N + 1 redundancy, two alternatives are possible:
- Closed ring with a single switchboard per generator as shown in Figure 25.34
- Double feeder from each generator to generator A and generator B switchboards as shown in Figure 25.35

FIGURE 25.34 Full redundant MV generator power plant using closed ring architecture.
Source: © Schneider Electric.

FIGURE 25.35 Full redundant MV generator power plant using double feeder architecture.
Source: © Schneider Electric.
25.4.4.2 MV Switchboards
Several kinds of MV switchboard technologies are available and can be classified in several ways as following:
- Types of installation:
- Indoor classically or outdoor
- Pole mounted, ground mounted, or pad mounted
- Types of insulation technology:
- Air‐insulated switchgear (AIS)
- Oil‐insulated switchgear (OIS)
- Gas‐insulated switchgear (GIS)
- Solid‐insulated switchgear (SIS)
- Shielded solid‐insulated switchgear (2SIS)
- Types of application:
- Primary (rated current up to 4,000 A and maximum short‐circuit current withstand up to 50 kA)
- Secondary (rated current up to 1,250 A and maximum short‐circuit current withstand up to 25 kA)
- Types of loss of service continuity (LSC) when opening accessible compartment (defined by the standard IEC 62271‐200):
- LSC1 (other functional units must be disconnected)
- LSC2A (other functional units can remain energized)
- LSC2B (other functional units and all cable compartment can remain energized)
To select the adequate MV CB short‐circuit breaking current, a particular attention shall be paid when considering the short circuit of both utility and MV generator power plant. A high aperiodic component of the short‐circuit current as shown in Figure 25.36 may lead to a derating of the CB short‐circuit breaking capacity according to IEC 62271‐100.
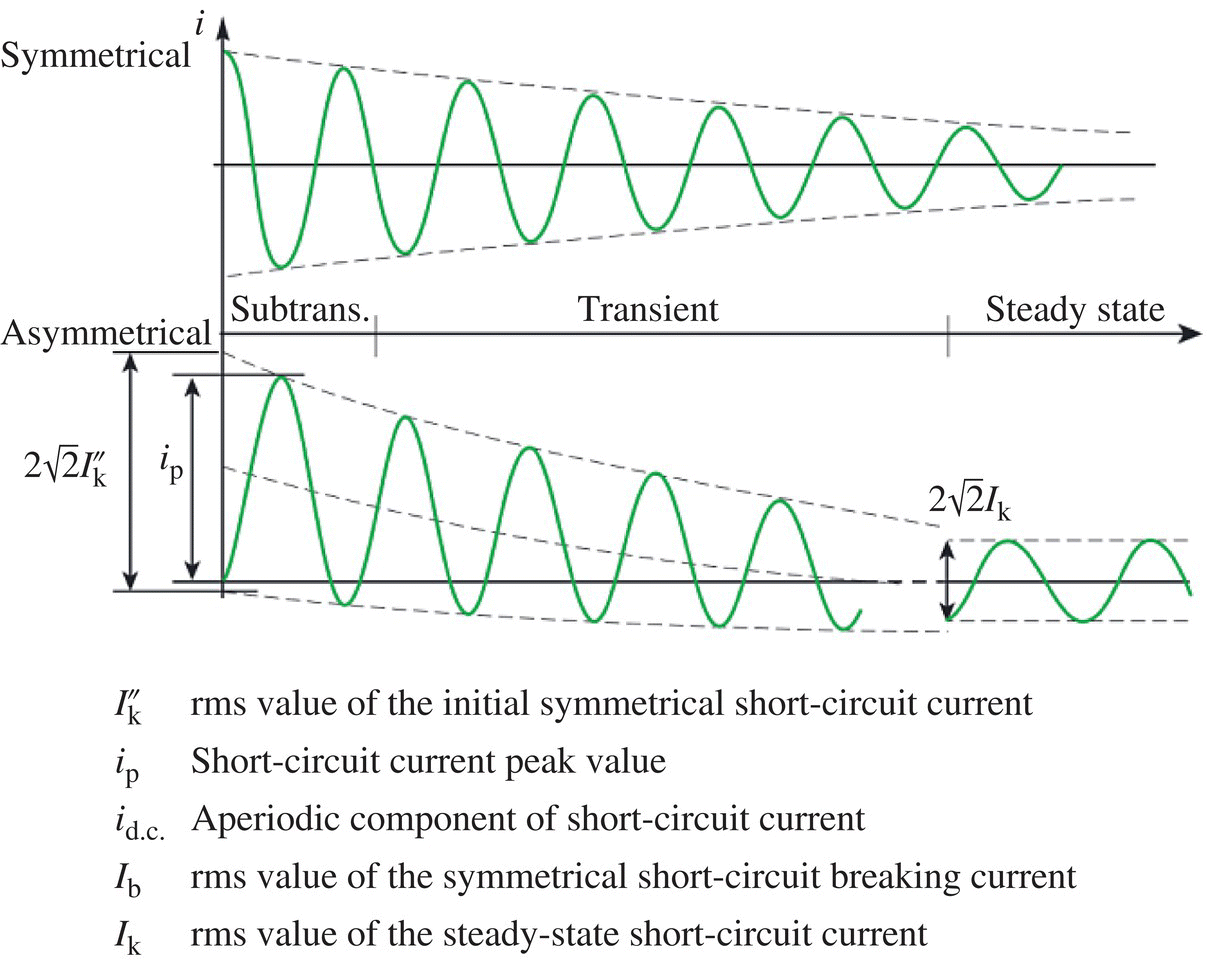
FIGURE 25.36 Definition of short‐circuit current values.
Source: © Schneider Electric.
The best switchgear range will be selected according to each switchboard characteristic such as the operating voltage, the rated current, the maximum short‐circuit current, the expected number of operations, the required number of current and voltage sensors for each cubicle, and the service continuity during maintenance. Other considerations such as the installation constraints (cable entry options and requirements for gas exhaust in case of internal arc) need also to be investigated when selecting the appropriate switchboard range. To meet the best cost‐effective solution, a general way is to use as possible secondary MV switchboard ranges of the country where the data center is located.
25.4.4.3 MV/LV Transformers
When installed in the data center building, the MV/LV transformers are preferred to be dry‐type insulation instead of liquid immersed because of the installation constraints. However, the option to install the MV/LV transformers outdoor has several advantages such as reducing the footprint of the electrical rooms in the data center building and avoiding any transformer room cooling system. The apparent power range goes generally from 1 to 4 MVA with natural cooling rating. In terms of efficiency, the best option to minimize the total cost of ownership (TCO) is to select a transformer with low losses. Power transformers that meet the European eco‐design directive are efficient products to use.
25.4.4.4 MV Protection System
Considering a typical large data center site connected at HV grid with several phases as shown in Figure 25.37, the MV protection system consists of the protection of the cables from the HV/MV substation down to the MV/LV transformers, the protection of the generators and the generator switchboards, and the protection of the MV/LV transformers and its MV switchboard.
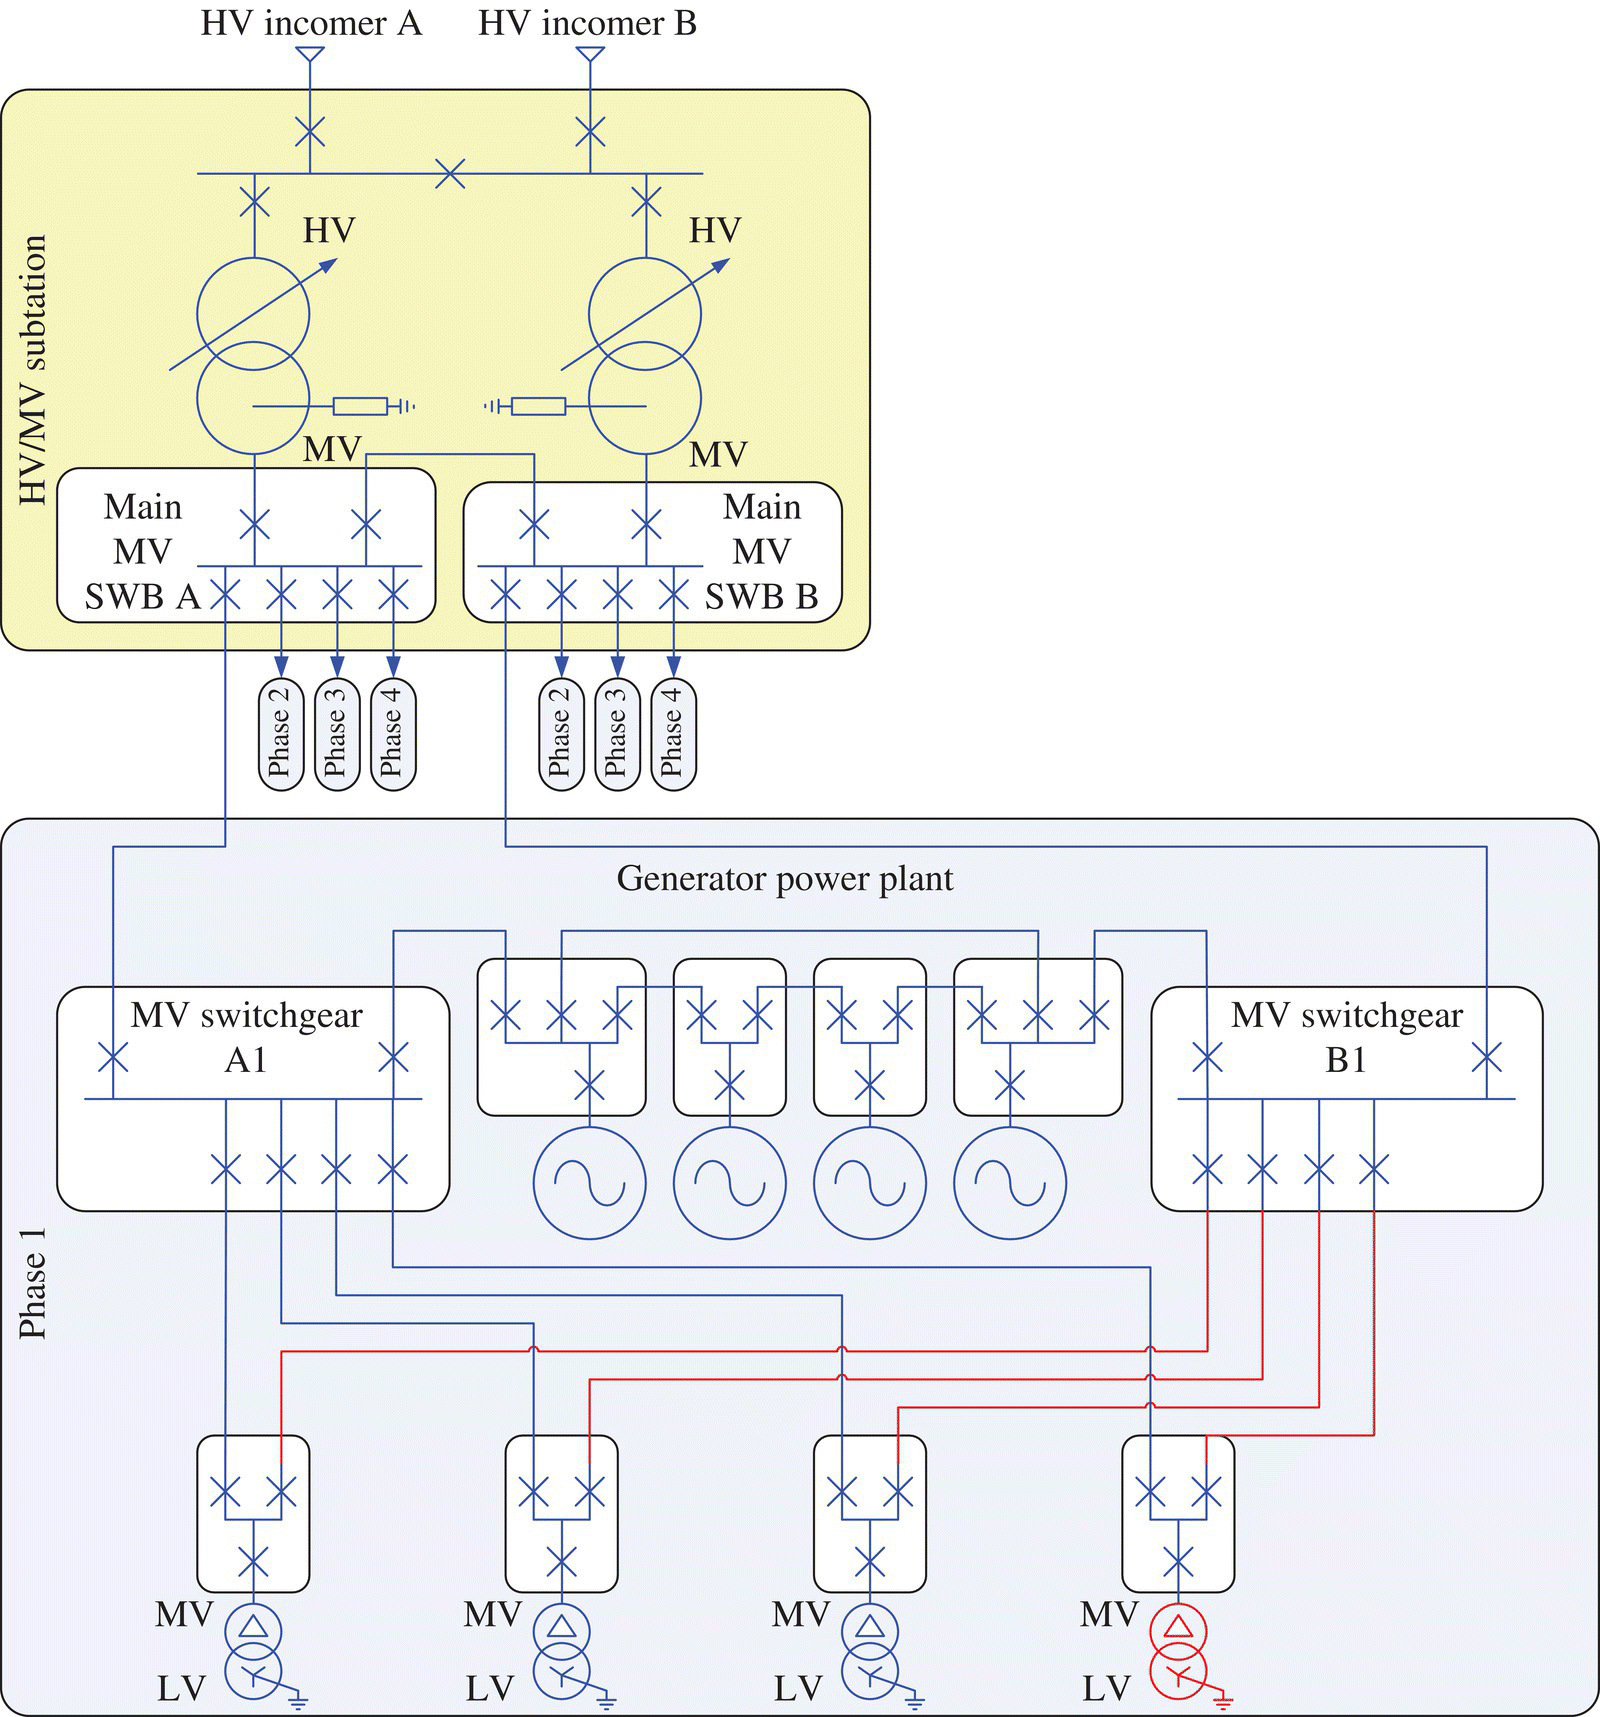
FIGURE 25.37 Example of a large data center MV power system.
Source: © Schneider Electric.
The neutral is classically earthed with a resistor. The ground fault level is set as low as possible to minimize the equipment damage in case of an earth fault. For the MV backup generators, two alternatives are possible depending on the habits:
- The generator power plant is equipped with an earthing transformer and a resistor.
- Or each generator is grounded with a resistor.
The second alternative has the benefit to be bit more reliable but has the drawbacks to increase the ground fault level.
The simplest protection system to protect the switchboards and the cables against short circuits is to use basic overcurrent protection (ANSI 50/51) with time‐graded discrimination between protections. The drawback is that a 300 ms delay is needed for each stage so that the main protection could be set with a delay of more than 1 second. To reduce the fault clearing time and achieve a better protection level, several options are possible:
- The first option is to use logic selectivity between the incomer CB and the feeder CB of the same MV switchboard avoiding any wiring outside the switchboards.
- If it is not enough, the logic discrimination can be used between different switchboards, and some additional pilot wires are needed between switchboards.
- If it matches the local habits, another alternative is to use line and bus differential protections, but this induce an over cost of the protection system.
The alternator of the generator is classically protected by the generator controller. The MV CB relay of a generator includes generally only the overcurrent protection and a directional overcurrent protection to be able to clear an alternator fault by disconnecting only the failed generator. Other functions like generator differential protection, undervoltage/overvoltage protections, and synchro check protection can also be selected.
The MV/LV transformers are protected classically with phase overcurrent protections (ANSI 50/51), earth fault overcurrent protections (ANSI 50/51G) at MV level, and other protections depending on the transformer type (dry or liquid immersed). Additional protections can be selected to trip faster and limit the damage on the transformer such as transformer differential protection (ANSI 87T).
25.4.4.5 MV Automatic Transfer Switch (ATS)
When a MV automatic transfer switch is needed to transfer from a source to another, a particular attention shall be paid to the specification, the design, and the commissioning because the ATS are one of the main equipment that ensure the reliability of the data center infrastructure. The ATS must transfer when the voltage is not suitable for the loads. The key points when designing an ATS are:
- The power configuration according to the available MV cubicle functions and the requirements in terms of protection, durability, and maintenance
- The control design according to the type of voltage sensors available (voltage presence indicators or voltage transformer), the way to achieve the ATS control logic (a dedicated ATS controller, a PLC, a single protection relay or two protection relays)
Moreover a detailed failure analysis and a test plan can minimize the risk of common mode failure by checking the MV ATS behaviors in any case including different scenarios of failures or disturbances upstream the ATS (voltage drop on one or several phases, voltage loss on one or several phases, etc.) and different failures in the MV ATS itself (unintended opening of the CB, loss of control power, wrong settings, etc.).
25.4.4.6 MV Power Monitoring
The monitoring at MV level includes the monitoring of the MV switchboards (states of the switches and CB, state of the protection relays and PLCs, and voltage presence indicator). Some metering equipment are also classically located at the incomer of the primary and secondary distribution switchboards to provide both energy metering and power quality monitoring (voltage and current harmonics, voltage sags).
25.4.5 LV Power System Design
The load specificities impact the LV power system architecture.
25.4.5.1 IT Racks
Nowadays, IT equipment such as web or application servers, storage servers, switches, and routers are mounted in a server rack. A server rack using rack‐mounted technology as shown in Figure 25.38 consists of:
- The servers that are single phase, whereas the rack can be single phase or three phase depending on the rack rated power;
- Dual rack‐mounted power strips provide the different sockets for each server;
- Rack‐mounted server with embedded dual PSU; the server PSU supply both cooling fans and different IT subsystems.
A server rack using open compute project (OCP) technology as shown in Figure 25.39 consists of the following:
- The rack can be single phase or three phase depending on the rack rated power.
- The PSU are mutualized for several servers; several PSU in parallel are providing a single DC bus at 12 or 48 VDC; optional redundant PSU can improve the reliability; optional battery bloc can provide the UPS function at the rack level.
- The server cooling fans are also mutualized for several servers with optional redundant fans.
- The severs are supplied by a single connection to the rack DC bus.
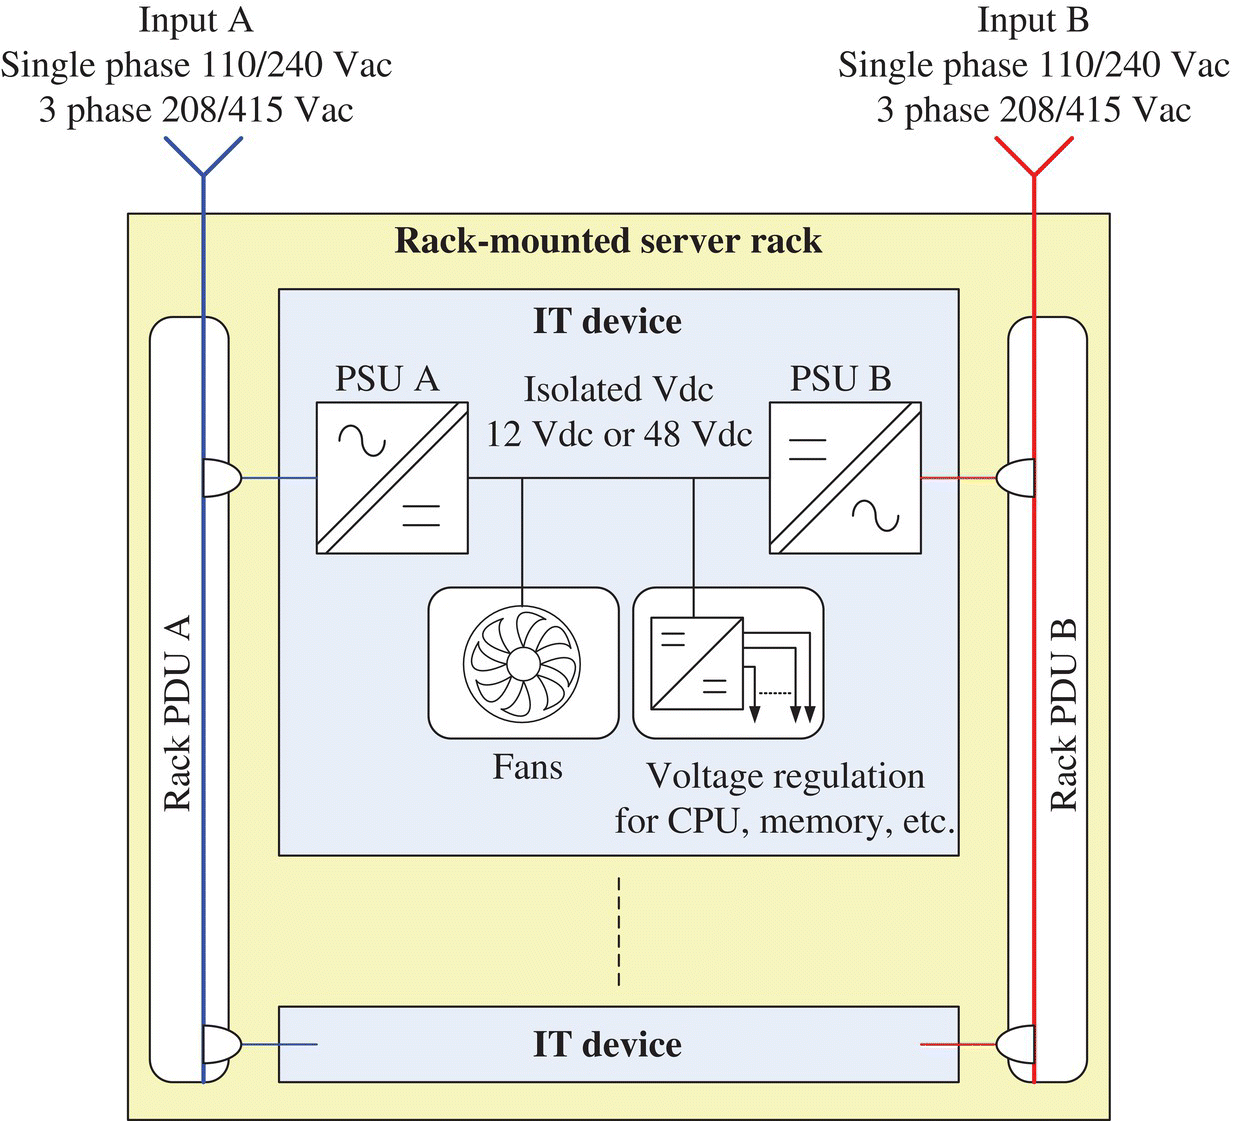
FIGURE 25.38 Server rack—rack‐mounted type.
Source: © Schneider Electric.
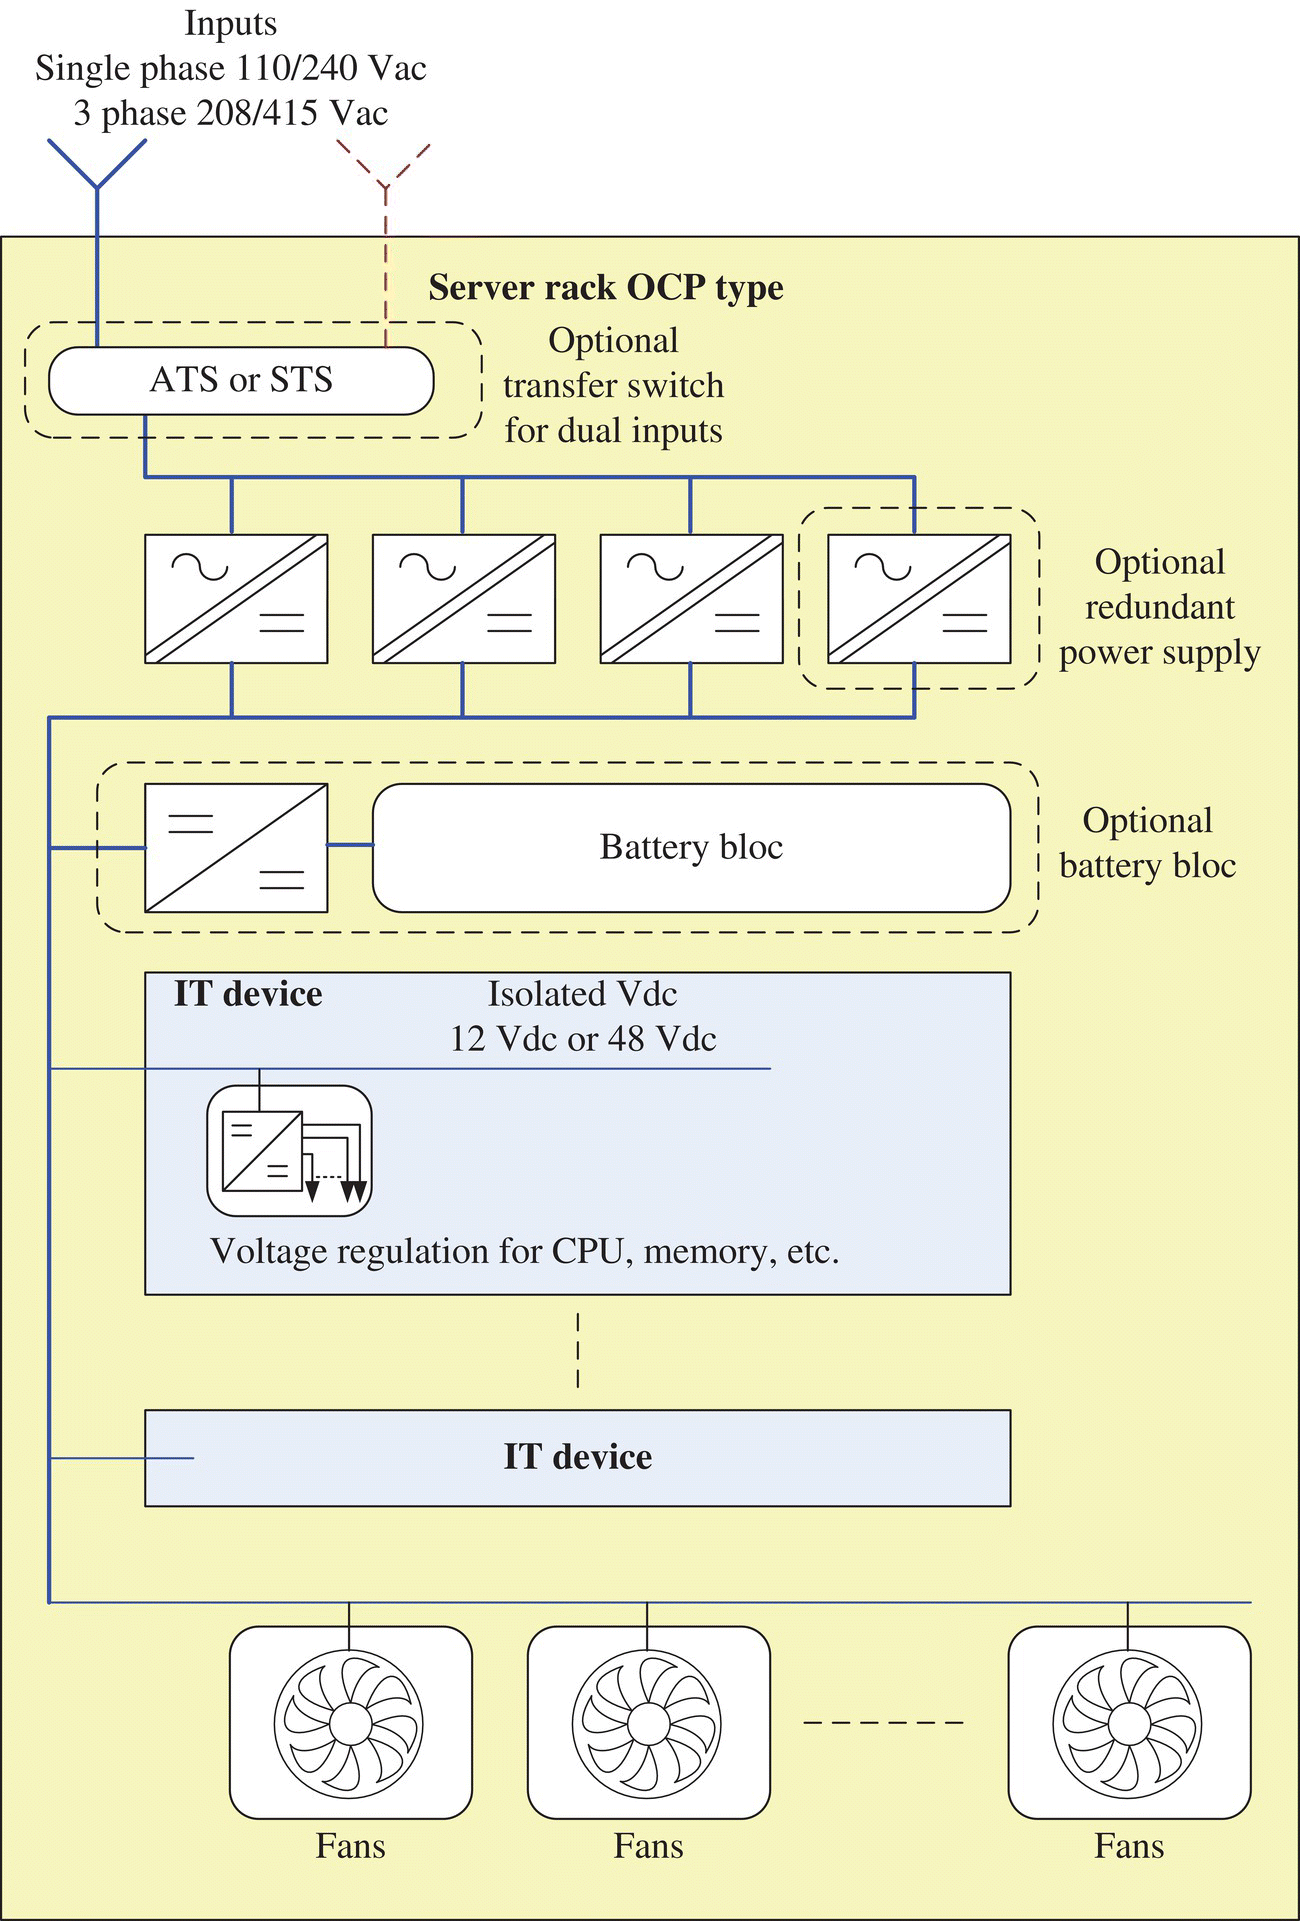
FIGURE 25.39 Server rack—open compute project‐(OCP) type.
Source: © Schneider Electric.
25.4.5.2 Cooling Loads
The cooling system of a data center is designed to put outside the heat produced by different rooms (technical rooms and IT rooms). Two major cooling technologies are currently used for data center cooling: chilled water cooling and direct or indirect cooling.
Chilled water cooling is using chillers, water pumps and piping for distribution, and air handling units (AHUs) in the different rooms of the data center. Classically, the AHUs and the water pumps need a secured power supply to be able to maintain the IT room temperature during the backup power plant starting sequence in case of the primary source outage. The chillers are not secured.
Direct or indirect cooling is using fans for supply air and exhaust air, filters, and water misting when needed. In this kind of system, all electrical loads are secured with UPS.
The cooling load maximum electrical consumption can vary depending on the cooling technology, the cooling equipment, and the outside air extreme conditions. Classically the maximum power usage effectiveness (max PUE) can vary from 1.5 to 2.
Cooling loads are also classically equipped with variable frequency drives (VFD) embedded in the equipment or not. As VFDs can lead to electrical perturbances due to leakage currents in the ground that may disturb sensitive communication equipment, a particular attention shall be paid when supplying perturbating loads such VFDs and IT loads with the same MV/LV transformer. As shown in Figure 25.40, the best option in terms of electromagnetic compatibility (EMC) is to have a galvanic separation between sensitive loads and disturbing loads.
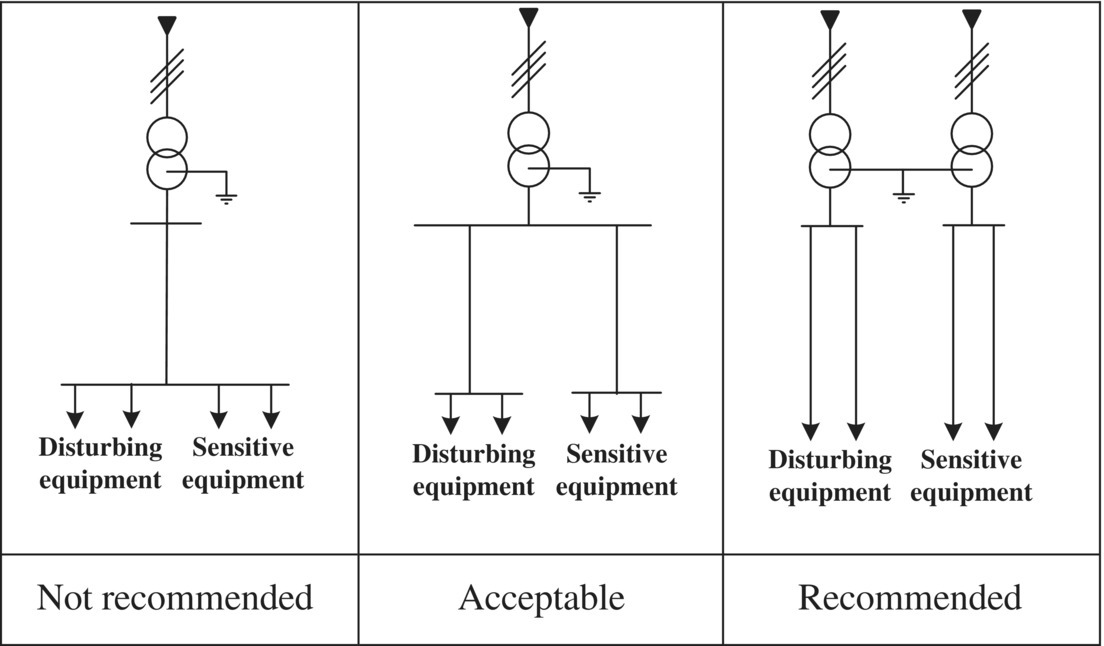
FIGURE 25.40 Load separation principle.
Source: © Schneider Electric.
However, supplying both the IT loads and the cooling loads by the same MV/LV transformer can be interesting when considering the scalability of the data center infrastructure.
25.4.5.3 LV Distribution Alternatives with Classical Static UPS Technology
When selecting the LV topology with static UPS, the LV distribution for data center consists of the system composed by the MV/LV transformer, the main LV switchboard, the UPS units, and the final distribution using busway distribution or cable distribution as shown in Figure 25.41.
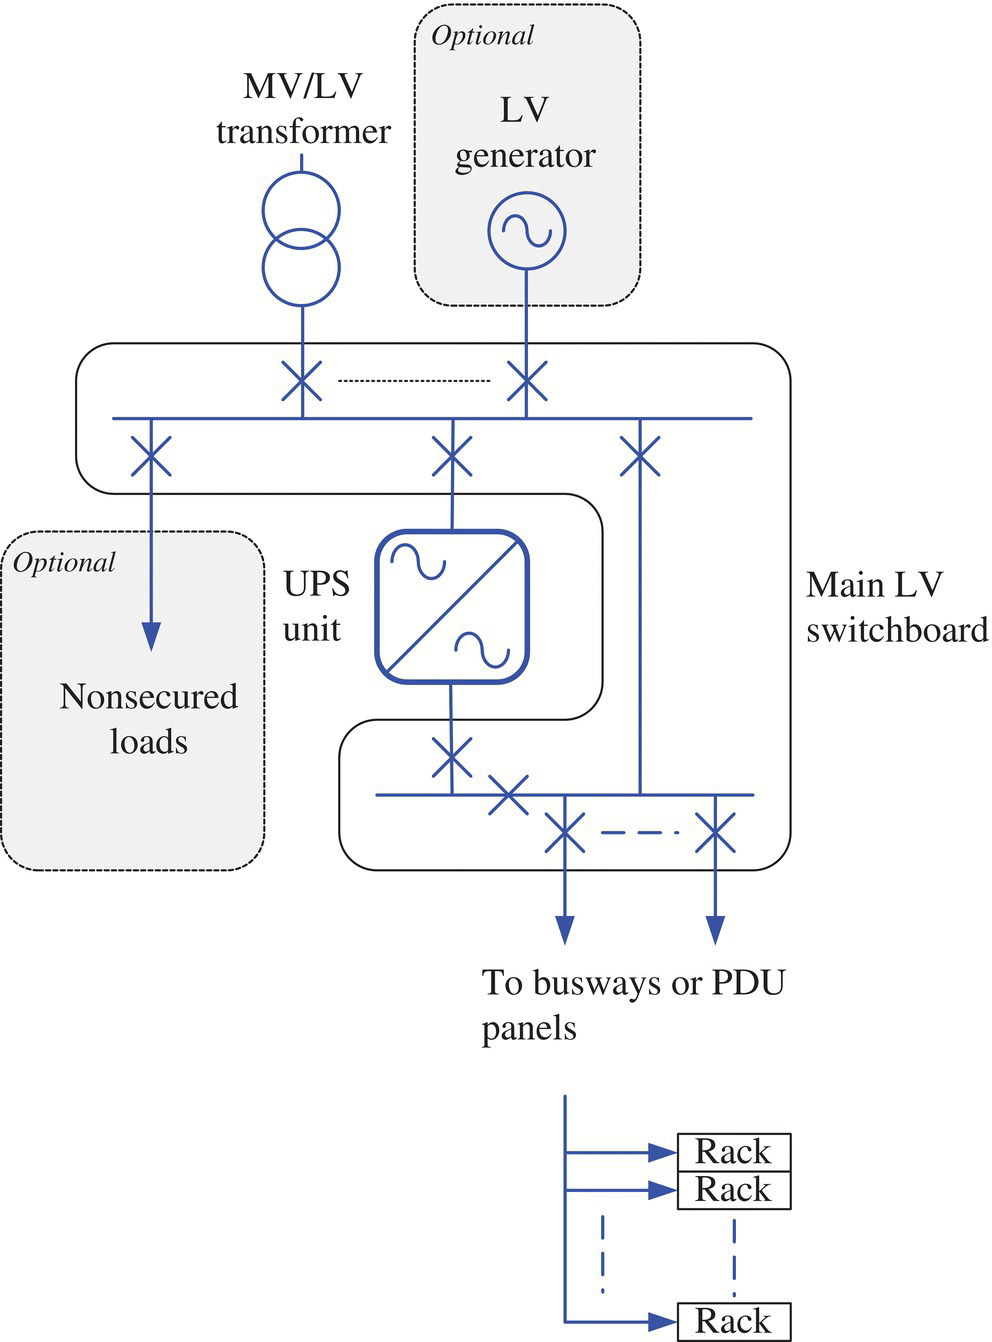
FIGURE 25.41 Overview of LV distribution for data center.
Source: © Schneider Electric.
Depending on the habits and the rated voltage of the loads, several ways to design the LV distribution are possible. The use of LV/LV transformer in North America was initially used to convert the voltage from 480/277 V to 208/110 V in North America applications as shown in Figure 25.42. In other areas, as the voltage of the main LV switchboard and UPS are the same, it is possible to delete the LV/LV transformer as shown in Figure 25.43.

FIGURE 25.42 LV distribution using LV/LV transformer.
Source: © Schneider Electric.
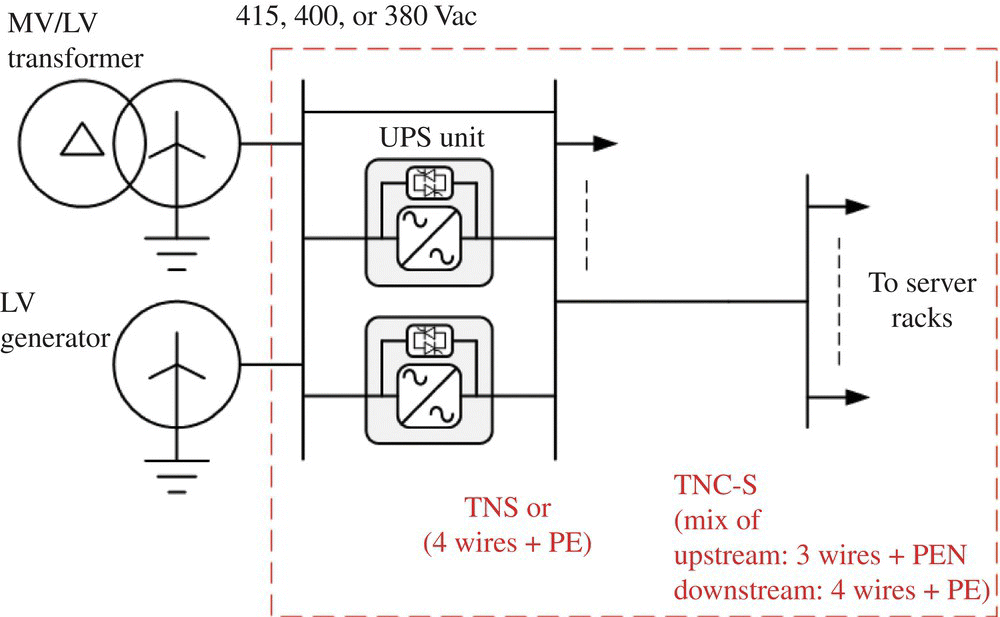
FIGURE 25.43 LV distribution with no insulation transformer.
Source: © Schneider Electric.
When the LV distribution is:
- Only TNS (Terra Neutral – Seperate) earthing system from the source down to loads;
- Without any insulation transformer;
- Equipped with an LV ATS to switch on an LV backup generator;
there is a sequence of operation where the UPS can operate ungrounded with possible overvoltages that can bother the server racks. Indeed, during the four‐pole ATS switching from the MV/LV transformer to the generator supply, when the ATS has opened the transformer LV CB, the UPS loses the neutral reference to the ground. The UPS will suddenly operate in battery mode ungrounded and recovering the TNS earthing system when the ATS close the generator incomer CB. During the switching operations, the server racks downstream experience some phase‐to‐ground overvoltages that may stress the overvoltage protection of the server PSUs and that could lead to increase the PSU failure rate. To avoid such situations, the best option is to avoid the loss of neutral reference to the ground during the source transfer.
The distribution from the main LV switchboard to the server rack can be done using divisionary panels and cable distribution to the racks or using busways with tap‐off boxes in each row of racks as shown in Figure 25.44.
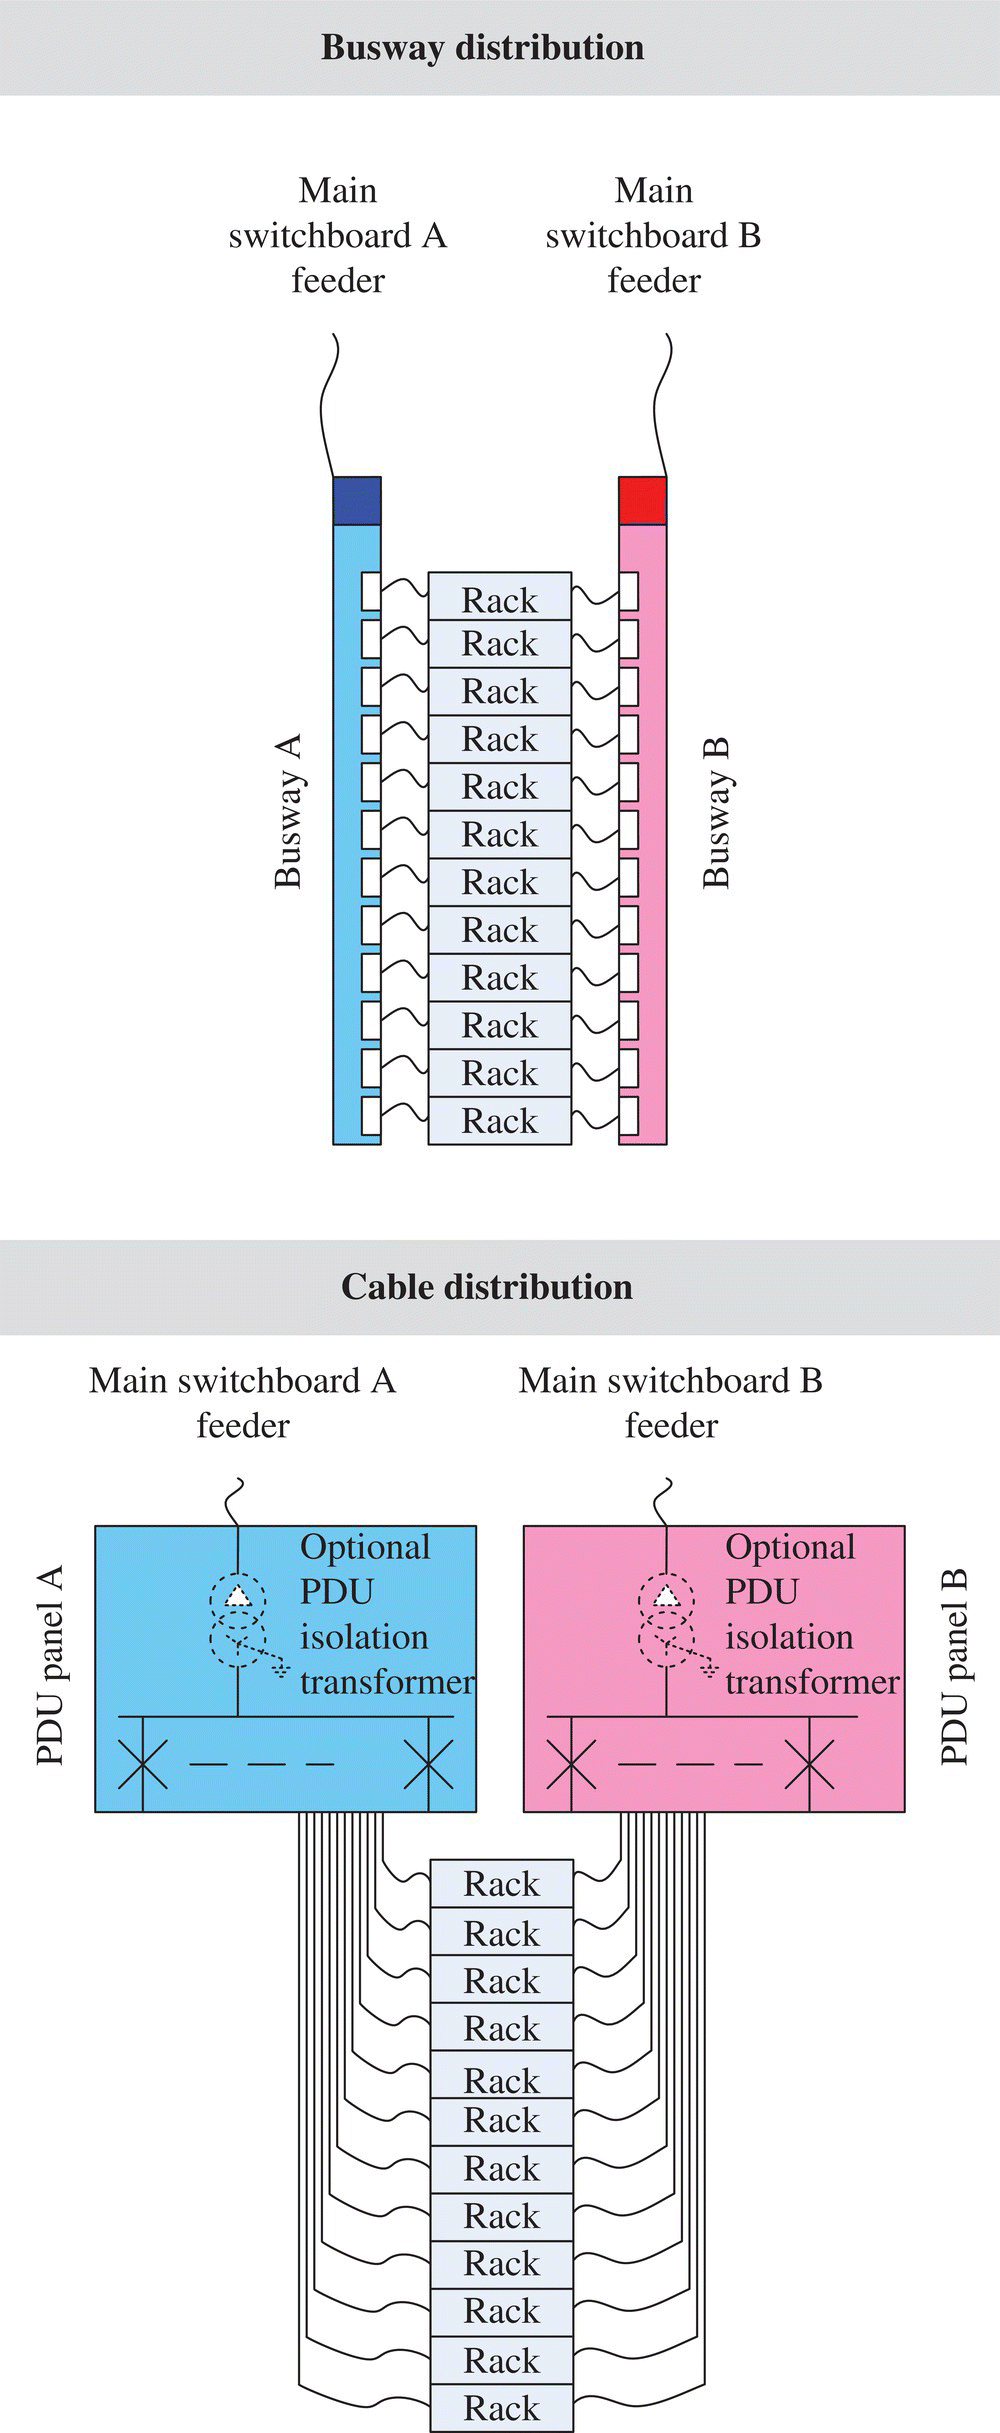
FIGURE 25.44 Alternatives for final LV distribution.
Source: © Schneider Electric.
The choice between busways and cable distribution has to be done according to the flexibility during installation and operating phases, the equipment cost, and the labor cost.
25.4.5.4 Main LV Switchboard Architecture
A standard LV switchboard architecture for a data center application, as shown in Figure 25.41, includes:
- The source incomers (transformer or generator)
- The UPS input CB
- The UPS output switches
- The UPS main bypass switch
- The outgoing feeder to supply the busways or the PDU panels
- The automatic transfer controller when needed
- The metering equipment
- The communication equipment
The main LV switchboard is an important piece of equipment in the data center distribution as:
- It is a key part of the UPS system;
- It deals with high constraints in terms of permanent current (up to 6,300 A) and high short‐circuit current (up to 100 kA rms) and in terms of durability as the CB are operated regularly when doing the generator or UPS test and the maintenance of the UPS;
- It needs high performances in terms of safety (ensure people and equipment safety), reliability (ensure high reliable protection level, ensure very low risk of internal failure), and availability (ensure low unavailability duration in case of maintenance);
- It represents a significant part of the LV equipment cost.
LV switchboards are composed of LV devices such as CB and switches defined by the standard IEC60947 and the enclosure with its bus bar arrangement and its connections defined by the standard IEC61439.
The different technologies of LV CB are:
- Air circuit breakers (ACB) for current ratings from 1,000 to 6,300 A with parts that can be maintained (breaking poles, drive mechanism, and the trip unit); the tripping curve can be adjusted, and the trip order can be delayed for selectivity purpose;
- Molded case circuit breaker (MCCB) for current ratings from 100 to 1,600 A (only electronic trip unit is able to be tested); the tripping curve can be adjusted;
- Miniature circuit breakers (MCB) for current ratings from 2 to 125 A.
An important element is that LV CB have current deratings according to the temperature in the switchboard. Depending on the switchboard technology and the room ambient temperature, the CB current derating has to be taken into account when selecting the right current capacity.
Several specifications can have a significant impact on the design of the switchboard such as:
- Electrical main characteristics of the switchboard and its CB such as the voltage level that varies from 380 to 480 Vac and the permanent current rating goes up to 6,300 A;
- The short‐circuit current values for the switchboard such as the rated peak withstand current (Ip that represents the electrodynamic constraint) and the rated short time withstand current (Icw that represents the thermal constraint during a short circuit);
- The short‐circuit current characteristics for the CB such as the rated peak withstand current (Icm rated making capacity), the rated short‐circuit breaking current (Icu ultimate breaking capacity), and the rated short time withstand current (Icw);
- The internal arc protection options such as the internal arc‐type test or arc free using solid insulation;
- The switchboard functional unit type (withdrawable or fixed type);
- The form factor of the switchboard (defined by IEC 61439 that specifies several levels named “form” of internal separation);
- The IP index (protection index code according to IEC 60529 that defines the level protection of electrical enclosure against intrusion, dust, accidental contact, and water) and the room temperature that can lead to increase the derating of the CB and the switchboard column;
- The CB duty factor that can provide useful information to optimize the number of CB in a single column.
Classically, main LV switchboards for data center application have the following features:
- Switchboard technology with form factor 4b (separation of the bus bars from the functional units and each functional unit from the other units, separation of the terminals for a functional unit from the bus bars, and those of any other unit).
- Withdrawable or equivalent (such as plug‐in mounting plate) to allow to add new feeder CB or maintain any CB without shutting down the switchboard.
- Internal arc‐type test.
- IP31 and 40°C maximum ambient temperature are enough as the switchboard is generally installed in a room‐equipped air conditioning.
When designing the LV distribution and the main LV switchboard, it is important to remind few key elements to optimize the cost and footprint:
- Use as possible the full capacity of the CB.
- Simplify the LV switchboards by grouping the input and output UPS switchboards.
- Check that the specified short‐circuit values do not lead to oversize the CB such as going from single pole CB to double pole CB.
- Optimize the switchboard by specifying the right rated short time withstand current Icw according the effective fault clearing time.
- Check that all options are useful for the customer such as:
- The close transition between the MV/LV transformer and the LV generator
- The UPS load bank
- The generator load bank CB
- MV/LV transformer advanced protection that can require additional LV current sensors
- The power monitoring equipment that requires additional current sensors
- Decrease the number of columns by:
- Taking into account the CB duty factors to optimize the number of CB per column (example of the transformer incomer CB and generator incomer that never runs in parallel),
- Designing special bus bar arrangement.
An example of classical LV switchboard architecture is shown in Figure 25.45.
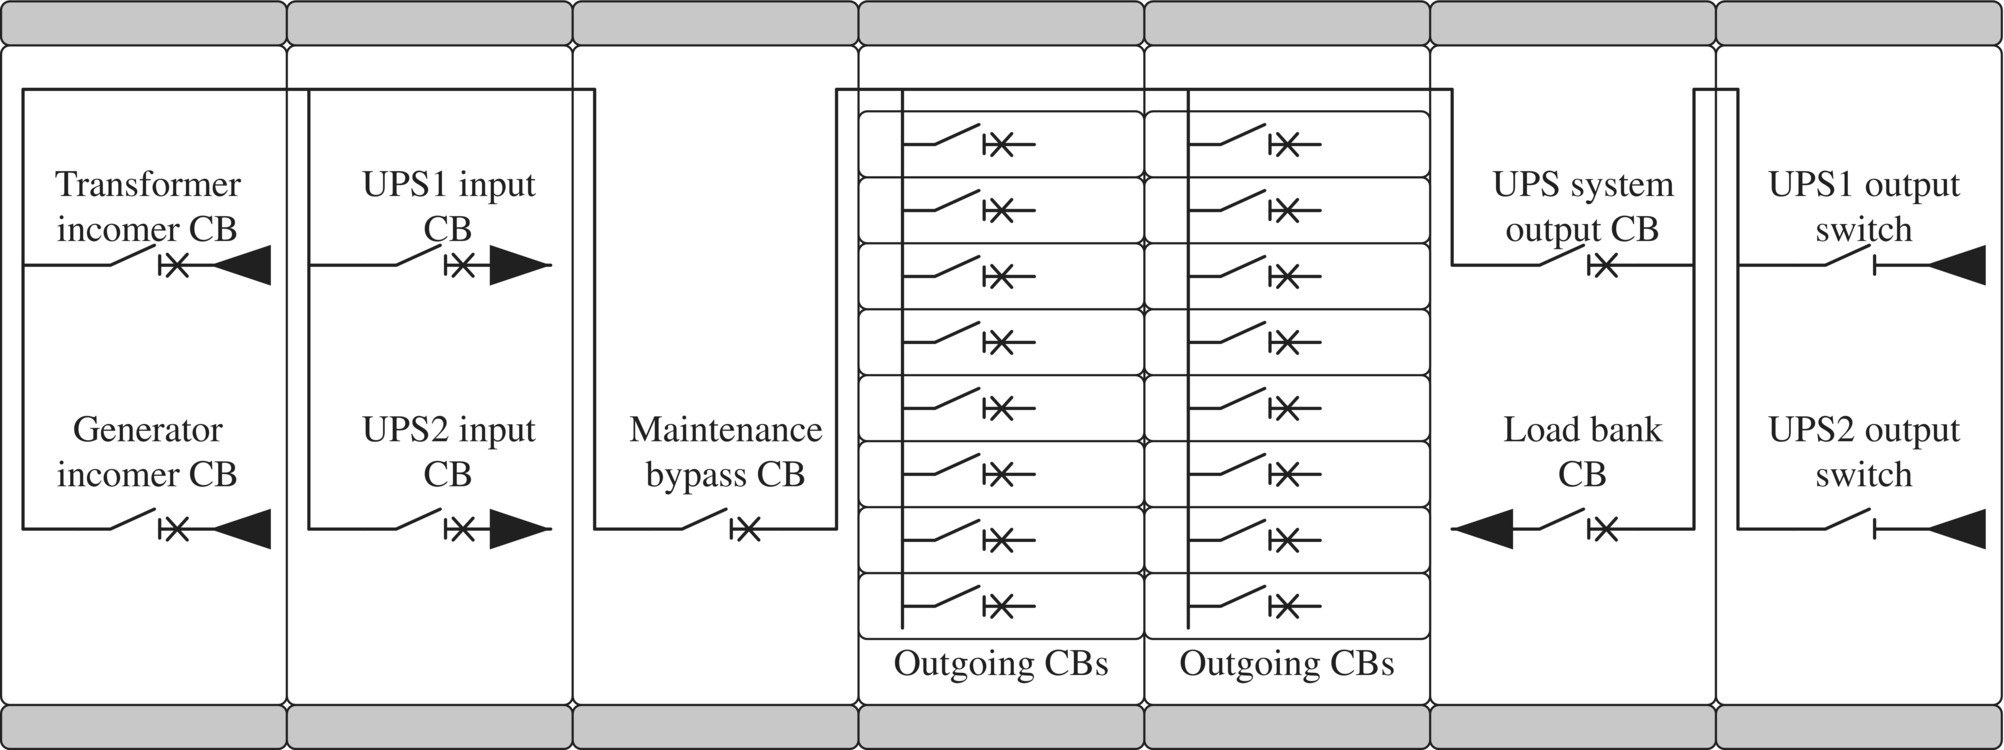
FIGURE 25.45 Example of main LV switchboard with a power train composed of two UPS units and a UPS load bank.
Source: © Schneider Electric.
25.4.5.5 Static UPS System
An example of a classical architecture of 3‐phase UPS system for data center is shown in Figure 25.46. Two units are put in parallel to reach the required capacity to supply the load. Each unit is equipped with its battery system and its static bypass switch. Depending on the UPS products, it is also possible to have one single bypass static switch for all UPS units. A main manual bypass switch (MBB) is able to take the whole load and allows to perform the maintenance on both UPS units while supplying the load. Thanks to the system isolation breaker (SIB), it is also possible to supply the load through the manual bypass switch and make a UPS test on a load bank.
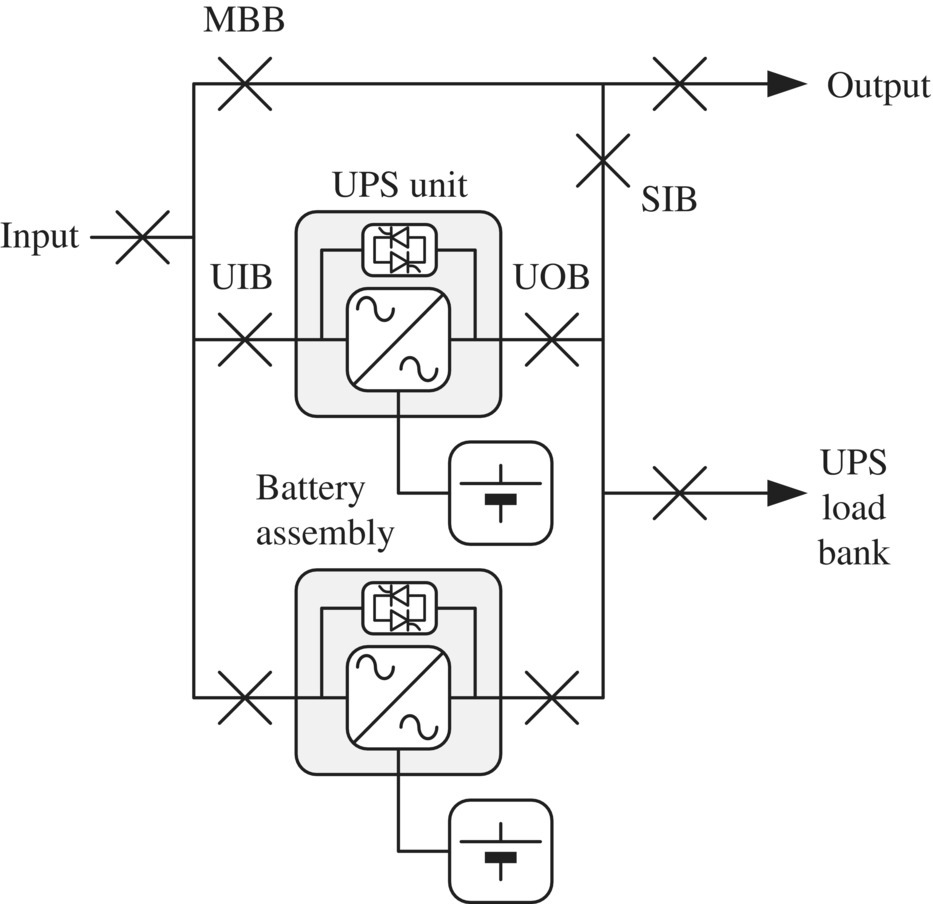
FIGURE 25.46 Example of UPS system for data center.
Source: © Schneider Electric.
Depending on the UPS products, several UPS system configurations are possible depending on the UPS unit size, the number of UPS in parallel, the redundancy level of UPS units or modules, the UPS unit modularity, and the option to have a centralized static bypass (Figs. 25.47 and 25.48).

FIGURE 25.47 UPS unit internal modularity.
Source: © Schneider Electric.
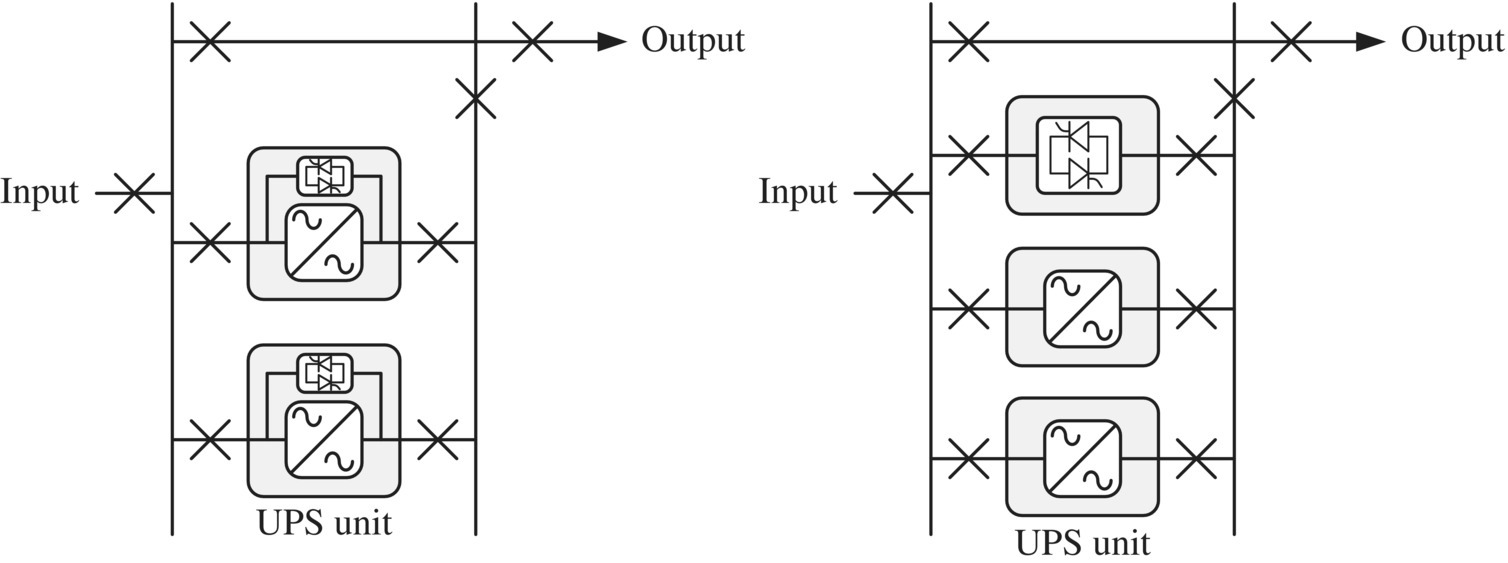
FIGURE 25.48 UPS unit static bypass switch alternatives.
Source: © Schneider Electric.
To optimize the best UPS system design, several parameters have to be considered as follows:
- The UPS size and modularity that should fit the data center load growth
- The reliability and availability performance of the UPS system according to the mean time to failure of a single unit, its ability to be fault tolerant, and the ability to be maintained quickly and without shutting down the UPS system
- The overall UPS system efficiency according to the UPS conversion mode and the efficiency performances from low load to full load conditions
- The compatibility of the UPS product with the specified battery technology
To select the best UPS product, the size of the UPS needs to fit the IT room specification. The scalability of the UPS system can be defined at different stages:
- The granularity can be set at the UPS system level, so that at each step of IT load, the data center owner will add a one or several UPS system.
- The granularity can be set at the UPS unit level, so that at each step of IT load, the data center owner will add a new UPS unit in the UPS system.
- The granularity can be set at the UPS power module unit level, so that at each step of IT load, the data center owner will add a new module in the UPS unit.
The reliability and the availability performance are functions of the UPS mean time to failure, the UPS system redundancy level, the UPS behavior in case of fault, and the way to repair or replace the failed element.
UPS units are exposed to internal failures such as:
- Power electronic component failures
- Control of power electronic failures
- Cooling fan failures
- Main control of the unit failures
- Other failures (insulation failure etc.)
A great part of the UPS failures affects only a single power module. Depending on the load factor, on the UPS system modularity, and on the UPS unit internal modularity, a failure can affect only one module, or only one UPS unit, or the whole UPS system. The general behavior can be summarized as follows:
- The failure affects only one UPS module or one UPS unit. The failed module or unit is shut down and automatically isolated from the rest of the UPS system. If the UPS system still has the capacity to supply the load, the UPS system will continue to work. Otherwise the UPS units will be switched to bypass static switches. To replace or repair the failed element, the operator would need to lock out the UPS unit using the input and output CB or only switch on static bypass to perform the maintenance operation.
- The failure affects the entire UPS system and will lead to a complete blackout.
In terms of power system energy efficiency, the UPS is a key element as it can lead to 10% losses for the worst solution. The energy efficiency performance of a UPS relies on the UPS unit design performance and the UPS ability to optimize the number of running units.
The three main UPS conversion modes give different performances in terms of output voltage quality and energy efficiency.
In double conversion mode as shown in Figure 25.49, both units are running in parallel in conversion mode: the power is going through the UPS rectifiers and inverters; the static bypass switches and the manual bypass switch are normally opened. The protection against input disturbances is maximal. In this mode, the voltage quality is guaranteed thanks to the inverter voltage control. The UPS input rectifier stage is classically designed to take an input current with very low harmonic distortion and a power factor close to 1 at full load.

FIGURE 25.49 UPS system in double conversion mode.
Source: © Schneider Electric.
The operating principle of the ECO (economical) mode, as shown in Figure 25.50, is that the power is going through the static switches. The UPS rectifiers and inverters are in standby, and the manual bypass switches are opened. If an input disturbance occurs, the UPS will open the static switches and switch on the UPS in double conversion mode or battery mode if the input voltage is out of tolerance.

FIGURE 25.50 UPS system in ECO mode.
Source: © Schneider Electric.
The main advantage of the ECO mode is the efficiency that can reach 99%. However, two main risks are existing with a UPS in ECO mode and need a detailed analysis to avoid any risk of blackout:
- The logic used to determine the input voltage status (to switch from bypass to conversion mode) needs to take into account all possible scenarios to avoid any situation where the voltage is not suitable for the loads and the UPS remains in standby mode.
- The time to switch to conversion mode (including the time to detect abnormal conditions, the time to switch off the static switch, and the time to switch on the inverter) has to be compatible with the voltage quality required by the loads.
The active filter mode principle is to use the static bypass to supply the load as in the ECO mode except the UPS output inverter is active and used as an active filter to compensate the downstream load current harmonics and reactive power. The active filter mode gives also the advantage to have a better response when the UPS needs to switch to battery mode in case of input disturbance. The active filter mode efficiency is closed to the efficiency of the ECO mode (Fig. 25.51).

FIGURE 25.51 UPS system in active filter mode.
Source: © Schneider Electric.
When designing a UPS system, the maximum input current will be needed when selecting the input LV CB of the UPS. A particular attention should be paid to the calculation of the maximum input current. The designer can choose to take the UPS maximum input current coming from the product data sheet that is given for the worst conditions (lowest input voltage, full load, highest charging rate), but sometimes it can lead to oversize the LV input switchboard. To avoid this oversizing, it is possible to calculate the maximum current according to the real worst conditions in the data center.
The battery system for a UPS consists of several battery strings connected in parallel, each string being composed of several battery module in series (Fig. 25.52).
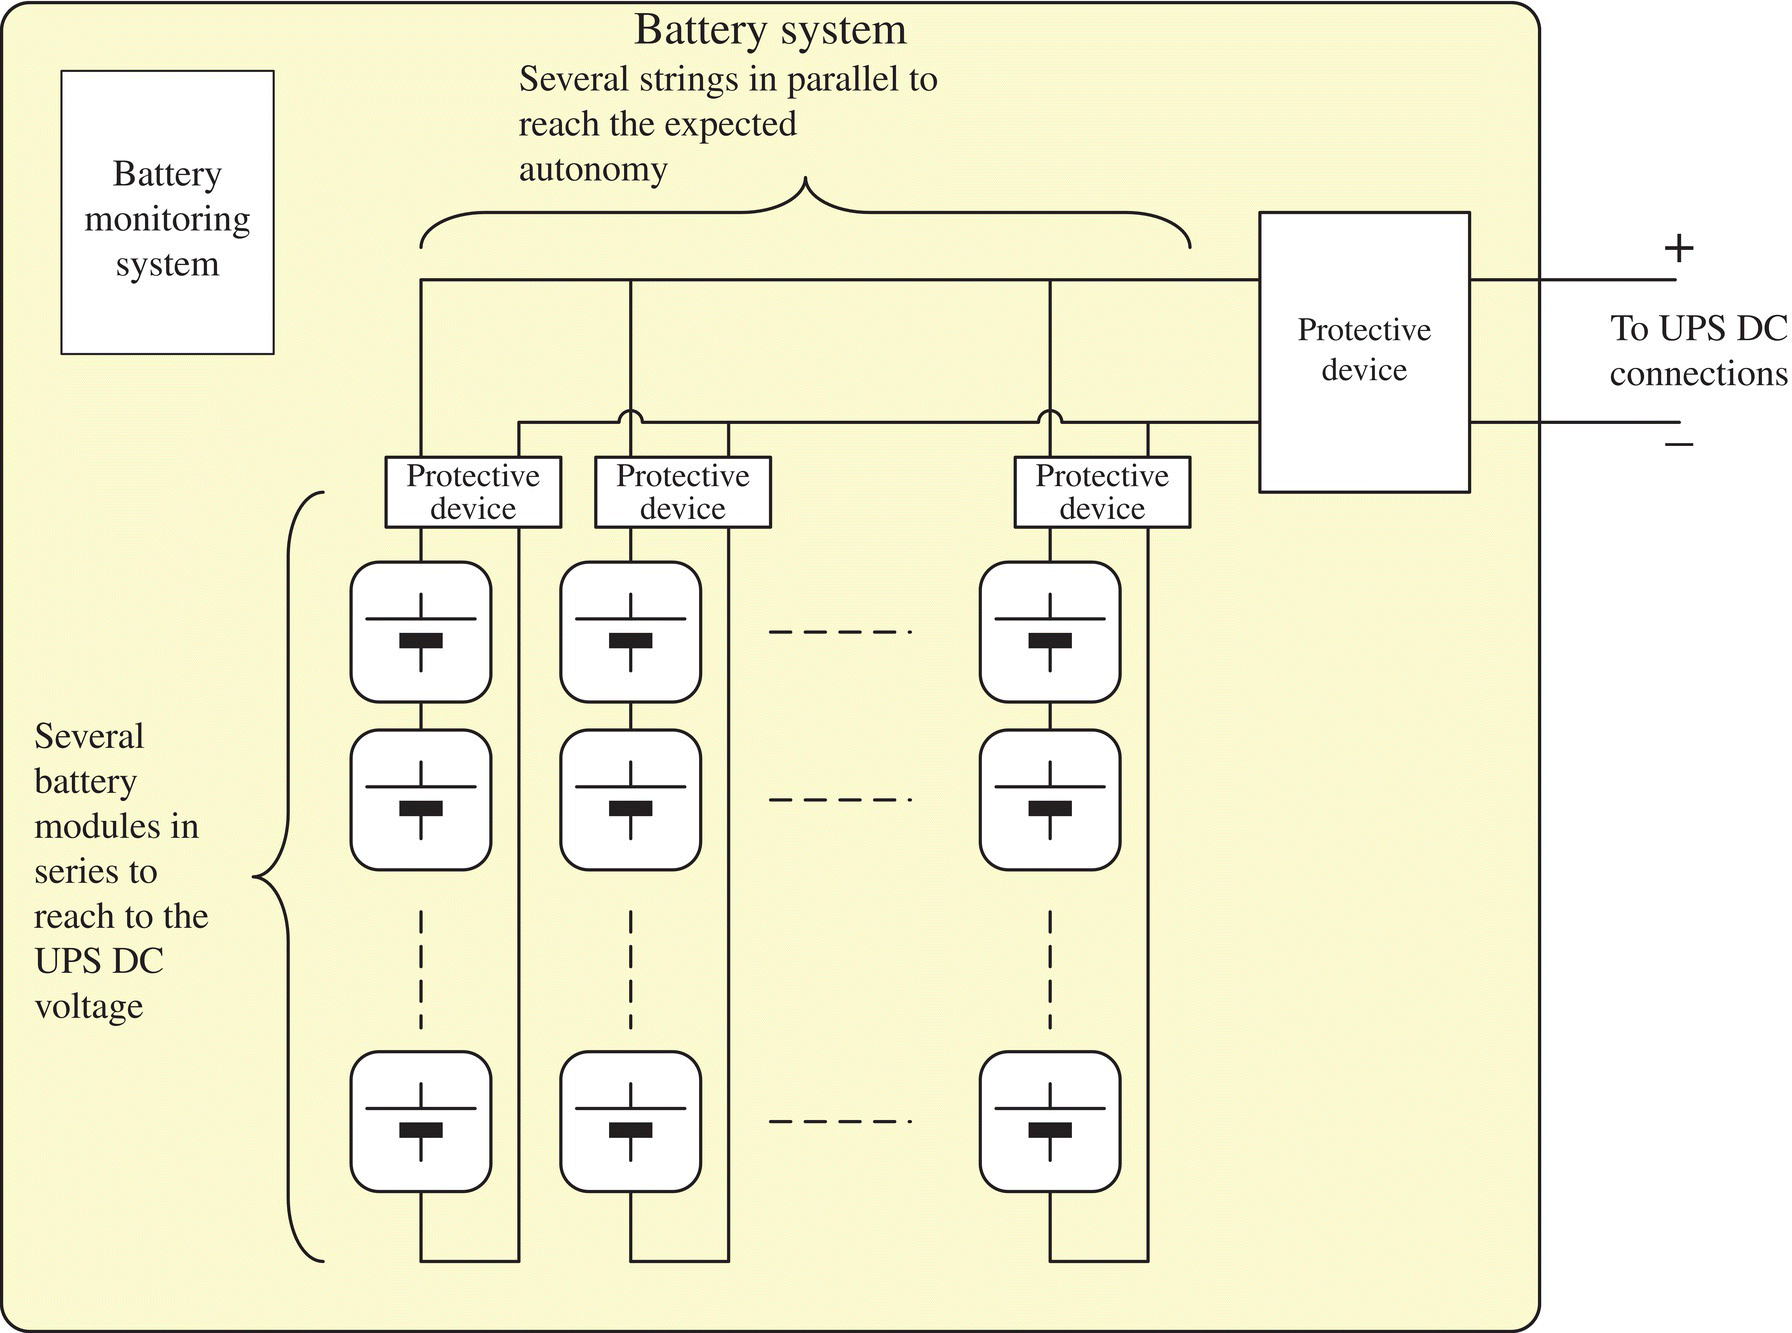
FIGURE 25.52 Battery assembly.
Source: © Schneider Electric.
The main steps for the battery system design are the following:
- Step 1 “Select the battery type”
- According to the CAPEX, the lifetime, the mission profile, and the installation constraints, the end user will select the best option to optimize the overall TCO.
- Nowadays, the two major battery technologies used for data center application are valve‐regulated lead–acid (VRLA) battery and lithium‐ion (Li‐ion) battery. For VRLA, it is the most popular reserve power design because the electrolyte is captive. There are two types of VRLA batteries: AGM (absorbent glass mat) in sulfuric acid and paste‐like gel cell. Lithium‐ion or li‐ion batteries are used for electronics, electric vehicles, or aerospace applications. Li‐ion batteries deliver more power but use less space than VRLA. Although Li‐ion batteries have a higher cost, but there are several benefits over VRLA batteries. A Li‐ion battery has longer service life, it requires less cooling due to it can withstand at higher temperature range.
- Step 2 “Size the battery strings”
- The number of battery in series will be set to match the UPS battery bus voltage range.
- The number of battery string in parallel is set to match the required load power and autonomy according to the battery data sheet; a derating can be applied to the battery maximum power if the autonomy is specified as the battery end of life.
- Step 3 “Select the conductors and the protection devices”
- Calculate the maximum discharging current, the maximum and minimum short‐circuit current for both states “full charged” an “discharged.”
- Select the conductors and the protection devices; for VRLA batteries, the protection of the battery system is better when using a CB per string.
- Step 4 “Implement the battery system”
- The battery modules are installed and wired in a battery cabinet or a battery shelf.
- Lithium‐ion batteries are typically designed with a monitoring system that includes protection functions and battery healthy state monitoring; for VRLA battery an optional monitoring system can be added; the UPS unit can also provide a basic battery health monitoring using the voltage and current measurements and a discharge test.
- The battery system is typically installed in a separate room with room cooling and other functions to mitigate safety risk such as the room ventilation and/or a fire detection system depending on the selected battery technology.
The UPS load bank can be an option to test the UPS at full load during the commissioning phase. However, the use of the UPS load bank during the operation phase can be discussed because some UPS units can be equipped with some test function able to test both the battery system and the UPS unit at full load. Such simplification can provide a significant cost savings on the LV power architecture as it can avoid two main CB on each main LV switchboard and the load bank busway.
25.4.5.6 Static Transfer Switch
Typically based on the thyristor technology, the STS control unit uses a fast undervoltage logic to be able to make a changeover in less than few milliseconds so that the downstream loads experience no interruption.
The STS base current range goes from 30 to 1,600 A so that it can be used at rack level or just downstream the main LV switchboard. When using the STS in four‐wire system, the STS must be able to switch the phases and the neutral.
The key features of an STS are:
- The maximum rated voltage (typically 440 V maximum) and rated current (range from 30 to 1,600 A);
- The maximum short circuits at the inputs that can vary from few kA rms to 50 kA rms;
- The STS thyristor short‐circuit withstand;
- The number switching poles (three or four poles);
- The option of neutral overlapping to minimize the overvoltage risks and nuisance tripping in TNS earthing system;
- The short time transfer that can vary from 3 to 15 ms;
- The optional bypass switch to perform the regular maintenance operation while keeping the output alive;
- The option to make a changeover while minimizing the inrush current of the downstream LV/LV isolation transformer;
- The internal redundancies in the unit to provide the best product reliability level such as the redundancy on the power supply, on the cooling fans, and the SCR drivers and/or on the control unit;
- Its behavior in case of downstream short circuit (option to not make a changeover when a downstream short circuit is detected);
- Its compartmentalization between the A and B incomers to avoid a simultaneous fault on both A and B incomers.
When the STS is used in a block redundant architecture, a detailed analysis should investigate all the possible fault scenarios including the STS short‐circuit withstand capabilities compared with the energy limited by the upstream of downstream CB of the STS, the common mode failure between A and B incomers in the STS cabinet, and the STS automation behaviors (Fig. 25.53).

FIGURE 25.53 STS architectures.
Source: © Schneider Electric.
25.4.5.7 LV Protections
LV Protection Discrimination with Static UPS
In case of a short circuit downstream the UPS, the UPS behavior depends on the UPS product options and settings:
- The UPS can supply the short circuit through the inverter with a current limitation, and after a time delay if the fault is not cleared, the UPS will shut down.
- The UPS can also be set to switch instantaneously on the static bypass and supply the short circuit through the static bypass switch without any current limitation and get back to normal operation when the fault is cleared (Fig. 25.54).
When supplying a fault through its inverter, the UPS limits its output current due to the thermal constraints on the inverter IGBTs. This current limitation is done by the inverter current control loop and can be a fixed value during a period of time or a current/time curve as shown in Figure 25.55. Depending on each UPS product, the maximum current limitation can go typically from 1.5 to 3 times the rated current.

FIGURE 25.54 UPS behavior in case of downstream short circuit.
Source: © Schneider Electric.

FIGURE 25.55 Example of an output short‐circuit current curve of a UPS.
Source: © Schneider Electric.
When taking the example of a typical UPS architecture as shown in the Figure 25.56 with several units in parallel, the different fault scenarios that can be studied could be a fault downstream the UPS, a fault in the UPS input (in the UPS rectifier), a fault in the UPS output (in the UPS inverter), or a fault on the UPS output bus.
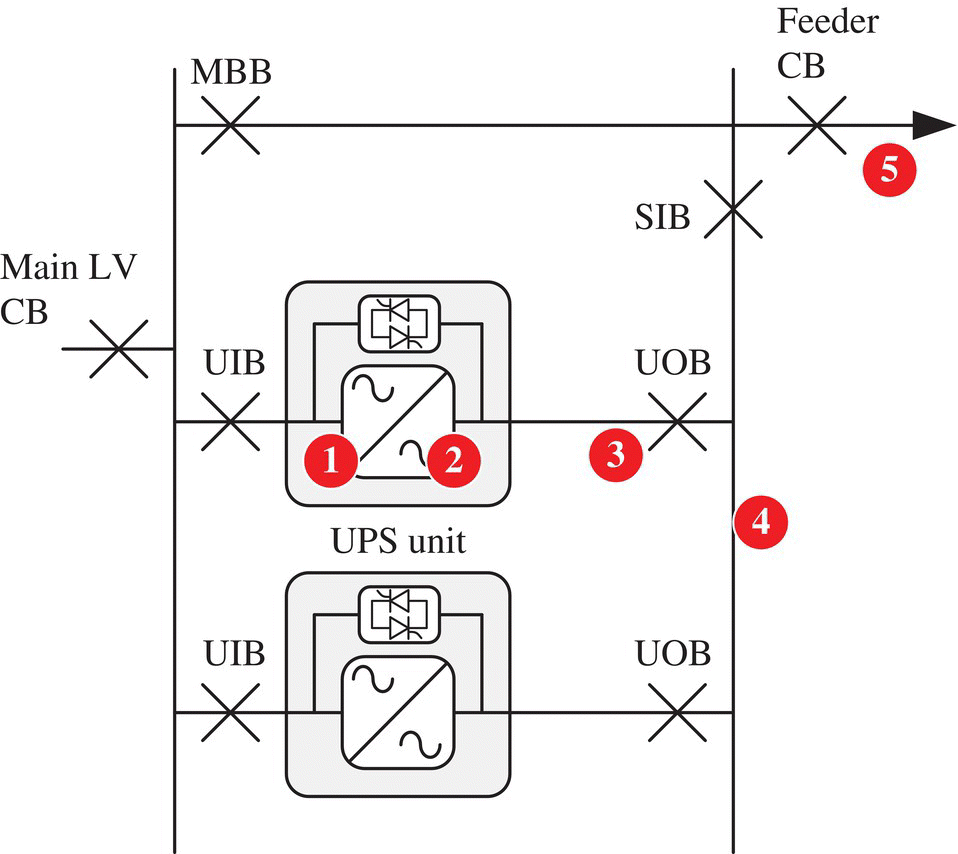
FIGURE 25.56 UPS fault scenarios.
Source: © Schneider Electric.
The fault analysis depends on the fault current flows, on the static switch current withstand, on the UPS behavior, and on the protection settings. Whatever, the full discrimination between the CB downstream the UPS and the CB upstream cannot be totally because of the multiple branches in parallel. However, the most important is to achieve a full selectivity for the most frequent fault scenarios such as:
- Scenario 1: The fault should be cleared by the rectifier input fuses or at least the UPS input CB, so that the main LV CB remains closed and the other UPS units remain alive.
- Scenario 2: The fault should be cleared by the UPS inverter output fuses so that the other UPS units remain alive without any damage of the UPS static switches.
- Scenario 3: The fault should be cleared by the feeder CB without any damage of the UPS static switches.
LV Protection Discrimination Versus Switchboard Safety
When achieving the discrimination between several air CB (such as the main LV CB, UIB, UOB, SIB), the basic way is to disable the instantaneous trip function and to make time‐graded discrimination. However, it will increase the delay and the current threshold of the overcurrent protection of the main LV CB and could lead to lower protection level of the main LV switchboard (Fig. 25.57).
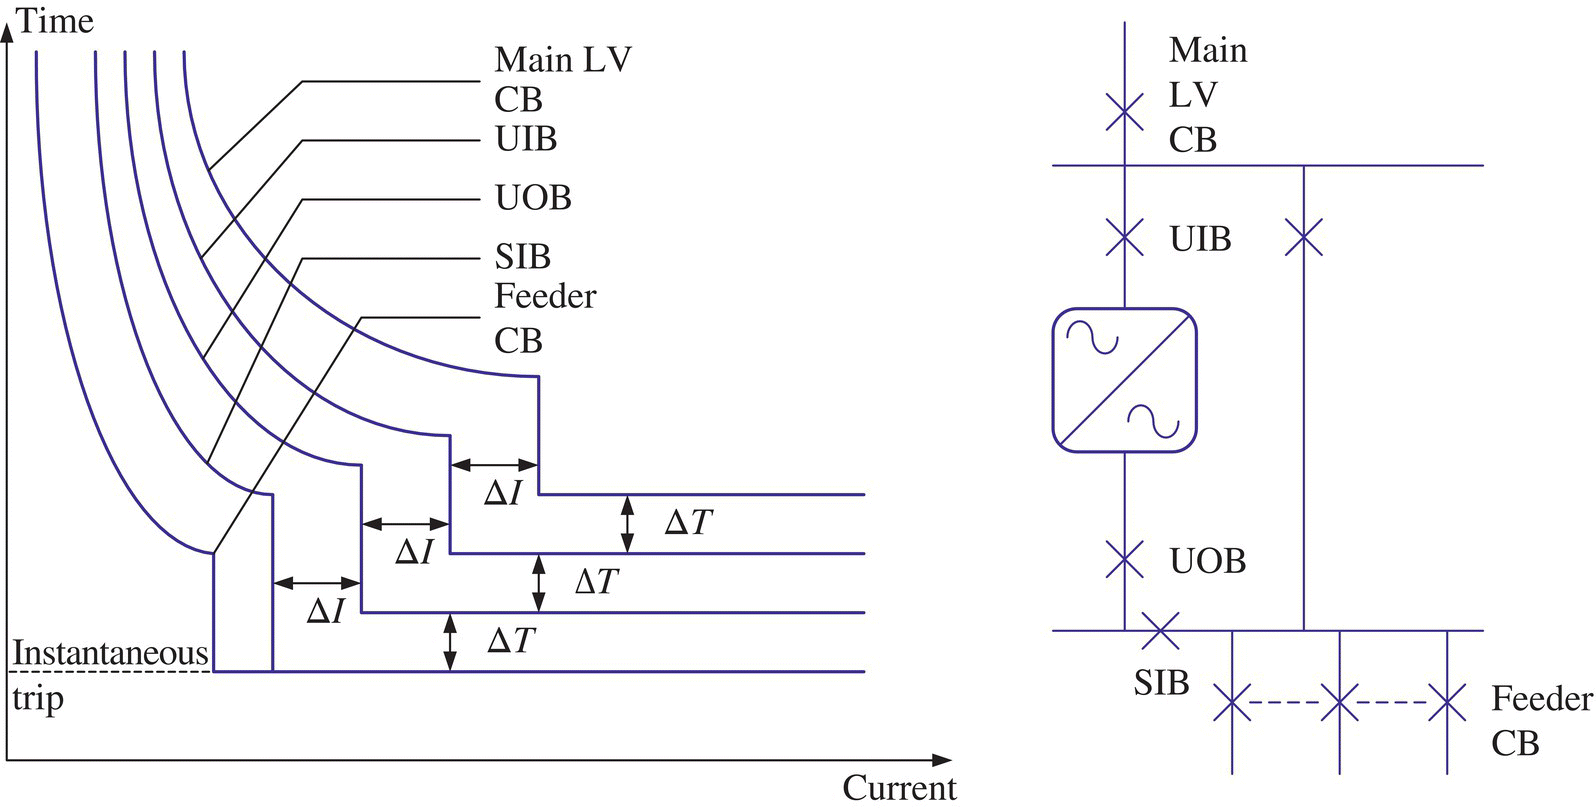
FIGURE 25.57 Time‐graded selectivity between LV ACB.
Source: © Schneider Electric.
In this case, using logic discrimination or arc fault detection device permits to keep a fast tripping in case of an internal arc in the main LV switchboard and keep a high level of safety.
Optimize the LV Architecture Using the Circuit Breaker Limiting Effect
MCB and MCCB have short‐circuit limiting effect thanks to their fast opening of their contacts in less than half a cycle. The arc voltage between the CB pole limits the short‐circuit current peak and the let‐through energy as shown in the Figure 25.58.
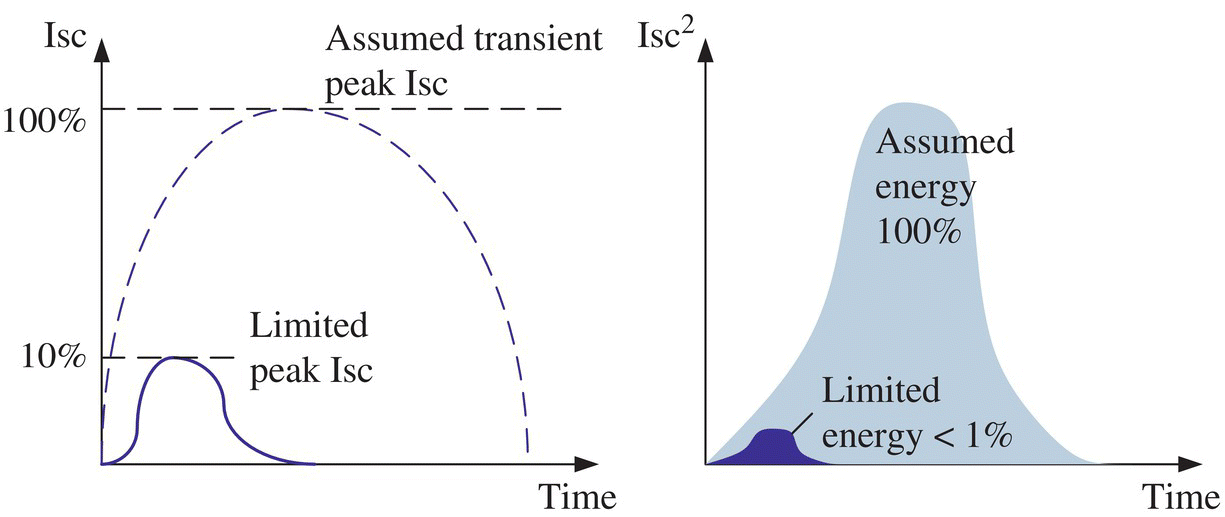
FIGURE 25.58 Limiting capacity of LV circuit breaker.
Source: © Schneider Electric.
The CB limitation capacity limits the mechanical and the thermal stress induced by a short circuit. Using a coordination between the CB and the downstream equipment, the short circuit withstand of the equipment can be reduced. This coordination can be applied for products such as UPS, STS, LV panels, and busways.
Another advantage of the limitation capacity is the LV cascading where the upstream CB helps the downstream CB to open and clear the fault. Cascading provides circuit breakers placed downstream of a limiting circuit breaker with an enhanced breaking capacity. Cascading makes it possible to use a circuit breaker with a breaking capacity lower than the prospective short‐circuit current calculated at its installation point. Using the cascading tables of LV CB manufacturers, the designer can optimize the cost of the LV CBs. It is also important to keep in mind that the full selectivity can be combined with cascading, also called as “selectivity enhanced by cascading.”
25.4.5.8 LV Power Monitoring System
The monitoring at LV level includes the monitoring of the status of the switches and CB, the status of the trip units and the PLCs, and the voltage presence indicators. The equipment monitored are the main LV switchboards, the UPS units, and the final distribution to the racks such as the busways and/or the PDU or the remote power panels (RPP).
Some metering equipment are also classically located:
- At the incomer of the main LV switchboards to provide energy metering and power quality monitoring (voltage and current harmonics, voltage sags);
- At the UPS output bus to power quality monitoring;
- On the row busway feeder CBs to provide energy metering;
- On each rack feeder CBs to provide energy metering (for colocation application mainly).
It is important to define the right precision class needed of all the measurements to avoid any useless over costs. As an example, the metering function can be achieved by the CB trip unit, but if a high‐class metering is specified on several locations of a main LV switchboard, the LV switchboard would be bigger to accommodate the current sensors. It becomes more expensive because more space will be required as well as material and labor to install more cabling.
25.4.6 Overall Design Optimization
When designing the data center infrastructure, the first key point for optimization is the scope that needed to take into account both electrical and cooling system and the right estimation of maximum power for the IT loads and for the cooling equipment consumptions.
25.4.6.1 Optimization Using Reliability Studies
The power system reliability and availability performance highly depend on the overall architecture that is composed not only of the power distribution equipment but also of the protection, control and monitoring systems, and of the maintenance for planned activities. The designers need to take decision such as:
- Choose the right level of redundancy on the grid connection substation, the generator power plant, and the MV/LV electrical distribution.
- Choose the right level of redundancy for the critical auxiliary supplies of the HV/MV substation, the generators, and the MV equipment and the LV equipment and check it does not lead any single point of failure.
- Use manual transfer equipment to keep running the maximum equipment during the planned shutdown of a device or a group of devices.
- Set the adequate tests on generators, UPS, STS, and switchboard protections and automation to be able to maintain the system in a perfect health.
A system reliability assessment can evaluate the impact of different design options on the system reliability performance. A system reliability analysis basics are to study the consequences of component failures on the system based on the knowledge of the equipment failures and the system behaviors in case of failures.
For a detailed analysis, the data needed to perform a dysfunctional analysis include the equipment specifications, the system architecture, a description of the operating modes and degraded modes, a description of the automation and protection behaviors, the layouts, the equipment reliability data (failure modes and failure frequency), the equipment planned and unplanned maintenance data, and the on‐site maintenance.
By analyzing all possible failure sequences (single contingency and multiple contingencies if needed), the reliability analysis estimates the mean occurrence frequency and the probability of undesirable events such as “the loss of one IT rack,” the loss of one row,” “the loss of an IT room,” or “the loss of the whole data center.” From these results, the system weak points can be identified and give some starting points to the designers to upgrade the system.
25.4.6.2 Optimizing the Reliability and Availability During the Data Center Operation
During data center operation, the main tasks to ensure the reliability performances of the system is to manage the planned maintenance activities and to ensure the required time to react in case of failure.
The planned maintenance activities need to be defined according to the manufacturer recommendations and also fine‐tuned according to the site conditions. An example of planned operations mentioned is given in Table 25.6.
TABLE 25.6 Example of planned operations for a data center site
Source: © Schneider Electric.
| Equipment | Preventive maintenance operation | Period |
|---|---|---|
| HV line incomers | Incomer locked out for HV bushing cleaning | 6 months |
| HV GIS section | Inspection | 6 months |
| Controls and verification | 6–12 years | |
| HV GIS circuit breaker | Inspection | 1–6 months |
| Opening/closing | 6 months | |
| Controls | 3 years | |
| Verification and revision | 12 years | |
| HV GIS disconnector | Inspection | 6 months |
| Opening/closing | 1 year | |
| Controls | 3 years | |
| Verification | 12 years | |
| HV/MV transformers | Cleaning and control of transformer neutral point impedance | 6 months |
| Controls | 3 years | |
| Verification and oil analysis | 6 years | |
| Revision | 12 years | |
| HV protections | Protection test | 1 year |
| HV auxiliaries | Inspection | 6 months |
| Battery charger capacity test Verification of LV protection |
1 year | |
| MV switchboard | Opening/closing | 1 year |
| Switchgear visual inspection, cleaning, MV protection relay test | 3 years | |
| Switchboard visual inspection, cleaning | 3 years | |
| MV/LV dry transformer | Connection verification and cleaning | 1 or 3 years |
| Generator unit | Inspection and checks (coolant heater, coolant level, oil level, fuel level, charge‐air piping) | 1 day |
| Check/clean air cleaner, check battery charger, drain fuel filter, drain water from fuel tank | 1 week | |
| Check coolant concentration, drive belt tension, starting batteries Drain exhaust condensate |
1 month | |
| Change oil and filter, change coolant filter, clean crankcase breather, change air cleaner element, check radiator hoses, change fuel filters | 6 months | |
| Clean cooling system | 1 year | |
| Off‐load test | 1 week to 1 month | |
| On‐load test with the load bank | 1 onth | |
| Generator power plant | On‐load test with MV failure simulation | 1 month to 1 year |
| LV switchboard | Opening/closing | 1 year |
| CB checks, protection relays tests | 3 years | |
| Switchboard visual inspection, cleaning, connection checks | 6 years | |
| UPS | Visual inspection and cleaning | 1 year |
| DC capacitors and fans replacement | 5 years | |
| Power supply board replacement | 7 years | |
| Filter replacement | 10 years | |
| UPS | Visual inspection and cleaning | 1 year |
| DC capacitor and fan replacement | 5 years | |
| Power supply board replacement | 7 years | |
| Filter replacement | 10 years | |
| On‐load test | 1 year | |
| Batteries | Visual checks | 1 week |
| Connection checks | 1 year | |
| Replacement | 5 or 10 years | |
| Busways | Visual inspection and thermography | 1 year |
When a failure occurs, the time to fix the issue will depend on several steps:
- The detection of the failure by the monitoring system that monitors basically the status of the power system equipment (status, voltage and current measurements, room temperature, etc.); a particular attention should be paid to the critical equipment to be able to detect any “hidden” failure and maintain the critical equipment functions ready to operate when required; the monitoring system can also include premium functions such as energy, harmonics, wave captures, equipment temperature, and specific services such as predictive maintenance based on the diagnostic‐based detailed monitoring data.
- The site maintenance team will perform manual operations such as manual power system reconfiguration, manual restart, and lock out failed equipment; to ensure a high skill of the site maintenance teams, the site maintenance operators need to be trained on these emergency operations using if needed specific procedures.
- The failure diagnostic, the equipment spare delivery time, and the manufacturer maintenance contracts for critical equipment to guarantee the intervention time and the equipment spare availability.
25.4.6.3 TCO Optimization
The best approach is to optimize the overall architecture from the grid substation down to the loads and to consider the TCO including the CAPEX and OPEX (losses and maintenance cost).
The following good practice can help to optimize the power system architecture:
- Specify the IT room architecture to match the best electrical ratings.
- Use low loss equipment such as Ecodesign transformers, low loss UPS products, and low loss server PSU.
- Minimize the LV cable length.
- Choose the best MV voltage level and try to avoid any MV/MV transformers.
- Try to avoid any LV/LV transformers.
- Avoid very high short‐circuit current rating at MV level and at LV level to keep cost‐efficient equipment ranges.
- Opportunity to provide grid services with UPS and/or generators.
25.5 FACEBOOK, INC. ELECTRICAL DESIGN
These electrical topologies are not mutually exclusive; the key is to design a data center that satisfies business needs. Facebook designed a data center that merges these topologies (Fig. 25.59), resulting in a solution satisfying their requirements. The data center comprises a mix of 208 and 277 V equipment as well as single‐ and dual‐corded servers.
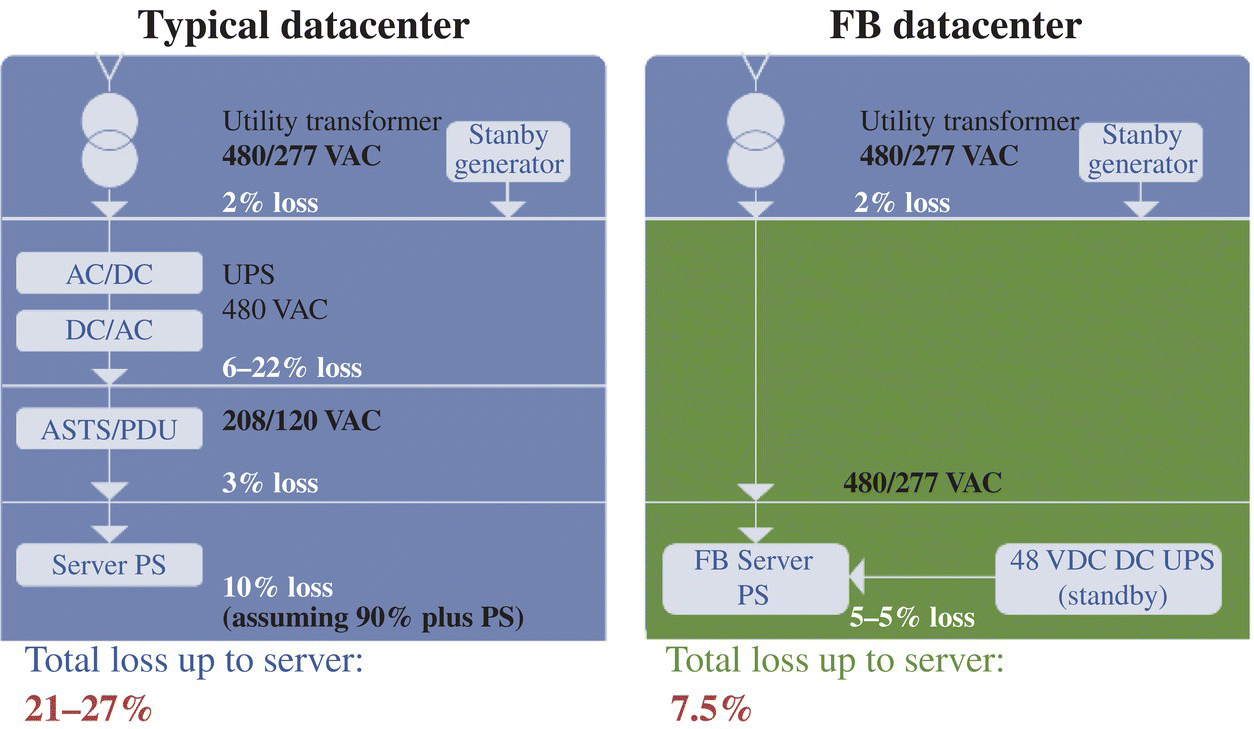
FIGURE 25.59 Typical vs. Facebook electrical topologies.
Source: © Facebook.
The Facebook data center design team developed a revolutionary design that does not require a centralized UPS, significantly reducing losses. In this design, power flows from the utility, connecting directly to the 277 V server; battery backup cabinets are connected to the servers delivering DC power in case of an outage.
Overall, the Facebook data center follows the block redundant configuration with a reserve bus that provides power to one of the six independent systems if a failure occurs.
Figures 25.60 and 25.61 illustrate a typical Facebook‐designed suite. 277 V power is distributed to the Facebook OCP servers.

FIGURE 25.60 Facebook data center suite.
Source: © Facebook.
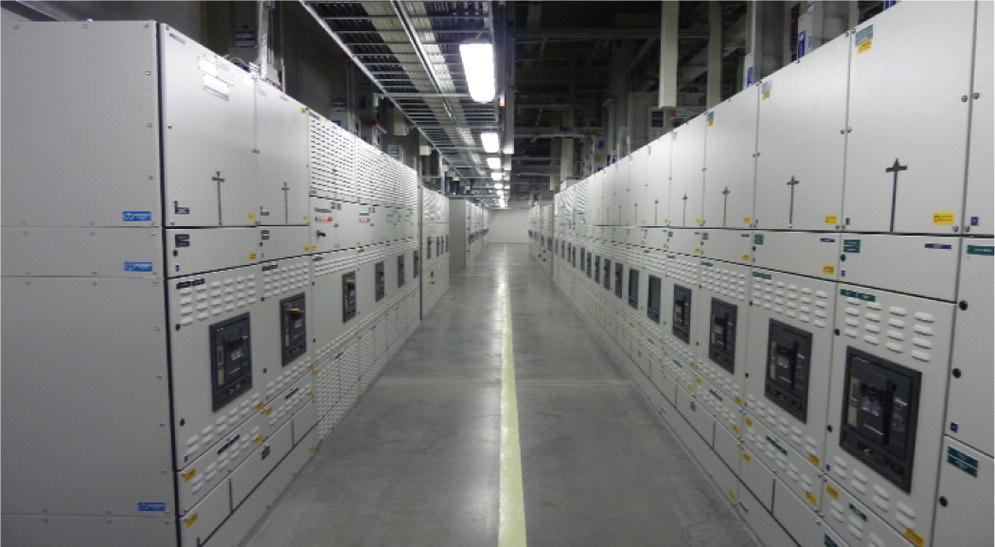
FIGURE 25.61 Electrical room at Facebook data center.
Source: © Facebook.
Since there isn't a centralized UPS, the DC UPS battery cabinet, in Figure 25.62, distributes power to the servers when failures occur.

FIGURE 25.62 Facebook DC UPS battery cabinet.
Source: © Facebook.
Figure 25.63 is a diagram that goes into depth about the power configuration of a typical DC UPS battery cabinets and 277 V server.
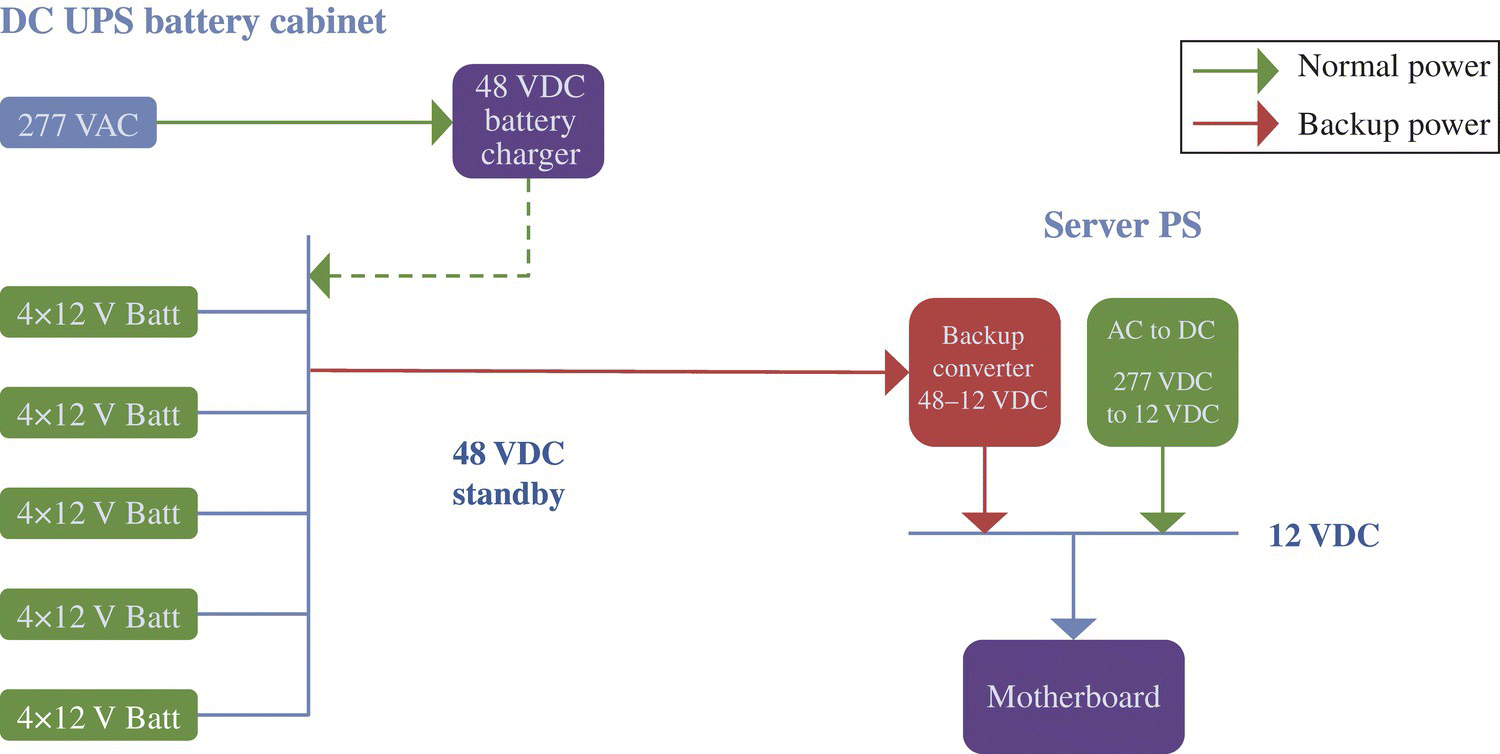
FIGURE 25.63 DC UPS backup scheme.
Source: © Facebook.
FURTHER READING
- Cabau E. Introduction à la Sûreté de Fonctionnement. Cahier technique Schneider Electric, nr 144. Grenoble: Schneider Electric; June 1999
- Gatine G. High Availability Electrical Power Distribution. Schneider Electric, nr 148. Grenoble: Schneider Electric; 1990. Available at https://download.schneider‐electric.com/files?p_enDocType=Cahier+Technique&p_File_Name=ECT148.pdf&p_Doc_Ref=ECT148. Accessed on August 24, 2020.
- Logiaco S. Electrical Installation Dependability Studies. Cahier technique Schneider Electric, nr 184. Grenoble: Schneider Electric; December 1996
- Merlin Gerin. Protection Guide (Electrical Network Protection). Schneider Electric; April 2006. Available at https://download.schneider‐electric.com/files?p_enDocType=Catalog+Page&p_File_Name=CG0021EN+%28web%29.pdf&p_Doc_Ref=CG0021EN. Accessed on August 24, 2020.
- Mitchell B. How to choose IT rack power distribution. White Paper 202, Schneider Electric; 2015. Available at https://download.schneider‐electric.com/files?p_File_Name=VAVR‐9G4N7C_R0_EN.pdf&p_Doc_Ref=SPD_VAVR‐9G4N7C_EN&p_enDocType=White%20Paper. Accessed on August 24, 2020.
- Rasmussen N. Avoiding costs from oversizing data center and network room infrastructure. White Paper 37, Rev. 7, Schneider Electric; 2012. Available at https://download.schneider‐electric.com/files?p_File_Name=SADE‐5TNNEP_R7_EN.pdf&p_Doc_Ref=SPD_SADE‐5TNNEP_EN&p_enDocType=White%20Paper. Accessed on August 24, 2020.
- Rasmussen N., Torell W. Data center projects: establishing a floor plan. White Paper 144, Rev. 2, Schneider Electric; 2015. Available at https://download.schneider‐electric.com/files?p_File_Name=VAVR‐6KYMZ7_R2_EN.pdf&p_Doc_Ref=SPD_VAVR‐6KYMZ7_EN&p_enDocType=White%20Paper. Accessed on August 24, 2020.
- Schneider Electric. Low voltage expert guides no. 5: Coordination of LV protection devices; June 2009. Available at https://download.schneider‐electric.com/files?p_enDocType=Technical+leaflet&p_File_Id=9601264025&p_File_Name=DBTP107GUI_EN+%28web%29.pdf&p_Reference=DBTP107GUI_EN. Accessed on August 24, 2020.
