

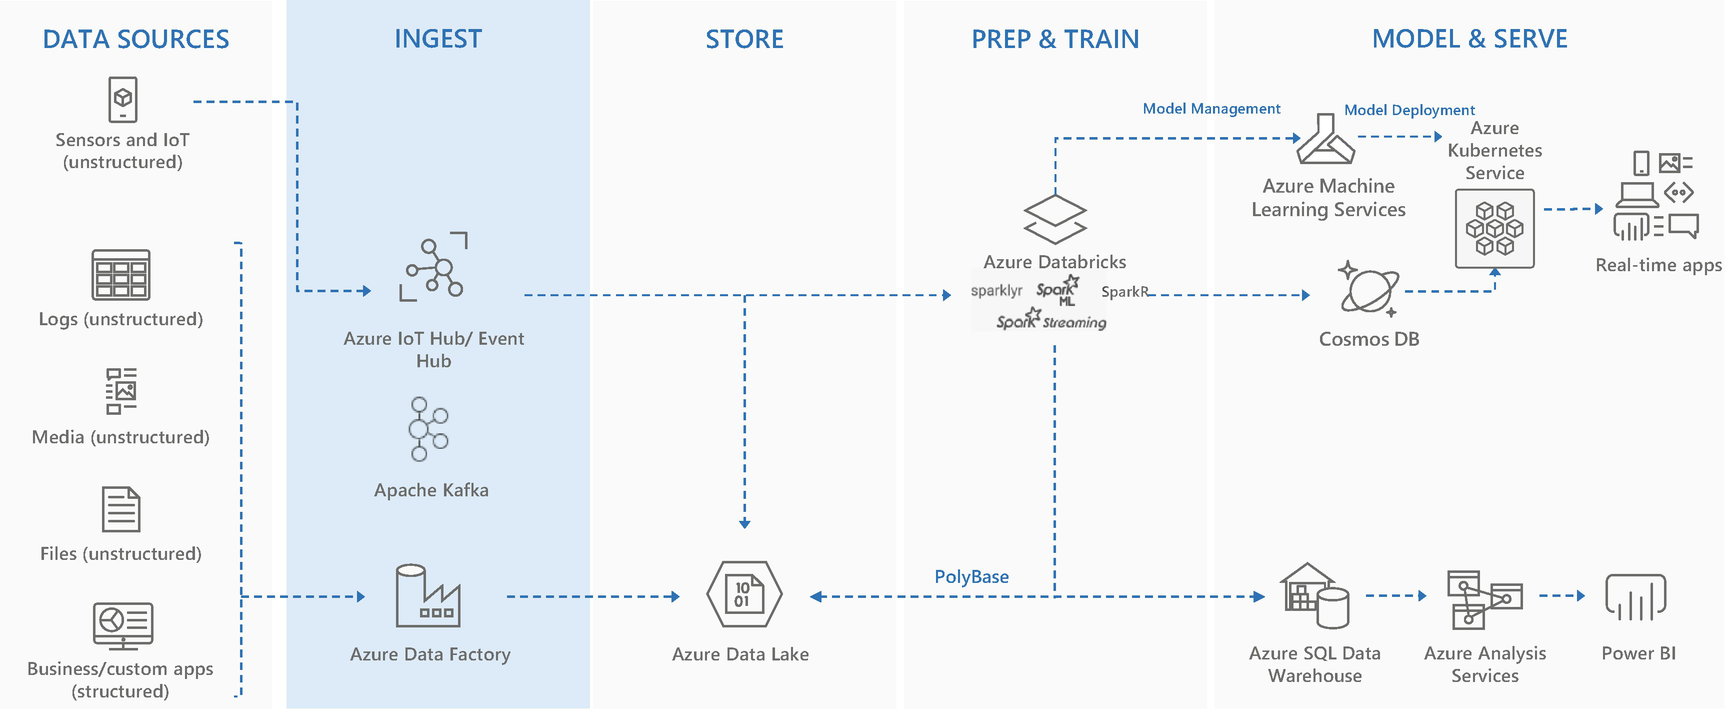
Data ingestion layer
Data Ingestion

Data ingestion phase
- 1.
Real-time mode
- 2.
Batch mode
The journey of data in the data analytics solutions depends on the incoming mode of data. Moreover, the technology stack for both real-time and batch mode is completely different.
Real-time mode
Real-time data comes from the data source(s) like IoT sensors, streaming applications like clickstream, social media, etc. The typical real-time analytics scenarios built on this data are social media analytics, vehicle maintenance alerts, generating SOS alerts for passengers, or generating alarms depending on the temperature in scenarios like mining and oil exploration, etc. Generally, in these scenarios data is not only processed in real time, but it’s also stored in the data storage layer to perform batch processing. This helps to extract information like trends and volumetric data, and generate feedback to improve the system and improve ML models’ accuracy, etc.
For real-time data ingestion, since the velocity of incoming data will be high, the solution should have a queuing mechanism to avoid losing any of the event data. Moreover, it should have the capability of connecting to millions of devices at the same time, scale infinitely to handle the load, and process the data in real-time. These factors can enable the solution to have the capabilities to perform real-time operations (e.g, in oil exploration or mining scenarios, if the alert of a specific parameter like rise in temperature or some leakage is reported in real time, it can help to avert accidents). These are scenarios where any delay is not affordable; otherwise the solution will lose its purpose.
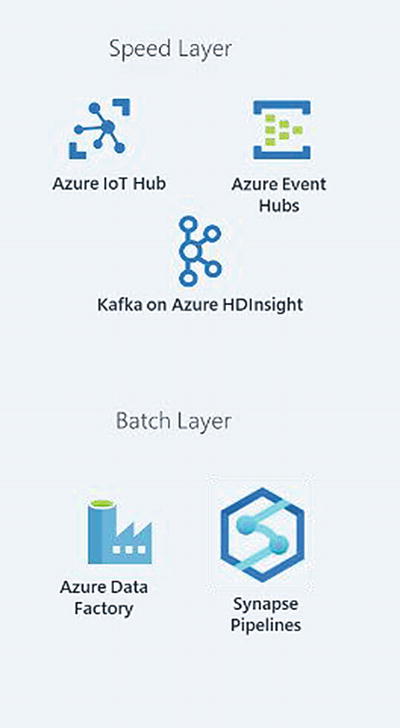
Data ingestion technologies
- 1.
Apache Kafka on HDInsight Cluster
- 2.
Azure Event Hub
- 3.
Azure IoT Hub
There are various advantages to using PaaS services on Azure. Their setup/installation, high availability, monitoring, version upgrades, security patches, and scalability are managed by Microsoft. Every service has multiple tiers and SLAs. An appropriate tier can be chosen, depending on the performance and availability requirement.
Before getting into the details of these services, let’s briefly discuss minute yet important concepts of events and messages. These are commonly used terms and their meaning and applicability is summarized in Table 4-1.
Events – Events are lightweight notifications of a condition or a state change. The publisher of these events has no expectation about how the event should be handled. However, the consumer of the event decides how this even should be consumed. Events are of two types: discrete and continuous series of values.
Discrete events – These events report state change. The consumer of the event only needs to know that something happened. For example, an event notifies consumers that an order was placed. It may have general information about the order, but it may not have details of the order. The consumer may just need to send an email to the customer with confirmation of the order placed. Discrete events are ideal for serverless solutions that need to scale.
Series events – These events report conditions that are time-ordered and interrelated. The consumers of these events need the sequenced series of events to analyze what happened. This generally refers to scenarios of data coming from telemetry from IoT devices or distributed streams of data from social media applications.
Comparison Table for Events and Messages
Service | Purpose | Type | When to use |
|---|---|---|---|
Event Grid | Reactive programming | Event distribution (discrete) | React to status changes |
Event Hubs/ Apache Kafka/ IoT Hub, etc. | Big data pipeline | Event streaming (series) | Telemetry and distributed data streaming |
Service bus | High-value enterprise messaging | Message | Order processing and financial transactions |
In this chapter, the focus is on data coming from telemetry or distributed data streams, and that falls under the series events category. Now, let’s discuss real-time data ingestion services in the next section.
Apache Kafka on HDInsight Cluster
Apache Kafka is one of the most popular solutions for ingesting streaming data. However, not only ingesting streaming data but integrating multiple disparate applications within the organization can also be done through Apache Kafka. In short, anything to do with events and messages can be managed with Apache Kafka—for example, collecting application logs, activity tracking, and gathering data from websites or data from millions of IoT devices.
To cater to the requirement for processing real-time data, this solution is highly efficient, and it can process millions of messages per second. In fact, this platform was built by LinkedIn for purposes like improving user experience or analytics like page views, which content was popular, or recommendation engines. This platform was later donated to the open source community. There are many large companies like Netflix, Twitter, Airbnb, Uber, etc. that use this solution.
- 1.
Producer
- 2.
Consumer
- 3.
Broker
- 4.
Topic
- 5.
ZooKeeper
Producer – The producer is the source that produces the message. The producer can be a website generating streams of clickstream data or a fleet truck sharing its location or any IoT sensors producing data streams. The producer just connects to a broker and sends the event without worrying about how it will be processed.
Broker – The broker is the server that is part of the Kafka cluster. In other words, a collection of brokers forms a Kafka cluster. Its primary role is to pick up the event from the producer and deliver it to the consumers. Kafka brokers work in leader and worker topology, and there is at least one leader and two in-sync replicas. When an Apache Kafka on HDInsight cluster is built, there are by default two master nodes where the Hadoop ecosystem runs and three mandatory worker nodes (broker nodes) that perform the task.
Topic – The topic, like a table in RDBMS, is where the stream of data is written inside apache Kafka brokers. Topics are further divided into partitions, and each message in the partition will be assigned an offset. Offset in a partition becomes the pointer for a consumer to read and process the data.
ZooKeeper – ZooKeeper is another component in Apache Kafka, which manages all the brokers starting from replication, availability, and fault tolerance, etc. ZooKeeper has separate servers to manage the Apache Kafka ecosystem; it also needs an odd number of servers, with a minimum of three. Kafka can’t run without ZooKeeper. ZooKeeper even works in leader and follower mode, where at least one node will act as a leader and at least two will be followers.
Consumer – The consumer is the destination application that processes the event data. In the case of real-time analytics, the same event can be consumed by multiple consumers. In the case of Lambda architecture, when both real-time and batch mode processing is needed, the same event is both passed to stream processing services like Azure Stream analytics, Apache Storm and Spark streaming, etc. and written to Azure Data Lake or Blob storage at the same time for processing later.
Now that we have built some background on Apache Kafka, let’s discuss a little bit about how to set up an Apache Kafka on HDInsight cluster. Since detailed documentation is already available on the Microsoft website, we will discuss it on a very basic level.
- 1.
First, open the Azure portal with the link – https://portal.azure.com. Click “create resource” and search for Resource group.
- 2.
Create a resource group and this will hold all the resources for the data analytics solution. All the technology solutions in ingestion, store, prep and train, and model and serve will reside in this resource group.
- 3.
Similarly, create a virtual network, which will host all the resources mentioned in the preceding point.
- 4.After the resource group and virtual network are created, click “create a resource” to create an HDInsight cluster and enter the details as seen in Figure 4-4.
 Figure 4-4
Create HDInsight cluster
- 5.
Enter the required details; select Kafka from the options on the right side and select the Kafka version (2.1.0 is the latest version available).
- 6.
Enter the password and click “Next Storage,” security, and networking details.
- 7.Following screen (Figure 4-5) is little critical to understand; there is where we need to know the sizing of infrastructure:
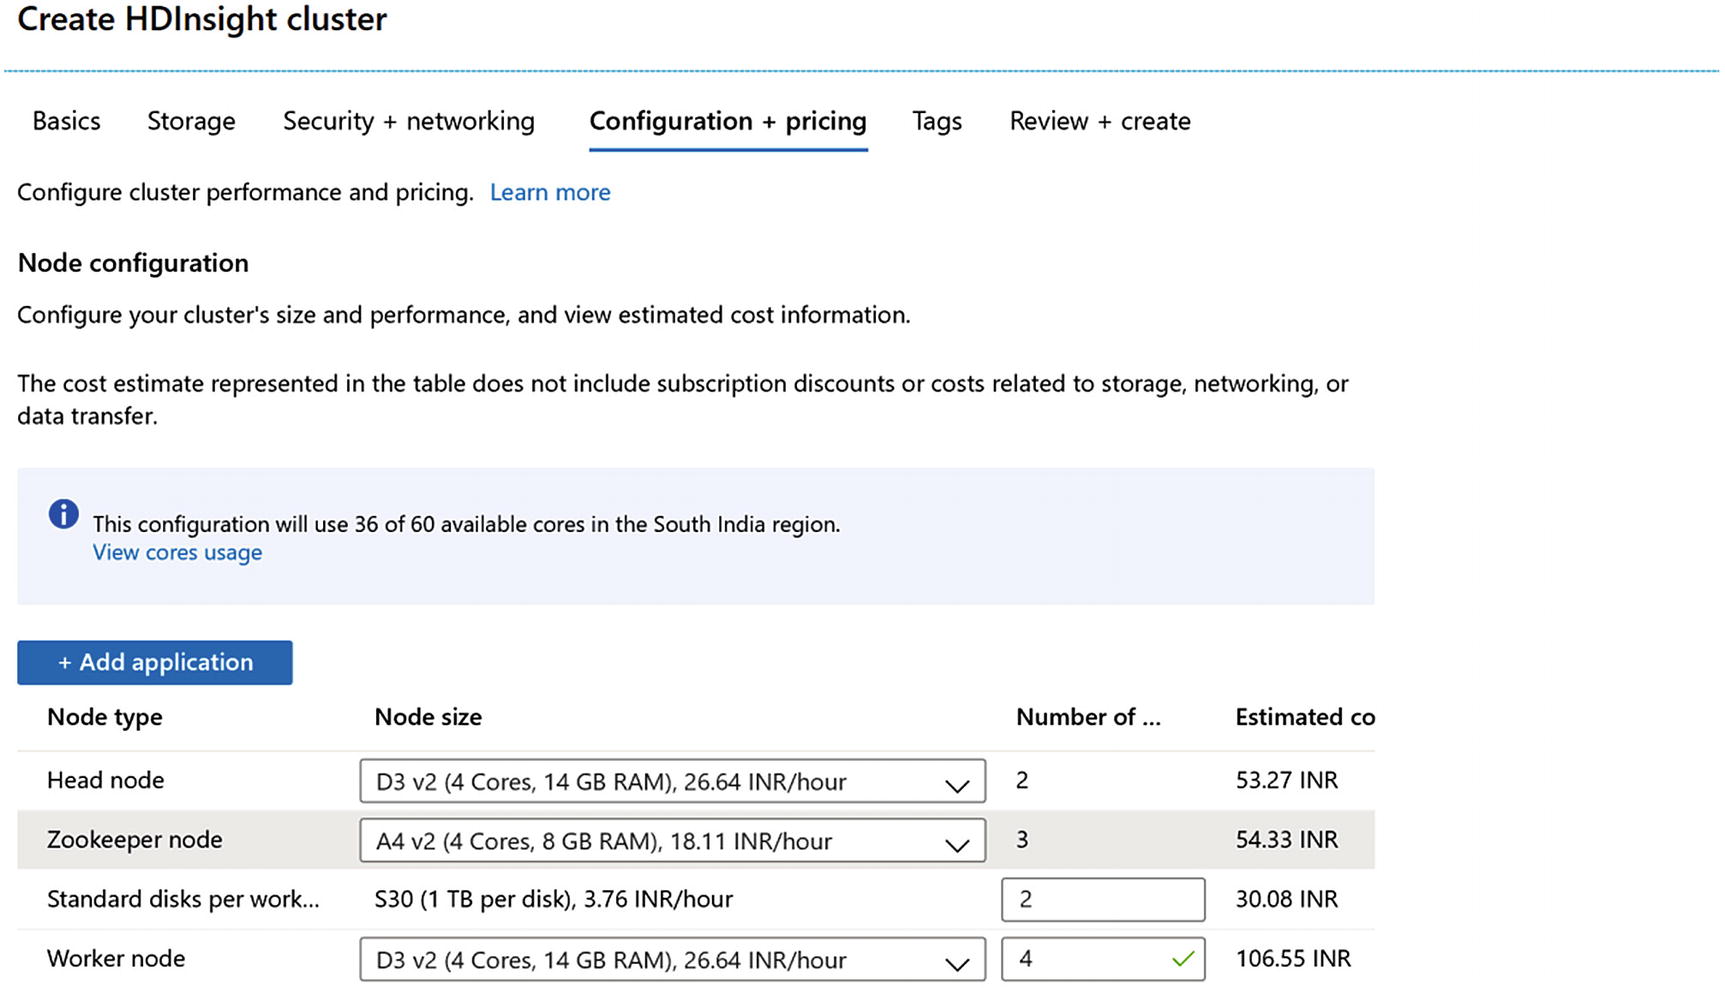 Figure 4-5
Enter preferred nodes’ size (refer to the sizing section for more details)
- 1.
Head node: There are at minimum two head nodes in an HDInsight cluster; these are the nodes where Hadoop runs along with components like Ambari and Hive Metastore, etc.
- 2.
ZooKeeper node: A minimum of three ZooKeeper nodes are required, as discussed earlier; these nodes help to keep the Apache Kafka nodes up and running. Their high availability, replication, and fault tolerance are managed by these nodes.
- 3.
Standard disk per worker: A minimum of two disks are required for the setup; however, the number of disks depends on the message size and the retention period.
- 4.
Worker nodes: These are the nodes that are called brokers in terms of Apache Kafka. This is where all the topics and partitions are created. A minimum of three worker nodes are needed; however, the number can be increased depending on the expected load.
The cost of the infrastructure is calculated on a per hour basis. With Azure, an Apache Kafka cluster can be up and running within minutes, whereas these steps generally take weeks in an on-premises setup.
- 1.
Message rate
- 2.
Message size
- 3.
Replica count
- 4.
Retention policy
Generally, these inputs must be available before the sizing of the cluster. In the case of inputs not being available, Microsoft Azure provides flexibility to scale on demand—it provides flexibility to the architects to start small in the beginning and gradually scale, as needed.
Recommended VM Types for Apache Kafka
Size | vCPU | Memory: GiB | Temp storage (SSD) GiB | Max temp storage throughput: IOPS / Read MBps / Write MBps | Max data disks / throughput: IOPS | Max NICs / Expected network bandwidth (Mbps) |
|---|---|---|---|---|---|---|
Standard_D3_v2 | 4 | 14 | 200 | 12000 / 187 / 93 | 16 / 16x500 | 4 / 3000 |
Standard_D4_v2 | 8 | 28 | 400 | 24000 / 375 / 187 | 32 / 32x500 | 8 / 6000 |
Standard_D5_v2 | 16 | 56 | 800 | 48000 / 750 / 375 | 64 / 64x500 | 8 / 12000 |
Standard_D12_v2 | 4 | 28 | 200 | 12000 / 187 / 93 | 16 / 16x500 | 4 / 3000 |
Standard_D13_v2 | 8 | 56 | 400 | 24000 / 375 / 187 | 32 / 32x500 | 8 / 6000 |
Standard_D14_v2 | 16 | 112 | 800 | 48000 / 750 / 375 | 64 / 64x500 | 8 / 12000 |
Standard_A1_v2 | 1 | 2 | 10 | 1000 / 20 / 10 | 2 / 2x500 | 2 / 250 |
Standard_A2_v2 | 2 | 4 | 20 | 2000 / 40 / 20 | 4 / 4x500 | 2 / 500 |
Standard_A4_v2 | 4 | 8 | 40 | 4000 / 80 / 40 | 8 / 8x500 | 4 / 1000 |
Minimum Recommended VM Sizes for Kafka on HDInsight Clusters
Cluster type | Kafka |
|---|---|
Head: default VM size | D3_v2 |
Head: minimum recommended VM sizes | D3_v2 |
Worker: default VM size | 4 D12_v2 with 2 S30 disks per broker |
Worker: minimum recommended VM sizes | D3_v2 |
ZooKeeper: default VM size | A4_v2 |
ZooKeeper: minimum recommended VM sizes | A4_v2 |
There is standard Microsoft documentation available on the setup of an Apache Kafka cluster. All the steps can be found on this link: https://docs.microsoft.com/en-us/azure/hdinsight/kafka/apache-kafka-get-started
All the preceding information is important to decide which VM will meet the requirement and how many VMs are required to withstand the incoming data streams.
- 1.
Message rate: 1,000 messages/second
- 2.
Message size: 10 KB
- 3.
Replica count: 3
- 4.
Retention policy: 6 hours
- 5.
Partition: 1
Step 1 - Total throughput needed would be message rate × message size × replica count.
That is 1,000 × 10 × 3 = 30,000 = 30 MB per second approx.
Step 2 – Total storage required for this solution is total message size × retention time.
That is 30 MB/s × 6 hours (6 × 60 × 60) = 30 × 21,600 = 6.4 TB approx.
Ideal sizing of D3 V2 VM can attach seven 1 TB disks, and a total of 1 VMs will be needed.
After all this exercise and creation of Apache Kafka on HDInsight cluster, it’s time for some action. In this chapter, the discussion is only around setting up producers and ensuring the data streams are landing in Apache Kafka. The coming chapters will talk about various options to land this data either in Spark or a storage layer, and how to apply ML for sentiment analytics.
Since an Apache Kafka cluster has been created already, let’s configure the producer to pick up live stream data as follows.
Exercise: Create an Apache Kafka Cluster in Azure HDInsight for Data Ingestion and Analysis
- 1.
Create an Apache Kafka cluster on Azure HDInsight
- 2.
Create a topic
- 3.
Ingest data in topic
Since this chapter is about data ingestion, all the exercises are discussed till data ingestion. However, all the remaining phases like event processing and dashboards are discussed in the coming chapters.
Now, let’s learn how to create topics and produce events. Since the Apache Kafka cluster has been created in the previous section already, let’s log into the cluster to complete the exercise.
- 1.
Run the following ssh command on Windows cmd:
In this command, replace CLUSTERNAME with the name of the cluster.
When prompted for password, enter the password, and connect to the cluster. After connecting to the Apache Kafka cluster, the first step is to fetch the ZooKeeper and broker information:- a.Install jq, a command line JSON processor as shown in Figure 4-6.
 Figure 4-6
Install JQ
sudo apt -y install jq
- b.
Set up password; replace PASSWORD in the following command:
export password="PASSWORD"
- c.
Export the cluster name:
export clusterName='<clustername>'
- d.
Run the command to extract and set up ZooKeeper information:
export KAFKAZKHOSTS=$(curl -sS -u admin:$password -G https://$clusterName.azurehdinsight.net/api/v1/clusters/$clusterName/services/ZOOKEEPER/components/ZOOKEEPER_SERVER | jq -r '["(.host_components[].HostRoles.host_name):2181"] | join(",")' | cut -d',' -f1,2);
- e.
Run the command to extract and set up Apache Kafka broker host information.
export KAFKABROKERS=$(curl -sS -u admin:$password -G https://$clusterName.azurehdinsight.net/api/v1/clusters/$clusterName/services/KAFKA/components/KAFKA_BROKER | jq -r '["(.host_components[].HostRoles.host_name):9092"] | join(",")' | cut -d',' -f1,2);
- a.
After the preceding configurations are set up, Kafka topics can be created and the events can be produced/consumed.
Kafka comes with an inbuilt utility script named kafka-topics.sh, which can be used to create/delete/list topics. It also provides utility scripts like kafka-console-producer.sh, which can be used to write records to the topics and kafka-console-consumer.sh, which can be used to consume those records from the topic.
- 1.To create a topic test, run the following command:/usr/hdp/current/kafka-broker/bin/kafka-topics.sh --create --replication-factor 3 --partitions 8 --topic test --zookeeper $KAFKAZKHOSTS
A Kafka topic with replication factor 3 and 8 partitions is created. The worker nodes created are 4; therefore, we can replicate the topics to less than or equal to 4. There are 8 partitions created, which means that the consumer group should have a maximum 8 consumers.
- 2.To list the topic as shown in Figure 4-7:/usr/hdp/current/kafka-broker/bin/kafka-topics.sh --list --zookeeper $KAFKAZKHOSTS
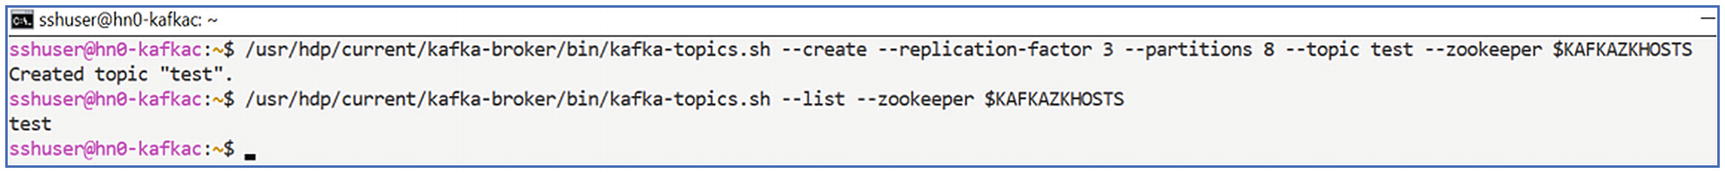
Query list of Kafka topics
- 3.To write records to topic:/usr/hdp/current/kafka-broker/bin/kafka-console-producer.sh --broker-list $KAFKABROKERS --topic test
- 4.Type the records as shown in Figure 4-8 and then press Ctl+C to return.
 Figure 4-8
Insertion of data streams
- 5.To read records from the topic from the beginning:/usr/hdp/current/kafka-broker/bin/kafka-console-consumer.sh --bootstrap-server $KAFKABROKERS --topic test --from-beginning
- 6.To delete the topic:/usr/hdp/current/kafka-broker/bin/kafka-topics.sh --delete --topic test --zookeeper $KAFKAZKHOSTS
This was a basic exercise to give a hands-on experience on Apache Kafka cluster. Now, let’s discuss the next option—Event Hub—as follows.
Event Hub
- 1.
Throughput unit
- 2.
Cluster unit
- 3.
Namespace
- 4.
Partitions
- 5.
Event producers
- 6.
Event receivers

Anatomy of Event Hub ecosystem
Ingress: Up to 1 MB per second or 1000 events per second (whichever comes first).
Egress: Up to 2 MB per second or 4096 events per second.
Up to 20 throughput units can be procured in a single namespace. Setup can be started with a minimum of 1 TU, and autoinflate option can be used to increase the TUs up to 20.
Cluster Unit (CU) – If the requirement is larger than 20 TU—that is, 20 MBs per second or 20,000 messages per second—the option is to opt for an event hub with dedicated capacity. For dedicated capacity, the measure of throughout is cluster units, and 1 CU = 100 TUs.
Namespace – Namespace is a logical collection of event hubs. Throughout units or cluster units are mentioned when the namespace is created. Throughput units/cluster units allocated at the time of namespace creation are shared among all the event hubs.
Partitions – Partition is the place where the streaming messages are written by the event producers and are read by the consumers. While creating event hubs, the number of partitions is mentioned. The general recommendation is to create a number of partitions equal to throughput units. The number of partitions should be decided based on the downstream applications.
Event producers – Event producers are the entities that produce and send events to event hubs. Some examples of event producers are social media platforms, clickstreams, or application event logs. Event producers write the event to partitions, which are further processed as needed. Event producers can use standard AMQP or HTTP(S) protocols to send data to Event Hub.
Event receivers – Event receivers are the entities that consume the events from Event Hub partitions. These are generally applications that process the event data. This can be Apache Spark steaming clusters, Storm, or stream analytics service or even Blob storage. Consumer groups are created for downstream applications. As shown in Figure 4-9, based on the need, consumers can either be part of existing consumer groups or create a new consumer group.
Why Event Hubs?
- 1.Microsoft has given lots of flexibility to seamlessly migrate from Apache Kafka to Event Hubs. While creating an Event Hub Namespace, as shown in Figure 4-10, the option to enable Kafka is checked by default.
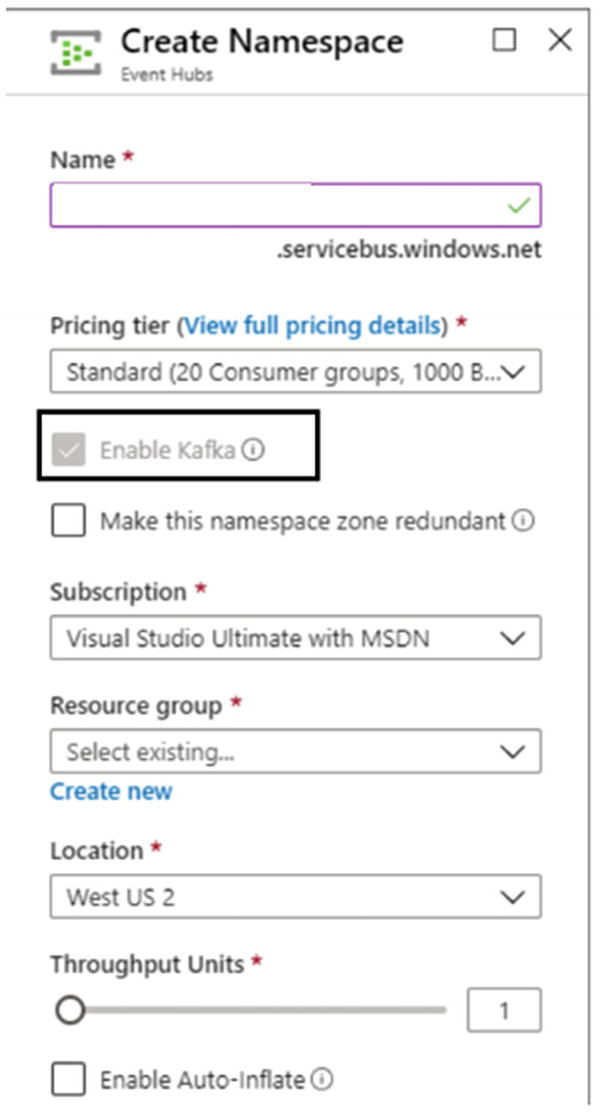 Figure 4-10
Enable Kafka option checked
- 2.
Scalability: Apache Kafka gives flexibility to pick high configuration VMs, which helps to make the solution highly scalable. Event Hubs even can be deployed on dedicated hosts where high configuration can be picked up, as shown in Table 4-4.
Event Hub Service Tiers
Feature | Standard | Dedicated |
|---|---|---|
Bandwidth | 20 TUs (up to 40 TUs) | 20 CUs |
Namespaces | 1 | 50 per CU |
Event Hubs | 10 per namespace | 1,000 per namespace |
Ingress events | Pay per million events | Included |
Message Size | 1 Million Bytes | 1 Million Bytes |
Partitions | 32 per Event Hub | 1024 per Event Hub |
Consumer groups | 20 per Event Hub | No limit per CU, 1,000 per Event Hub |
Brokered connections | 1,000 included, 5,000 max | 100 K included and max |
Message Retention | 7 days, 84 GB included per TU | 90 days, 10 TB included per CU |
Capture | Pay per hour | Included |
Moreover, 1 CU = 100 TU and 1 TU is:
Ingress: Up to 1 MB per second or 1,000 events per second (whichever comes first).
Egress: Up to 2 MB per second or 4096 events per second.
This means with dedicated hosts, millions of messages per seconds can be easily processed without any maintenance overheads.
Moreover, for parallel real-time, and batch processing, features like event hub capture are helpful. With event hub capture, incoming streaming data can be sent directly to Azure Blob or Azure Data Lake Storage. This feature is like Apache Kafka Connect or Amazon Firehose. For a hands-on experience on Azure Event Hub, let’s go through the following exercise.
Exercise: Ingesting Real-Time Twitter Data Using Event Hub
Today, organizations spend lots of time and money on performing social media analytics to build marketing strategy or improve their service offerings and products. Sentiment analysis is performed on these high-volume Twitter streams of the trending topics. This helps to understand and determine public responses toward the latest products and ideas.
In this section, let’s discuss how to build a real-time analytics solution that can take continuous streaming data from Twitter into an event hub.
This entire exercise can also be referred to on this link:
- 1.
Create Event Hub service
- 2.
A Twitter account
- 3.
Twitter application, which reads the Twitter feeds and pushes them to Event Hub
- 4.
An application that can fetch and send Twitter streams to the Event Hub created in the first step
- 1.
Create an Event Hub service in the Azure portal.
- 2.
On the Create page, provide the namespace name.
- 3.
Provide details like pricing tier, subscription, resource group, and location for the service.
- 4.
When the namespace is deployed, you can search that in the list of Azure services.
- 5.
From the new namespace, select + Event Hub.
- 6.
Provide the name for the Event Hub.
- 7.
Select Create to create the Event Hub service.
- 8.
Create a shared access signature with manage permission.
After the event hub is created, a Twitter client application needs to be created and configured.
- 1.
Go to https://developer.twitter.com/en/apps and create a developer account. After the developer account is created, there will be an option to create a Twitter app.
- 2.
On the create an application page, provide the required details like purpose to create this application and basic information on the usage of this application.
- 3.
Once the application is created, go to the Keys and Tokens tab. Generate the Access token and Access token secret. Copy the values of Access Token, Access Token Secret, and consumer API keys.
- 1.
Download the application code from GitHub: https://github.com/Azure/azure-stream-analytics/tree/master/DataGenerators/TwitterClientCore.
- 2.Use a text editor to open the App.config file. Make the following changes to the <appSettings> element:
- a.
Set oauth_consumer_key to the Twitter Consumer Key (API key).
- b.
Set oauth_consumer_secret to the Twitter Consumer Secret (API secret key).
- c.
Set oauth_token to the Twitter Access token.
- d.
Set oauth_token_secret to the Twitter Access token secret.
- e.
Set EventHubNameConnectionString to the connection string.
- f.
Set EventHubName to the event hub name (that is the value of the entity path).
- a.
- 3.
Open the command line and navigate to the directory where your TwitterClientCore app is located. Use the command dotnet build to build the project. Then use the command dotnet run to run the app. The app sends Tweets to your event hub.
- 4.After the Twitter data is ingested, the event hub monitoring dashboard looks as shown in Figure 4-11.
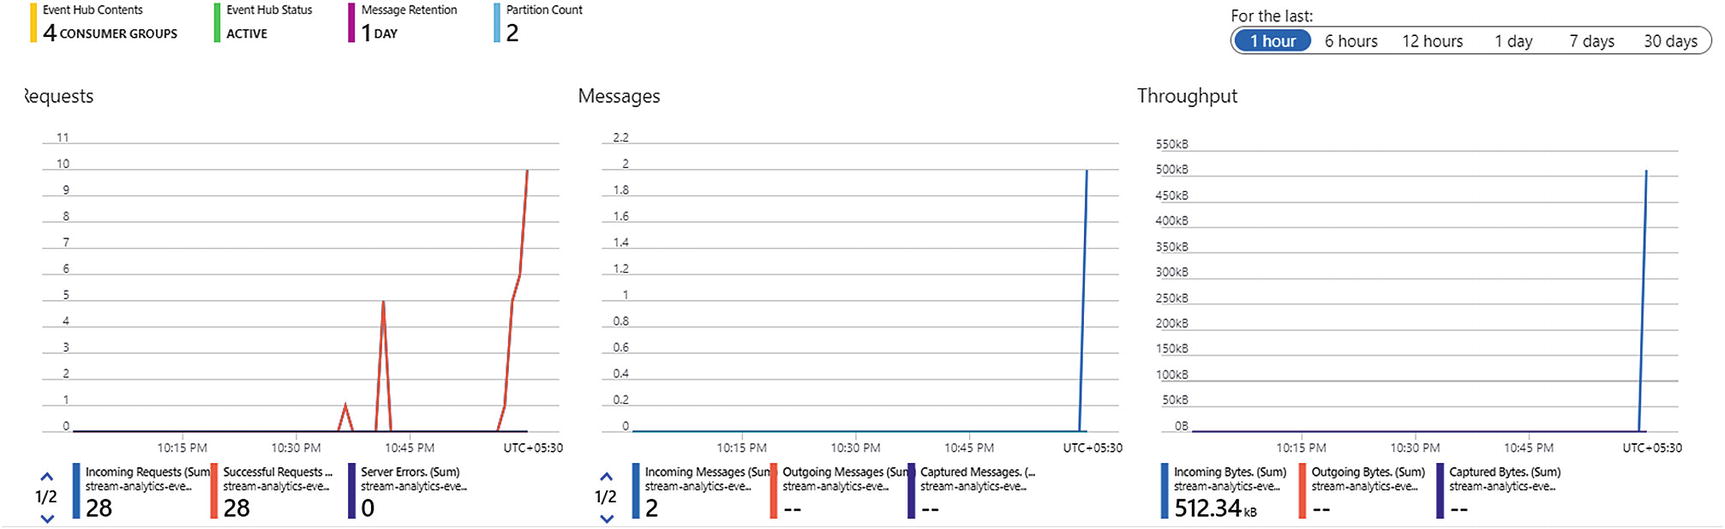 Figure 4-11
Event hub monitoring dashboard
It shows the number of incoming requests, messages, and throughput of the event hub. As discussed earlier, event hubs can fetch data from social media, clickstream, or other custom data streaming applications. However, there is another large segment, which generates stream data through IoT devices. Let’s discuss IoT Hub, a serverless service available on Azure to connect with these IoT devices and fetch real-time IoT streams.
IoT Hub – IoT Hub is a service available on Microsoft Azure for processing data coming particularly from IoT devices. IoT devices are widely used in manufacturing, smart cities, connected cars, or anywhere where real-time data is needed from the hardware devices. The real purpose of IoT is to enhance user experience, detect anomalies, or improve the efficiency of operations without human intervention.
Let’s take the example of connected cars: companies use IoT devices to understand the efficiency of the machinery working inside the car and even enhance the user experience. Today, insurance companies use IoT devices to build the driver profile based on their driving behavior and charge them for the insurance accordingly. Even the steering wheel of the car can have sensors like a heartbeat monitor, and this data can be sent to the cloud to offer health alerts, etc.
One caveat with IoT devices is the need to be connected to the Internet to constantly send and receive data from the target cloud server. Consider places like mines, manufacturing units, or where the real-time response is needed and Internet connectivity is low but real-time response is required. Therefore, IoT devices should have the capability to process data on the devices themselves and generate alerts in real-time. Edge devices are IoT devices with a capability to process data locally to a certain extent, generate real-time alerts, and send the output to the cloud whenever there is connectivity.
To connect to IoT devices, Microsoft offers Azure IoT Hub, which are like event hubs but with added features. Both IoT hubs and event hubs are for ingesting real-time data. However, IoT hubs are designed specifically for ingesting data from IoT devices, and event hubs are designed for ingesting telemetry and event data streams. IoT hubs support bidirectional communication between device and the cloud, which helps to do much more with the devices. However, event hubs are unidirectional and just receive the data for further processing. One of the biggest challenges with IoT devices today is the security of data. IoT Hub provides various capabilities like secure communication protocols; integration with security tools on Azure detect and react to the security breaches on IoT devices.
The following chart summarizes the difference between event hubs and IoT hubs tiers.
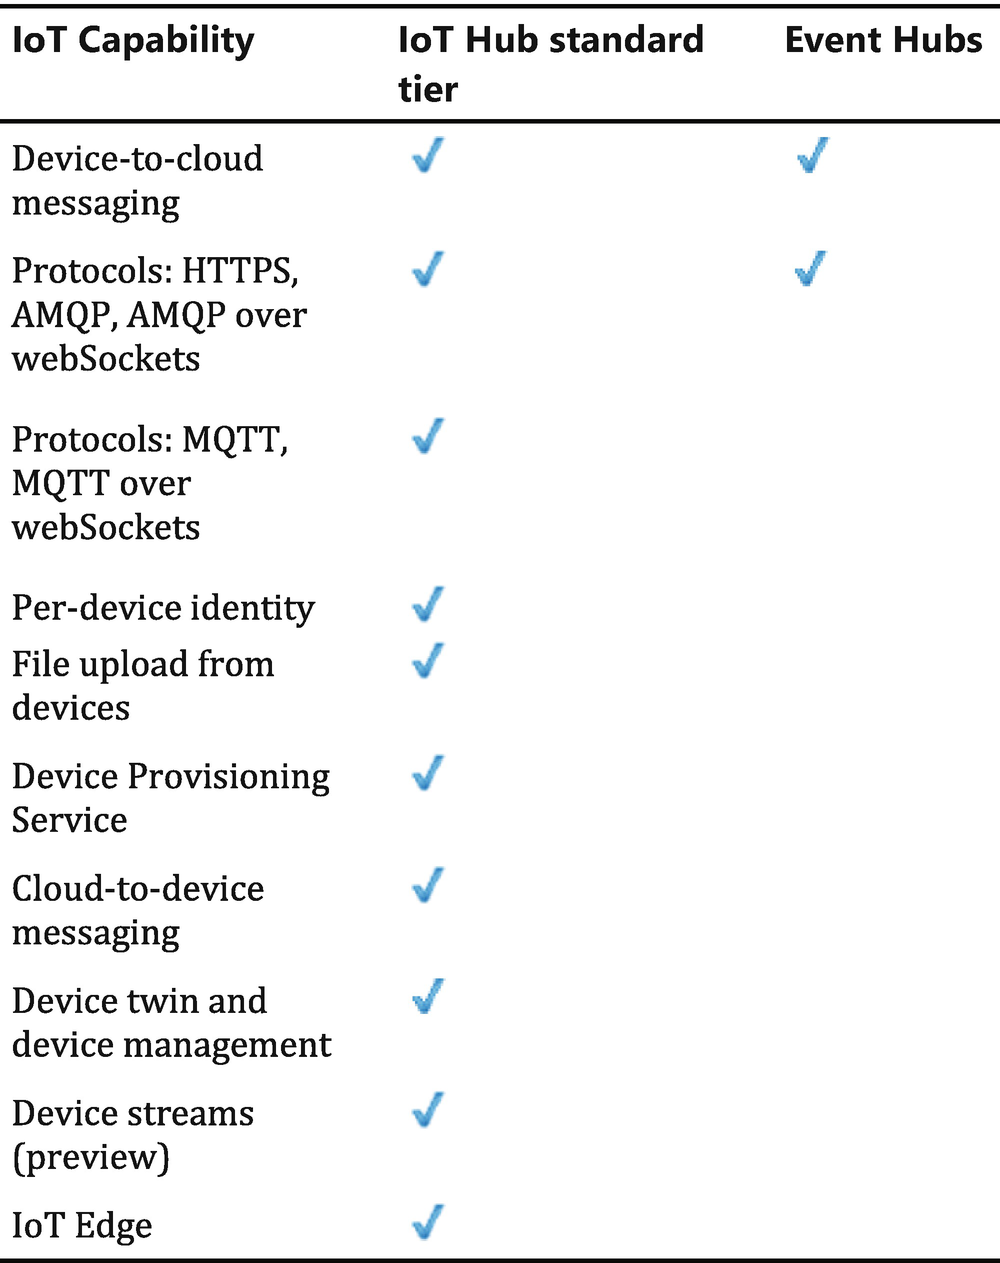
To find an updated version of this chart, please check the weblink https://docs.microsoft.com/en-us/azure/iot-hub/iot-hub-compare-event-hubs.
- 1.
IoT hub units
- 2.
IoT devices
- 3.
Partitions
- 4.
Communication protocols
Tier edition | Sustained throughput | Sustained send rate |
|---|---|---|
B1, S1 | Up to 1111 KB/minute per unit(1.5 GB/day/unit) | Average of 278 messages/minute per unit(400,000 messages/day per unit) |
B2, S2 | Up to 16 MB/minute per unit(22.8 GB/day/unit) | Average of 4,167 messages/minute per unit(6 million messages/day per unit) |
B3, S3 | Up to 814 MB/minute per unit(1144.4 GB/day/unit) | Average of 208,333 messages/minute per unit(300 million messages/day per unit) |
IoT Devices – IoT devices must be created to connect to the actual IoT devices. This helps to create two-way communication between IoT Hub and IoT devices.
Partitions – The concept of partitions between Event Hub and IoT Hub is the same: stream data is written to partitions. The maximum number of partitions in the IoT hubs can be 32, and the number varies based on the tier. The number of partitions can’t be changed after the IoT hub is created.
Protocol | Recommendations |
|---|---|
MQTTMQTT over WebSocket | Use on all devices that do not require connection to multiple devices (each with its own per-device credentials) over the same TLS connection. |
AMQPAMQP over WebSocket | Use on field and cloud gateways to take advantage of connection multiplexing across devices. |
HTTPS | Use for devices that cannot support other protocols. |
- 1.
Create IoT Hub service
- 2.
Register IoT device
- 3.
Run simulator code to generate input streaming data
- 4.
Query the input data
- 1.
Create an IoT Hub service in the Azure Portal.
- 2.
On the Basic tab, provide details like Subscription, Resource group, region, and IoT Hub name.
- 3.
On the Size and Scale tab, provide details like Pricing and Scale Tier, IoT Hub units, and Azure Security Center.
- 4.
Select Review + create to review and create the instance.
Register IoT devices
- 1.
In the IoT Hub service, open IoT Devices, then select New to add a new IoT device.
- 2.
In Create a device, provide a name and choose authentication type and then select Save.
- 3.
Now open the device from the list in the IoT devices pane. Copy the Primary Connection String; this will be used for configuring the IoT device with IoT Hub
The next level is to configure the IoT devices with the IoT Hub.
In order to simulate an IoT device, C#-based simulator code has been created, which is available at:
- 1.
In the local terminal window, navigate to folder AdvanceAnalyticsOnDataLakeIOTHub.
- 2.Open the file SensorSimulator.cs file in the text editor or visual studio, as seen in Figure 4-12.
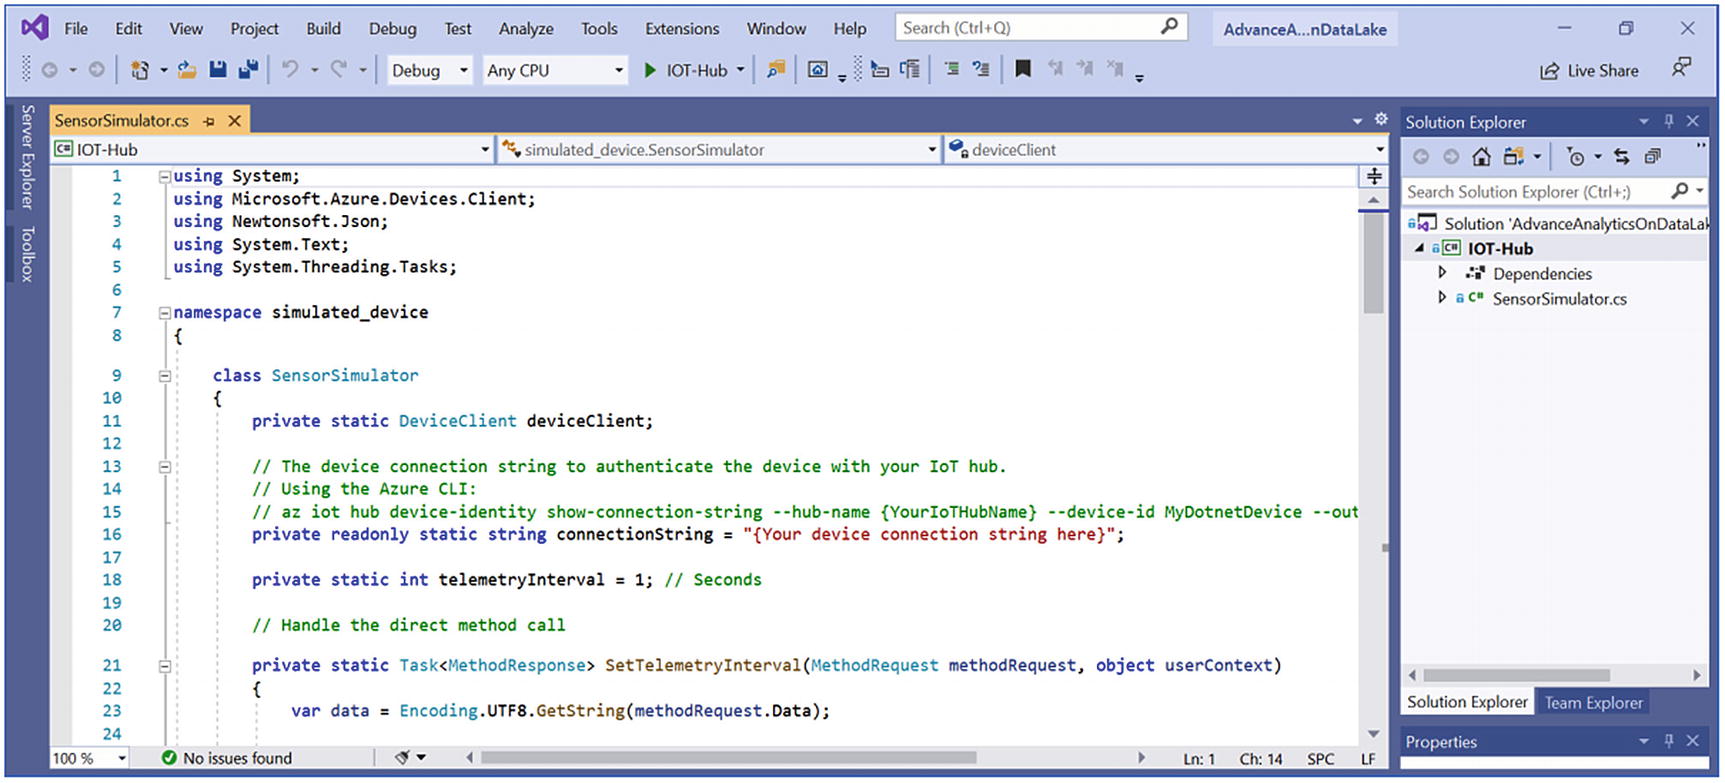 Figure 4-12
Device connection string
- 3.
Replace the value of the connectionString variable with the device connection string.
- 4.
Run the following command to install the packages in the directory where the code has been downloaded: dotnet restore.
- 5.
Run the following command to build the project: dotnet run.
- 6.After this, the simulator will start sending data to the IoT Hub, as shown in Figure 4-13.
 Figure 4-13
IoT simulator run
Once the devices are configured and the input data ingestion has started, this data can be queried. IoT Hub provides an SQL-like language to fetch information like device twins, message routing, jobs, and module twines.
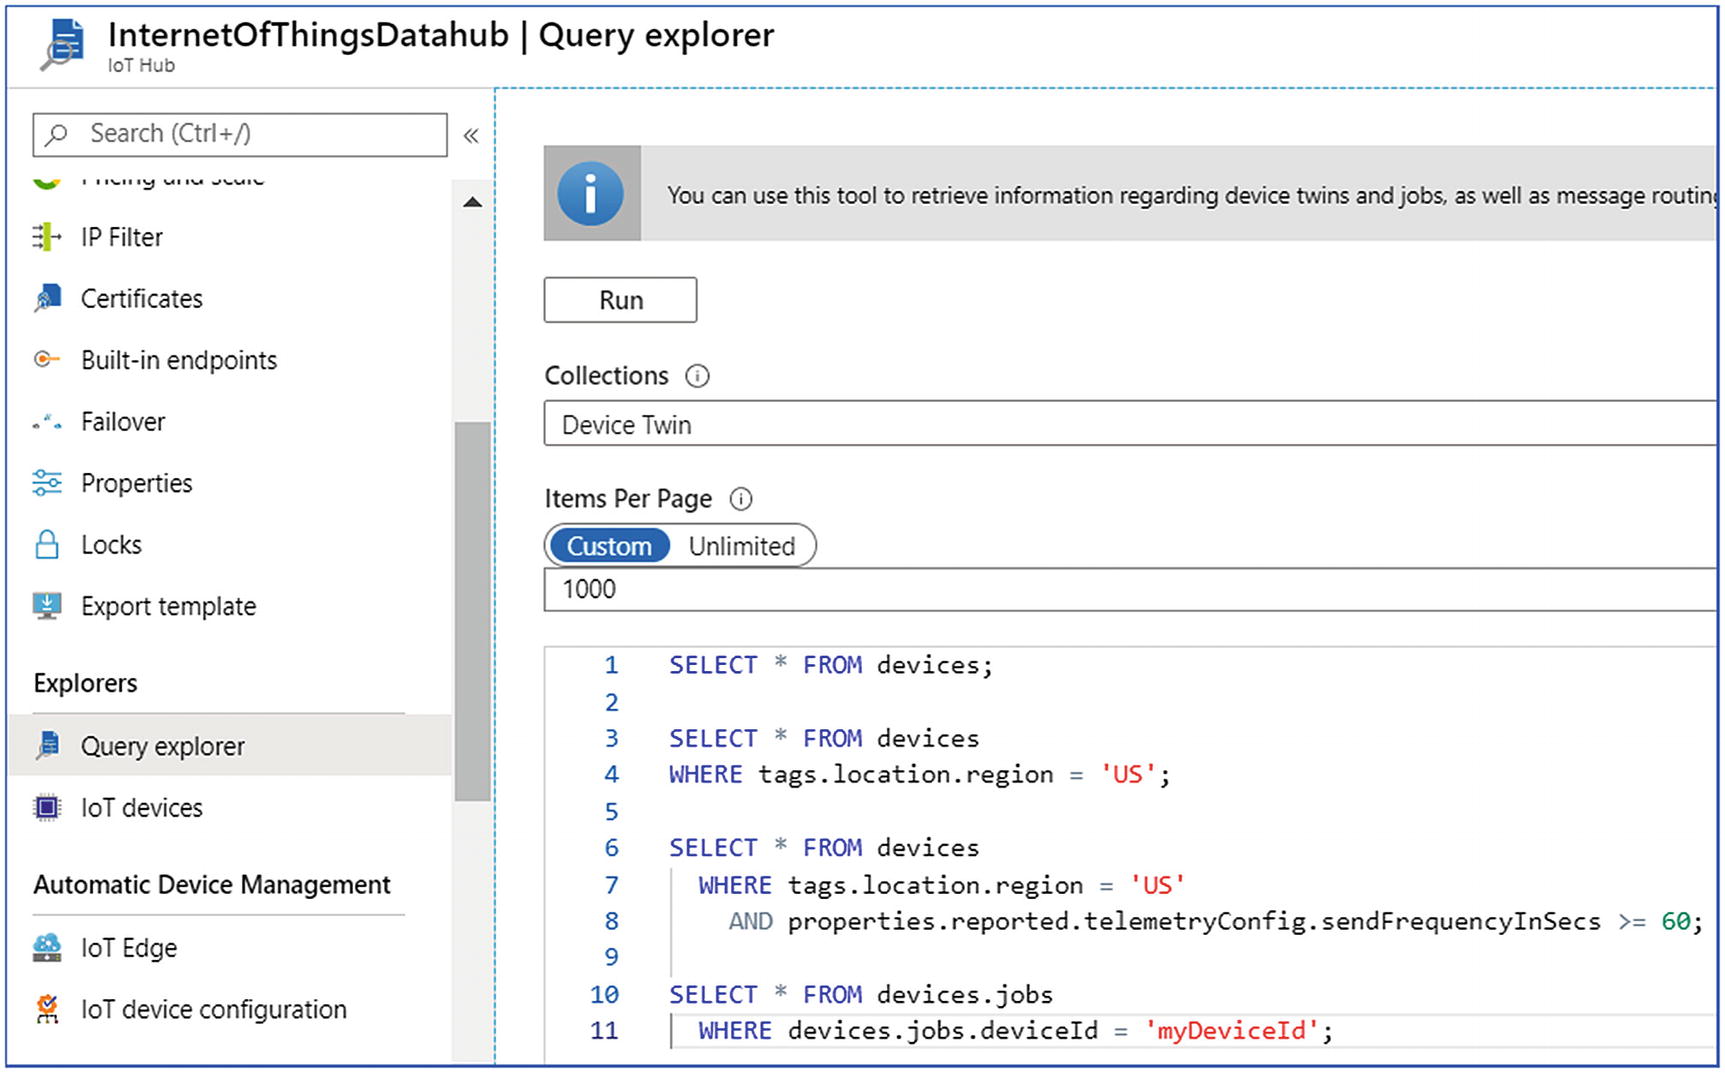
IoT Hub query explorer
With this exercise, real-time data stream ingestion comes to an end. In the next section, the discussion is on batch data ingestion.
Batch Data Ingestion
Data ingestion architecture
To detect patterns or build 360-degree analytics solutions, batch mode processing plays a key role. Real-time processing is required for solutions where mission critical or time-bound response is needed. Examples like fraud detection or predictive maintenance are scenarios where if real-time response is not given, opportunity to avoid an event is lost and can cause financial loss to the business. In fact, batch mode processing acts as a feedback loop that helps to enhance the response for real-time processing; for example, detecting patterns of fraudulent transactions can happen only with batch mode processing, which improves the accuracy of the machine learning model. When the newly trained ML models are used in real time, they can detect frauds/events more effectively.
- 1.
Azure Data Factory
- 2.
SQL Server Integration Services on Azure VMs
- 3.
Informatica
- 4.
Azure Marketplace solutions
Azure Data Factory
Azure Data Factory (ADF) is a Microsoft native cloud solution built for ETL/ELT scenariosc. It’s a fully managed PaaS offering from Azure and is a serverless solution. It means data engineers can build data ingestion solution without worrying about the infrastructure requirements. It provides more than 90 data connectors for connecting to multiple on-premises and cloud data sources. Moreover, it provides a code-free user interface where developers can drag and drop activities to create and monitor data pipeline. Data pipeline is another widely used jargon in data analytics solutions.
Data pipeline is the automation of a series of steps that data transverses to yield required output. As we know, the data analytics solution has four major stages: Data Ingestion, Data Storage, Prep and Train, Model and Serve. Solutions like ADF provide the platform to build data pipelines and infuse data into these stages in an orderly fashion.
SQL Server Integration Services and Informatica are the other solutions that have become famous for on-premises environments. These solutions are now cloud ready. Azure Data Factory provides seamless execution of SSIS packages using ADF. Moreover, Informatica is an Azure-certified solution available on Azure Marketplace.
Azure Data Factory provides the following features:
Connect and collect – In any data processing tool, the first step is to connect and fetch data from the data sources. These data sources can be databases, file systems, FTP/SFTP web services, or SaaS based systems. It’s important that the tool understands the underneath protocol, version, and configurations required to connect to each source. Once the sources are connected, the next step is to fetch data and put that in the centralized location for further processing.
Usually enterprises build or buy data management tools or create custom services that can integrate with these data sources and perform processing. This can be an expensive and time-consuming activity. With the frequent version changes in the source data engines, it’s hard to keep pace with regular version upgrades and compatibility checks. Moreover, these custom applications and services often lack features like alerting, monitoring, and other controls that a fully managed PaaS service provides.
All the aforementioned drawbacks are well taken care of in ADF; it provides templates like Copy Activity through which one can easily connect to some 90+ data sources, fetch data, and store in a centralized data store or data lake. For example, data can be collected from an on-premises SQL Server, stored in Azure Data Lake Storage, and further processed in Azure Databricks.
Transform and enrich – Azure Data Factory provides features like data flows through which collected data can be easily processed and transformed in the desirable format. Internally, data flows execute on Spark-based distributed in-memory processing, which makes them highly efficient. A developer who is developing data flows need not understand Spark programming for the processing.
Though in case developers prefer to write and execute custom code for transformations, ADF provides external activities that can then execute the custom code on Hadoop, Spark, machine learning, and Data Lake Analytics.
In case there are already predefined SSIS packages available, those can also be executed on the Azure platform with minimal configuration changes.
CI/CD and publish – Azure DevOps and GitHub can be easily integrated with Azure Data factory for a full continuous integration and development. It helps in incrementally developing, sharing, reviewing, and testing a process before pushing it to production. By maintaining a code repository, forking branches for multilevel development becomes quick and easy.
Monitor – Once the data pipeline building activity is completed, the developer can debug the flow for initial testing and monitoring, once confirmed data flows can be scheduled. For scheduling, ADF provides triggers that can be executed at a specified time or on occurrence of any external event. The external event could be addition or deletion of a file/folder in Azure Data Lake Storage. The developer can also execute pipelines in real time using the trigger row option.
Once executed, the pipelines can be monitored with the status of all the activities included in that pipeline. The performance details are also shared in the monitoring.
- 1.
Datasets
- 2.
Activities
- 3.
Linked service
- 4.
Integration runtime
- 5.
Pipeline
- 6.
Data flows
Datasets – A dataset is a named reference to the data, which will be used for input or output of an activity. There are more than 90 connectors supported by ADF to create the dataset. The data can be brought from open source DBs, SaaS applications, or any public cloud storage, etc.
- 1.
Move and Transform
- 2.
Azure Data Explorer
- 3.
Azure Function
- 4.
Batch Service
- 5.
Databricks
- 6.
Data Lake Analytics
- 7.
General
- 8.
HDInsight
- 9.
Iteration and Conditionals
- 10.
Machine Learning
- 1.
Data Linked Services: It’s the connection to various data sources that ADF can connect with. Currently ADF can connect with more than 90 data sources.
- 2.
Compute Linked Services: It’s the connection to various compute resources where the activities mentioned in the above section.
Integration runtime – Integration runtime is the infrastructure used by ADF to run the operations like data movement, activity dispatch, data flows, and SSIS package execution. It acts as a bridge between activity and linked service.
Pipeline – It’s the logical group of activities to be performed on the data. It’s a workflow that comes into existence by infusing datasets, linked services, and activities.

Relationship between ADF components
Data Flows - Data flow is a way to build data pipelines without coding. It’s a GUI-based method to create linked services, data sets, and activities and build a complete pipeline. Data flows can be used to create pipelines that are less complex and smaller in size.
Exercise: Incrementally Load Data from On-premises SQL Server to Azure Blob Storage
In this exercise, we will load the historic, new, and changed data from a table in an SQL Server on-premises instance to Blob storage in an Azure cloud.
- 1.
Select one column in the source table that can be used to identify the new or updated records; normally it is the last_modify_date_time column, which is called the watermark column.
- 2.
Store the latest value of the watermark column in the source column of a separate table, which we will be called the watermark table.
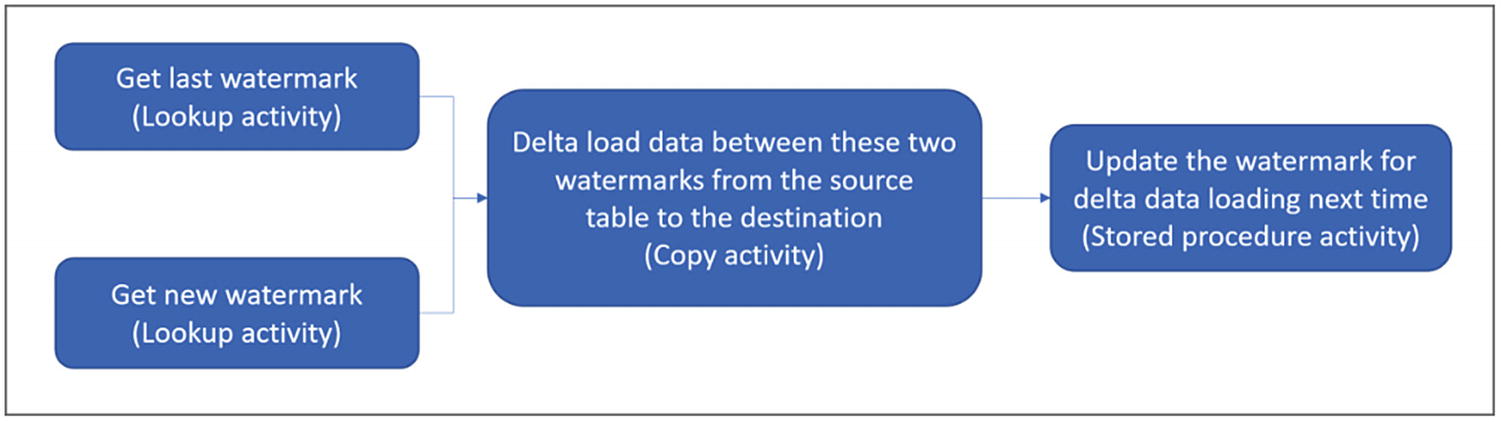
- 3.Create a pipeline that will have the following activities:
- a.
Lookup activity: to fetch the last watermark value from the watermark table and fetch the latest watermark value from the source table
- b.
Copy activity: copies the new and updated data from the source table in SQL Server to Azure Blob storage. The data fetched is greater than the old watermark value and less than the latest watermark value.
- c.
Stored procedure activity: updates the watermark value in the watermark table with the latest value
- a.
- 1.
Open the SQL Server Management Studio. In the Object Explore, right-click the database and choose New Query.
- 2.Create the data source table named data_source.create table data_source(PersonID int,Name varchar(255),LastModifytime datetime);INSERT INTO data_source (PersonID, Name, LastModifytime)VALUES(1, 'John','5/1/2020 12:56:00 AM'),(2, 'Bob','5/2/2020 5:23:00 AM'),(3, 'Chris','5/3/2020 2:36:00 AM'),(4, 'David','5/4/2020 3:21:00 AM'),(5, 'Eger','5/5/2020 8:06:00 AM');
- 3.Create the watermark table to store the watermark value and insert sample rows in it.create table watermarktable(TableName varchar(255),WatermarkValue datetime,);INSERT INTO watermarktableVALUES ('data_source','1/1/2020 12:00:00 AM')
- 4.Create a stored procedure in the SQL database.CREATE PROCEDURE usp_write_watermark @LastModifiedtime datetime, @TableName varchar(50)ASBEGINUPDATE watermarktableSET [WatermarkValue] = @LastModifiedtimeWHERE [TableName] = @TableNameEND
- 5.
After the SQL setup is done, create Azure Data Factory service on the Azure portal.
- 6.
Enter details: Name, Resource group, and Location and click create.
- 7.
Open ADF and click Author and Monitor.
- 8.Create an Integration runtime in Azure Data Factory; go to Connections ➤ Integration runtimes as shown in Figure 4-18.
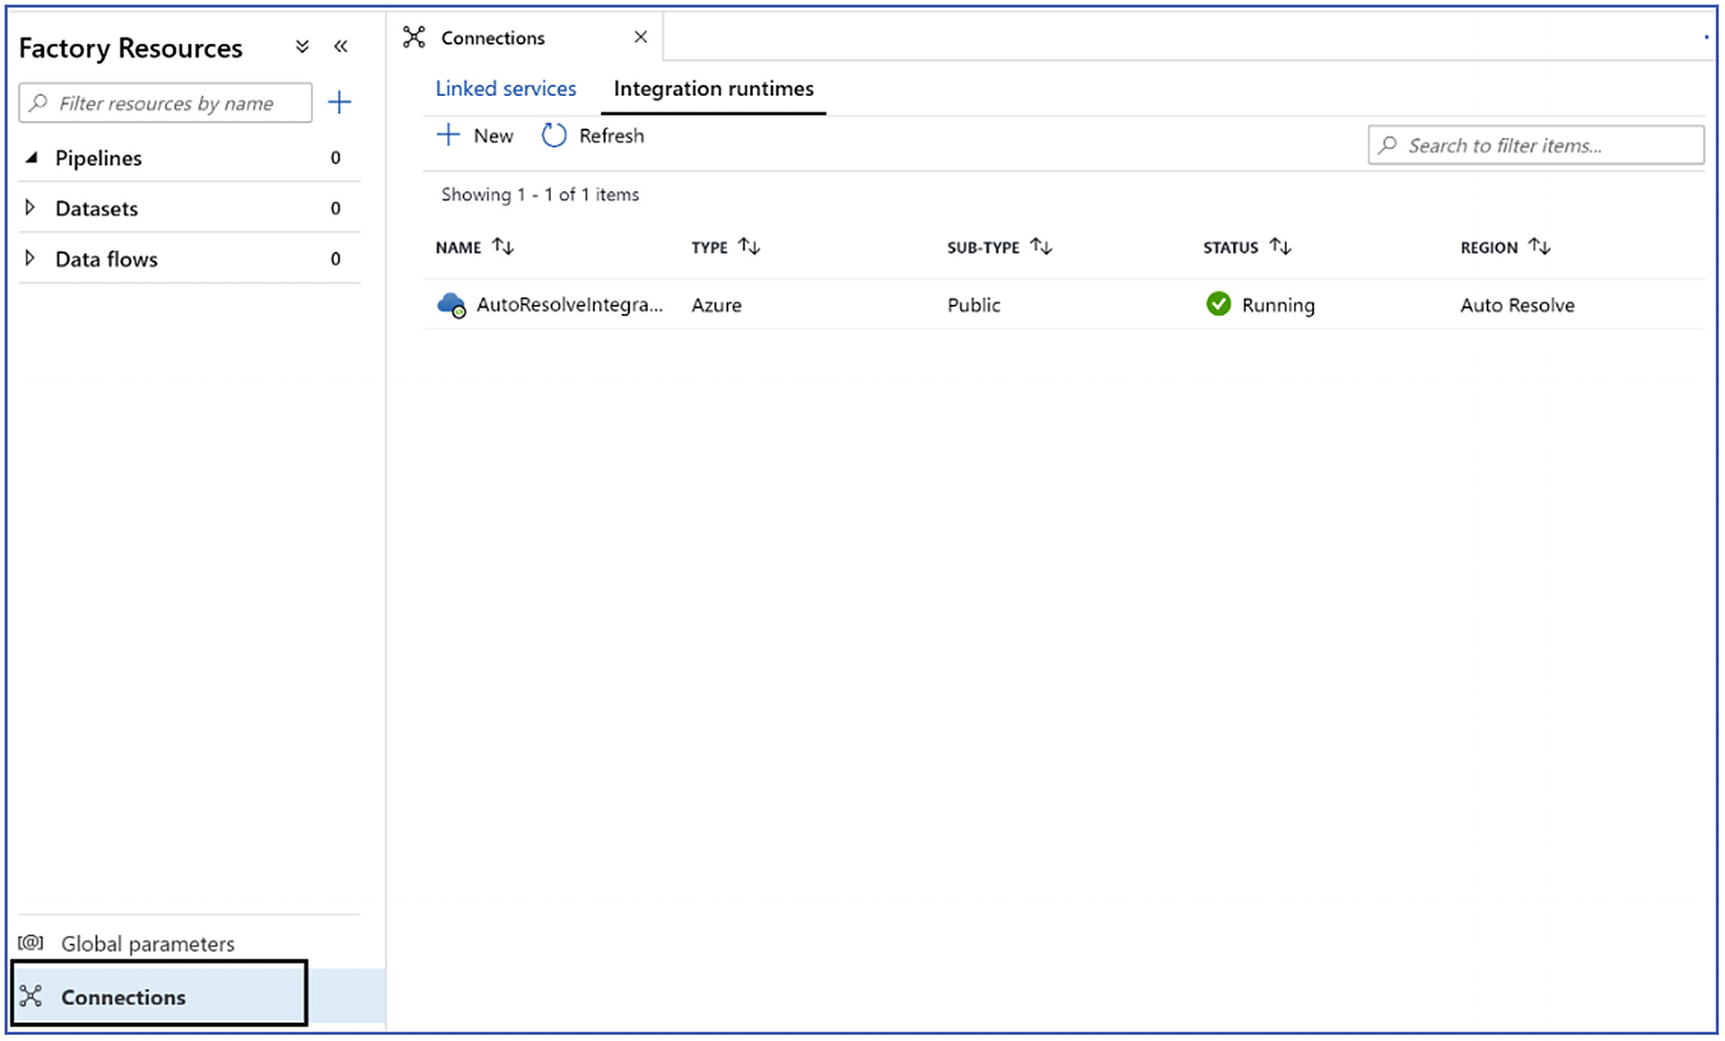 Figure 4-18
Create integration runtime
Since the data is being migrated from an on-premises server, Azure self-Hosted IR is needed. Click New ➤ choose Azure Self-Hosted ➤ choose Self Hosted ➤ provide name of integration runtime ➤ click create.
- 9.
After the Integration runtime is created, download the integration runtime and copy the key.
- 10.
Configure the Integration runtime in the on-premises environment. Copy the key from step no. 9 and paste in the text box and click register.
- 11.Once setup is complete, it should be connected to the Azure data factory and display status as shown in Figure 4-19.
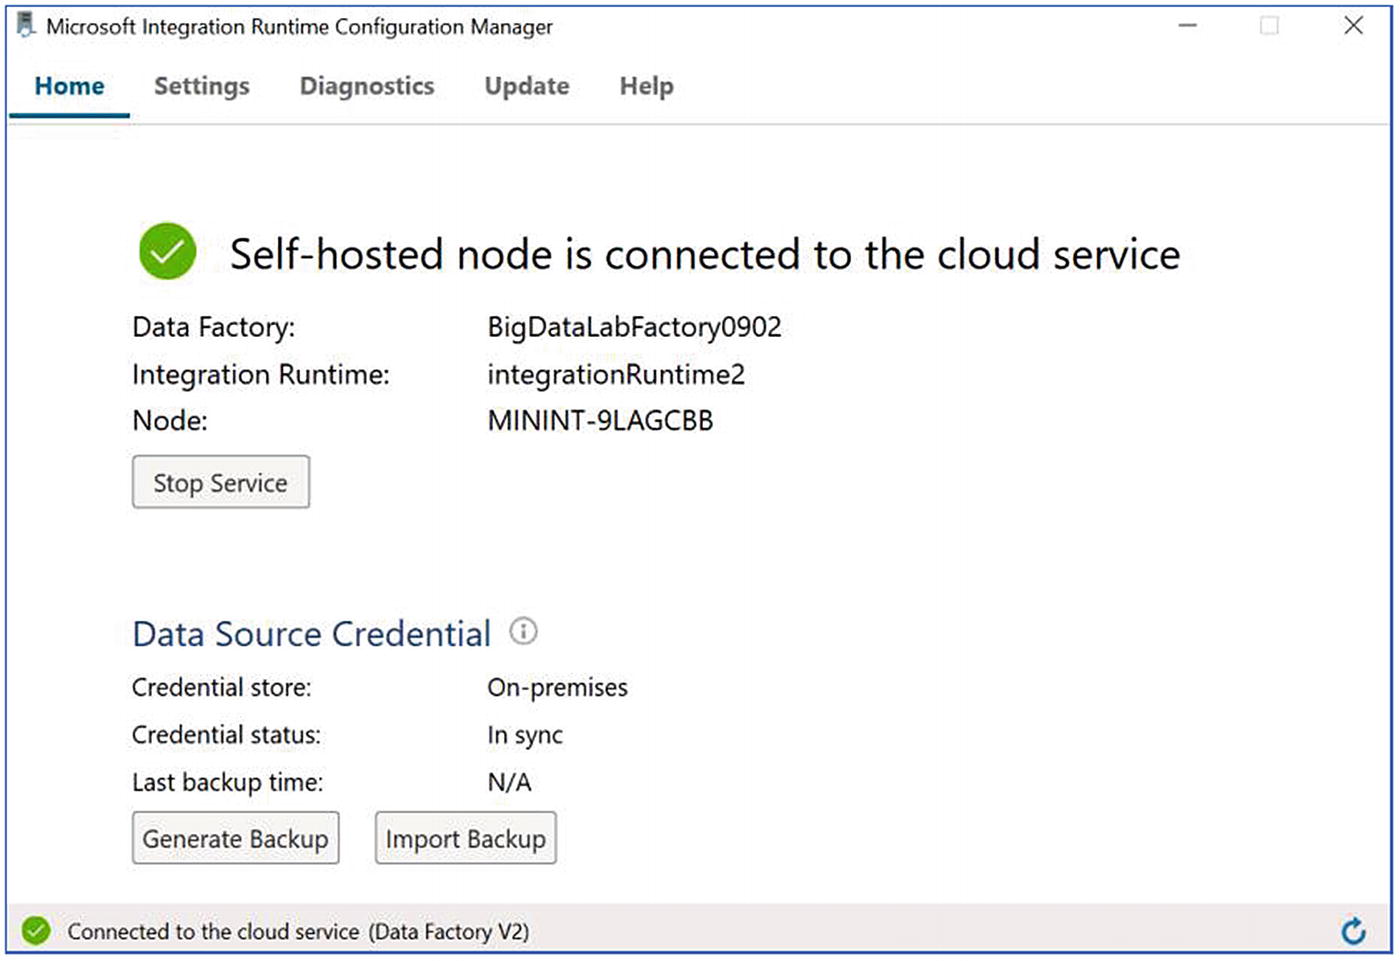 Figure 4-19
Self-hosted runtime connection to ADF
- 12.
Now that the integration runtime is created, the next step is to create a linked service to the SQL Server instance, as in Figure 4-20.

Local DB connection
- 13.
Create Azure Blob storage linked service:
Go to Connections ➤ Linked Service ➤ New ➤ Select Azure Blob Storage ➤ click continue ➤ provide the required details like name, choose integration runtime, choose azure subscription, choose storage account ➤ click create.
- 14.
Now, create a new pipeline in the data factory workspace and name it IncrementalCopyPipeline.
- 15.
Add the Lookup activity in the pipeline and name it LookupOldWaterMarkActivity. Switch to the Settings tab and click + New for Source Dataset.
In this step, you create a dataset to represent data in the watermark table. This table contains the old watermark that was used in the previous copy operation.
- 16.
In the New Dataset window, select Azure SQL Database, and click Continue.
A new window opens for the dataset. In the Set properties window for the dataset, enter WatermarkDataset for Name. For Linked Service, select the SQL Server Linked service created earlier
- 17.In the Connection tab, select [dbo].[watermarktable] for Table. If you want to preview data in the table, click Preview data, as shown in Figure 4-21.
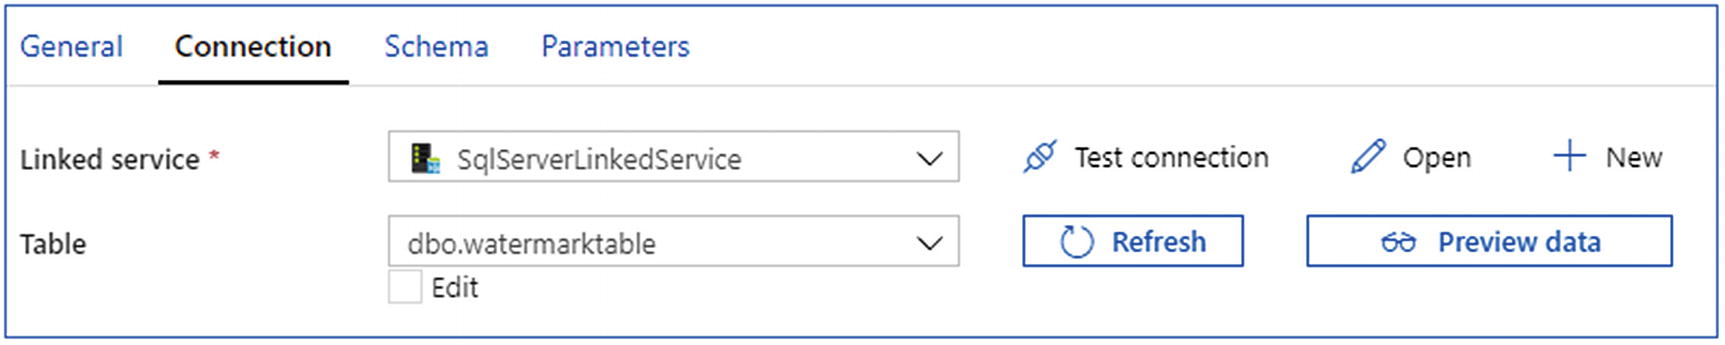 Figure 4-21
Linked service on ADF for on-prem SQL server
- 18.
Next, from the Activities toolbox, drag-drop another Lookup activity and set the name to LookupNewWaterMarkActivity in the General tab of the properties window. This Lookup activity gets the new latest watermark value from the source table.
- 19.
In the properties window for the second Lookup activity, switch to the Settings tab, and click New. You create a dataset to point to the source table that contains the new watermark value (maximum value of LastModifyTime).
- 20.
In the New Dataset window, select Azure SQL Database, and click Continue. In the Set properties window, enter SourceDataset for Name. Select the SQL Server Linked service. Select [dbo].[data_source] for Table.
- 21.
Now in the activity, choose the settings tab and provide the following query:
select MAX(LastModifytime) as NewWatermarkvalue from data_source - 22.
In the Activities toolbox, expand Move and Transform, drag-drop the Copy activity from the Activities toolbox, and set the name to IncrementalCopyActivity .
- 23.Connect both Lookup activities to the Copy activity by dragging the green button attached to the Lookup activities to the Copy activity. Release the mouse button when you see the border color of the Copy activity change to blue, as shown in Figure 4-22.
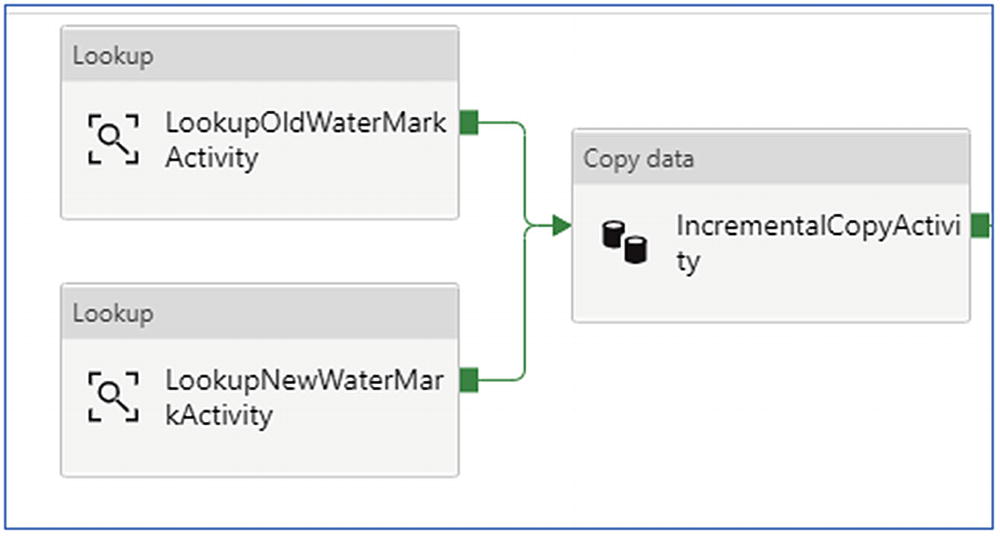 Figure 4-22
ADF copy activity
- 24.
Select the Copy activity and confirm that you see the properties for the activity in the Properties window.
- 25.
Switch to the Source tab in the Properties window, and select SourceDataset for the Source Dataset field. Select Query for the Use Query field, and enter the following SQL query for the Query field.
select * from data_source_table where LastModifytime > '@{activity('LookupOldWaterMarkActivity').output.firstRow.WatermarkValue}' and LastModifytime <= '@{activity('LookupNewWaterMarkActivity').output.firstRow.NewWatermarkvalue}' - 26.
Switch to the Sink tab, and click + New for the Sink Dataset field.
- 27.
In this tutorial, sink data store is of type Azure Blob Storage. Therefore, select Azure Blob Storage, and click Continue in the New Dataset window.
- 28.
In the Select Format window, select the format type of your data, and click Continue.
- 29.In the Set Properties window, enter SinkDataset for Name. For Linked Service, select the Linked service created earlier for Azure Blob storage, as shown in Figure 4-23
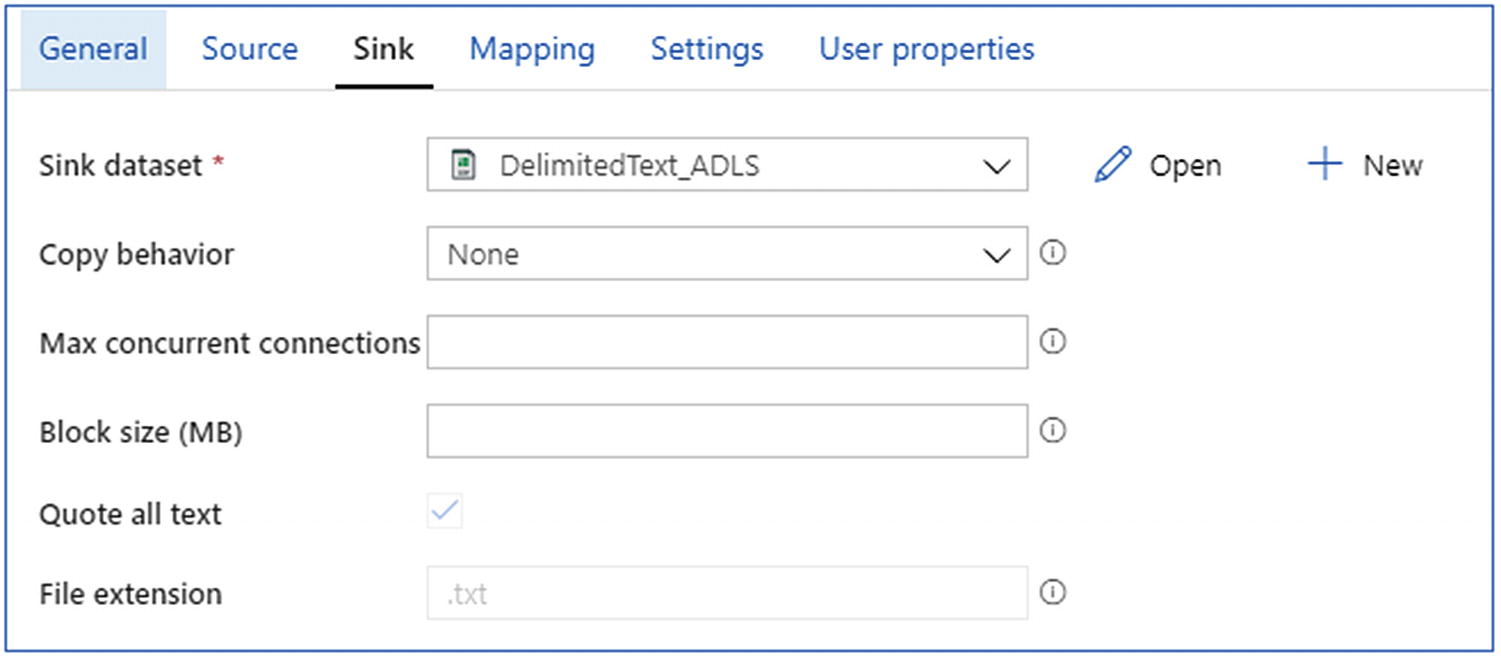 Figure 4-23
ADLS sink settings
- 30.
The next step is to drag and drop a stored procedure activity, and connect the on-success output of the copy activity to stored procedure activity; name the activity StoredProceduretoWriteWatermarkActivity.
- 31.
In the Settings tab, select the SQL Server linked service; provide the SQL server.
When this pipeline is successfully completed, the data from on-premises SQL server will be inserted into Blob storage.
SQL Server Integration Services – SQL Server Integration Services is an ETL solution and comes as a part of the SQL Server installation package. It’s been famous for building ETL of structured data. There are many organizations that have invested heavily in this technology; when they move to cloud, they can move to Azure Data Factory or may prefer to use SSIS packages only.
- 1.
Install SSIS on a Windows virtual machine, migrate and run your SSIS packages
- 2.
Run SSIS packages using ADF
The first option is straightforward— it just needs installation of the SSIS component on Azure VM and connection to the SQL database for the SSIS catalog. However, to run SSIS packages using Azure Data Factory, SSIS integration runtime needs to be configured.
Integration runtimes provide the compute infrastructure used by Azure Data Factory for data flow, data movement, activity dispatch, and SSIS package execution.
- 1.
Azure
- 2.
Self-hosted
- 3.
Azure-SSIS
IR type | Public network | Private network |
|---|---|---|
Azure | Data Flow Data movement Activity dispatch | |
Self-hosted | Data movement Activity dispatch | Data movement Activity dispatch |
Azure-SSIS | SSIS package execution | SSIS package execution |
Azure-SSIS IR – It’s the compute instance that can an SSIS package migrated from on-prem or VM installation on a public cloud. It’s a fully managed compute that can be scaled up or out depending on the requirement. The SSIS package can be run on this compute with minimal to no change.
Conclusion
In this chapter, the data ingestion phase for data analytics solutions has been discussed in detail. There are two major modes of data coming into the data analytics pipeline: real-time and batch mode. For both these modes, there are a set of services available on Azure. In this chapter, all these services have been discussed along with exercises for hands on experience. This is a very important chapter for data engineers as they deal with ETL/ELT of incoming data. In the next chapter, the discussion is on how this incoming data can be stored for batch processing.