

Model and serve phase
Model and Serve
Data warehouse: Usually, the data created by the ETL jobs running on the data in a data lake is loaded into the data warehouse by creating files that can be bulk loaded, or by creating simplistic ETL jobs that simply load the data in real time.
Operational databases: An operational database, which could be a relational database or NoSQL DB, is used to organize, clean, and standardize the data. It addresses an ELT approach disadvantage, in which the ELT jobs interfere with the performance of analytics jobs and affect them. Enterprises can protect analytics queries from being slowed down by ELT jobs by moving all processing to a separate operational database.
Real-time applications and business intelligence tools: Incoming data streams are handled by real-time application and BI tools for catering to industry-specific use cases. These applications could also be deployments of ML models created by data scientists in production for statistical analysis. These applications can process data in both batches and in real time.
As this is the final phase in the data analytics solutions, in continuation of the context from previous chapters, there are two major scenarios—based on which, the entire solution is designed:
Real-time data processing: Data coming from the prep and train phase will land directly in a data store, where the downstream applications will consume it. Scenarios like stock price prediction where the buy or sell call has to be notified in a short span of time, or IoT scenarios where real-time alerts need to be generated, will fall under these scenarios.
Batch mode data processing: Data coming from the prep and train phase will land directly in a data store, and further data modeling will be done. After data modeling, the KPIs will be cached and consumed by data visualization applications like Power BI, Tableau, etc.

Real-time and batch mode data processing
- 1.
Both real-time and batch data is coming from the ingestion layer.
- 2.
Data is getting stored on the Azure Blob storage.
- 3.
Data prep and training is being done with Spark streaming and Databricks for real-time and batch data processing, respectively.
- 4.Based on the use case:
- a.
Scenario 1 (real-time data refresh): The processed data can be either projected directly on dashboarding tools like Power BI or downstream applications to generate alerts or notifications to the end users through Cosmos DB.
- b.
Scenario 2 (batch mode incremental data refresh): Data will be further loaded into Azure Synapse Analytics; and build a caching layer is built, using Azure Analysis Services; and Power BI reports are processed from the caching layer.
- a.
Let’s delve deeper into this phase and understand these scenarios.
Real-Time Data Refresh
- 1.
Real time dashboards
- 2.
Real-time downstream applications
Real time dashboards – Scenarios like social media analytics, where the real-time impact of a campaign needs to be measured, will need real-time data analysis. Real-time streams coming from event hubs or Apache Kafka can be analyzed using Azure Stream Analytics or Spark streaming. The data from these services can land directly into Power BI or any other supported dashboarding solutions.
With the following exercise, let’s understand how the streaming data can be directly projected in Power BI. This is the continuation of same exercise, which was started in Data Ingestion phase, COVID related data was fetched from Twitter and sent to event hub on Azure. In chapter 6, for the prep and train phase, data coming from event hubs was further processed to extract the sentiment of the tweets. Following exercise will help to understand, how the incoming data from Twitter can be directly projected on Power BI to build real time visualizations.
Stream Analytics and Power BI: A Real-Time Analytics Dashboard for Streaming Data
Modify the Stream Analytics Job to Add Power BI Output
- 1.
In the Azure portal, open the Stream Analytics job (named twittereventhub) that was created earlier in Chapter 6.
- 2.
On the left menu, select Outputs under Job topology. Then, select + Add and choose Power BI from the dropdown menu.
- 3.Select + Add ➤ Power BI. Then fill in the form with the details (Figure 8-3) and select Authorize.
 Figure 8-3
PowerBI connection
- 4.
When you select Authorize, a pop-up window opens up and provides credentials to authenticate to your Power BI account. Once the authorization is successful, Save the settings.
- 5.
Click Create.
- 6.
Write and Test the Query.
- 1.
In the Job Topology Section on the left menu, select Query after closing the Output menu (Figure 8-4).
- 2.
You can write your query in the window, which is a simple SQL statement.

Stream analytics query
- 3.
Test the Query by pressing the Test Query button and then view the results in the result tab.
- 4.Run the job.
- a.
Make sure your Twitter app is working.
- b.
In the Stream Analytics job, hover over the Overview menu and then select Start.
 Figure 8-5
Stream Analytics overview
- a.
Now, the Stream Analytics job fetches all the tweets for COVID-19 and builds the dataset and table for Power BI.
Create the Dashboard in Power BI
- 1.
Go to Powerbi.com and sign in with your work or school account. If the Stream Analytics job query outputs results, the dataset will be created (Figure 8-6).

PowerBI interface
- 2.
In the workspace, click + Create.
- 3.
Create a dashboard.
- 4.
At the top of the window, click Add tile, select CUSTOM STREAMING DATA, and then click Next (Figure 8-7).

PowerBI custom streaming
- 5.
Under YOUR DATSETS , select your dataset and then click Next.
- 6.
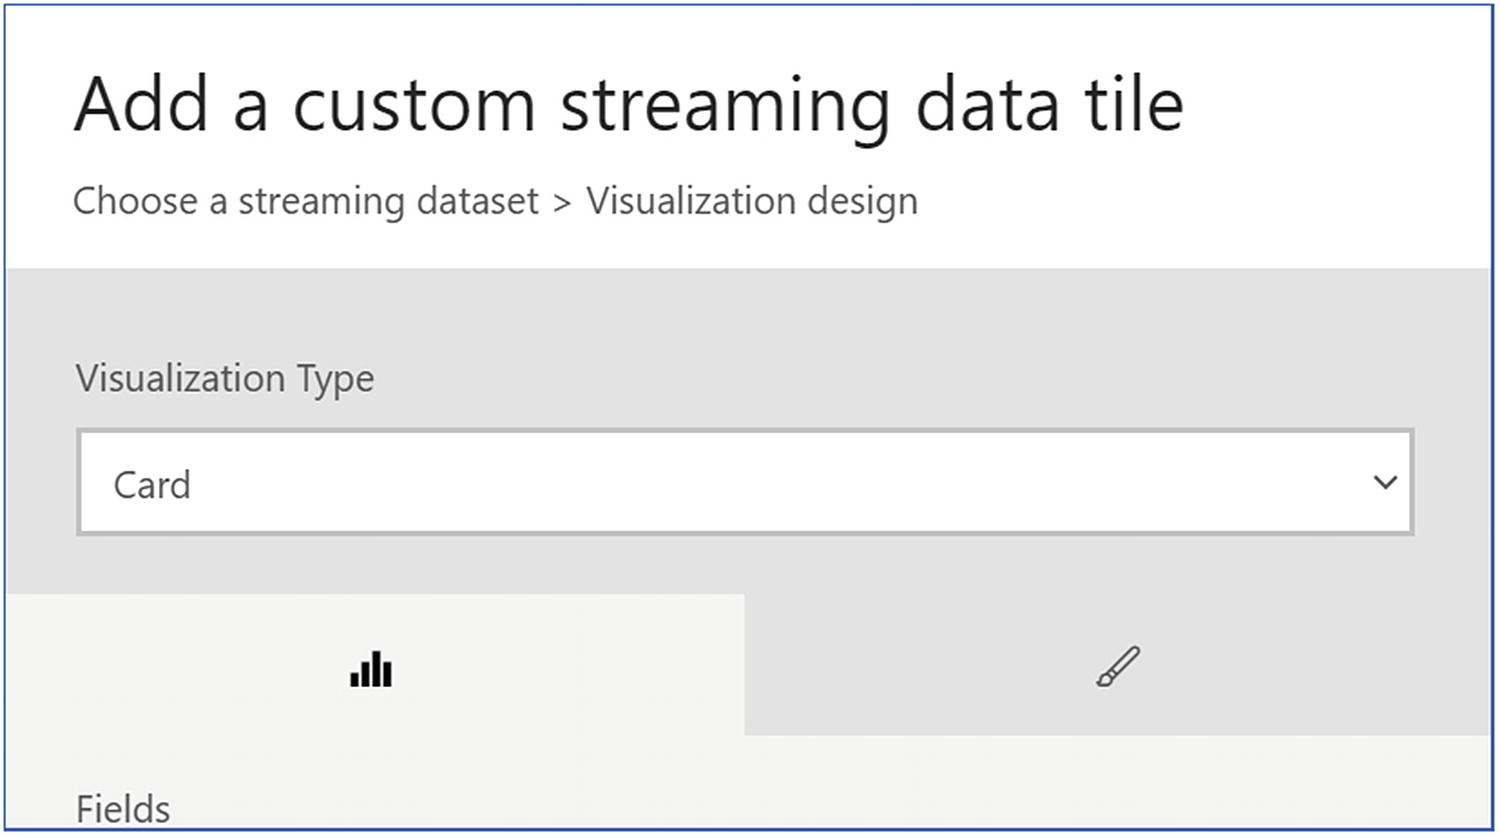
Under Visualization Type, select Card; then, in the Fields list, select your field (Figure 8-8).
PowerBI interface
- 7.
Click Next and fill in the details like a title and subtitle.
- 8.
Click Apply.
- 9.
Visualization will look like Figure 8-9.

PowerBI Interface
Real-time downstream apps – Scenarios like stock price prediction and sending buy/sell stock notification to the stock investors, or fleet-tracking scenarios where the application tracks the real-time location of trucks, will need this solution of sending data in real time to downstream applications. IoT data or streaming data comes in the form of JSON files, and the velocity of this input data is very high. Therefore, it’s crucial to have a data store that can store data in the JSON format and provide real-time data processing capability with limitless scale. Moreover, where the stakeholders are in different geographic locations, it may need multi-master write capabilities and replicate the changes in real time.
Microsoft Azure offers a solution called Cosmos DB, which caters to the features as mentioned previously. Before getting deeper into these scenarios, let’ understand the basics of Cosmos DB.
Cosmos DB – Azure Cosmos DB is a globally distributed, multimodel NoSQL database service. It can infinitely scale across any number of Azure regions worldwide. This is a serverless data store with low order-of-millisecond response time. It supports multiple data models (key-value, documents, graphs, and columnar) and multiple APIs for data access, including Azure Cosmos DB's API for MongoDB, SQL API, Gremlin API, and data models API natively, and in an extensible manner.
Multiple data model and API support: Key-value, column-family, document, and graph database models and APIs are supported.
Turnkey global distribution and multi-master writes: Cosmos DB has global distribution capability, which can be enabled with a click of a button and can replicate data in any Azure datacenter. Moreover, it supports writes from multiple replicas and seamlessly replicates these changes across all the DB replicas.
High availability and tunable throughput: Azure Cosmos DB offers 99.999% guarantees for high availability for both reads and writes. It can elastically scale throughput and storage and provides low latency for reads and writes.
Change feed: Cosmos DB is used for event sourcing to power event-driven architectures, using its change feed functionality. Change feed support in Azure Cosmos DB works by listening to an Azure Cosmos container for any changes. The changes are persisted, can be processed asynchronously and incrementally, and the output can be distributed across one or more downstream microservices and consumers for parallel processing.
- 1.
Request Units
- 2.
Database
- 3.
Container
- 4.
Partition key
- 5.
Query API
- 6.
Consistency level
Request Units – The basic unit of throughput in Cosmos DB is called a Request Unit (RU). RUs are calculated depending upon the operations done on a document, its size, consistency level, indexing policy, etc. There is a tool called Cosmos DB capacity calculator that helps to identify the correct RUs, based on the type of operations to be performed in an application.
Database – A database is a collection of containers, which further consists of actual data. RUs can be provisioned at the database level, which can further be shared by all the containers in a database.
Container – A container is a collection of actual data. RUs can be provisioned at a container level for dedicated use or can be shared from the RUs from DB.
Partition key – A partition key helps to ensure data is segregated across multiple partitions, and helps to scale horizontally. While creating a database and container, this is a mandatory field to add a partition key. The partition key should be based on a column or composite columns with the highest number of unique values. This will ensure even distribution of data across multiple partitions.
- 1.
SQL – This is the most preferred API in Cosmos DB to store JSON documents. This supports server-side programming like stored procedures, triggers, functions, etc.
- 2.
MongoDB – This is another document store data model available in Cosmos DB. MongoDB APIs can be used to migrate data from MongoDB into Cosmos DB. It helps to migrate the applications into Cosmos DB without any major code changes.
- 3.
Cassandra –Cassandra API can used to store columnar data. This API also supports seamless data migration into Cosmos DB and provides Cassandra query language support.
- 4.
Azure Table – This is a key-value pair storage, and Cosmos DB supports this store and API to fetch the data.
- 5.
Gremlin (graph) – This API can be used to store graph data, and it provides seamless migration of the application using Gremlin with minimal code change.
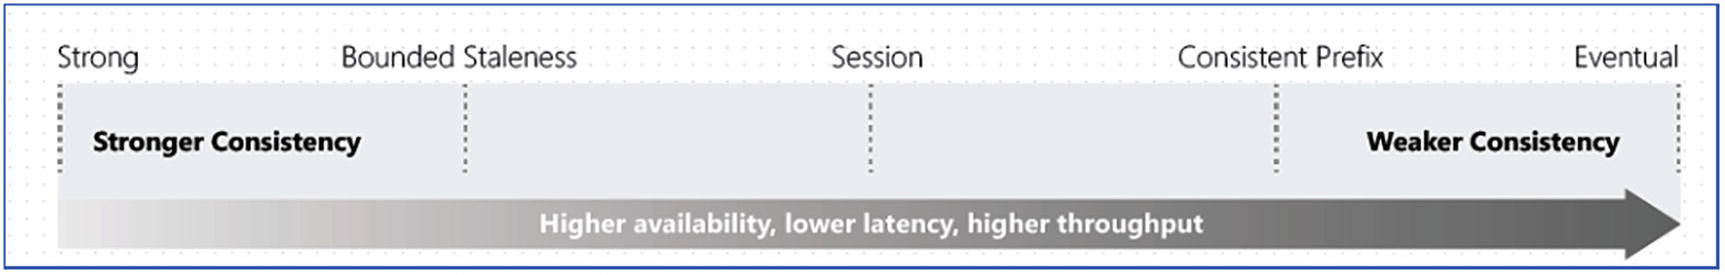
Consistency levels in Cosmos DB
- 1.
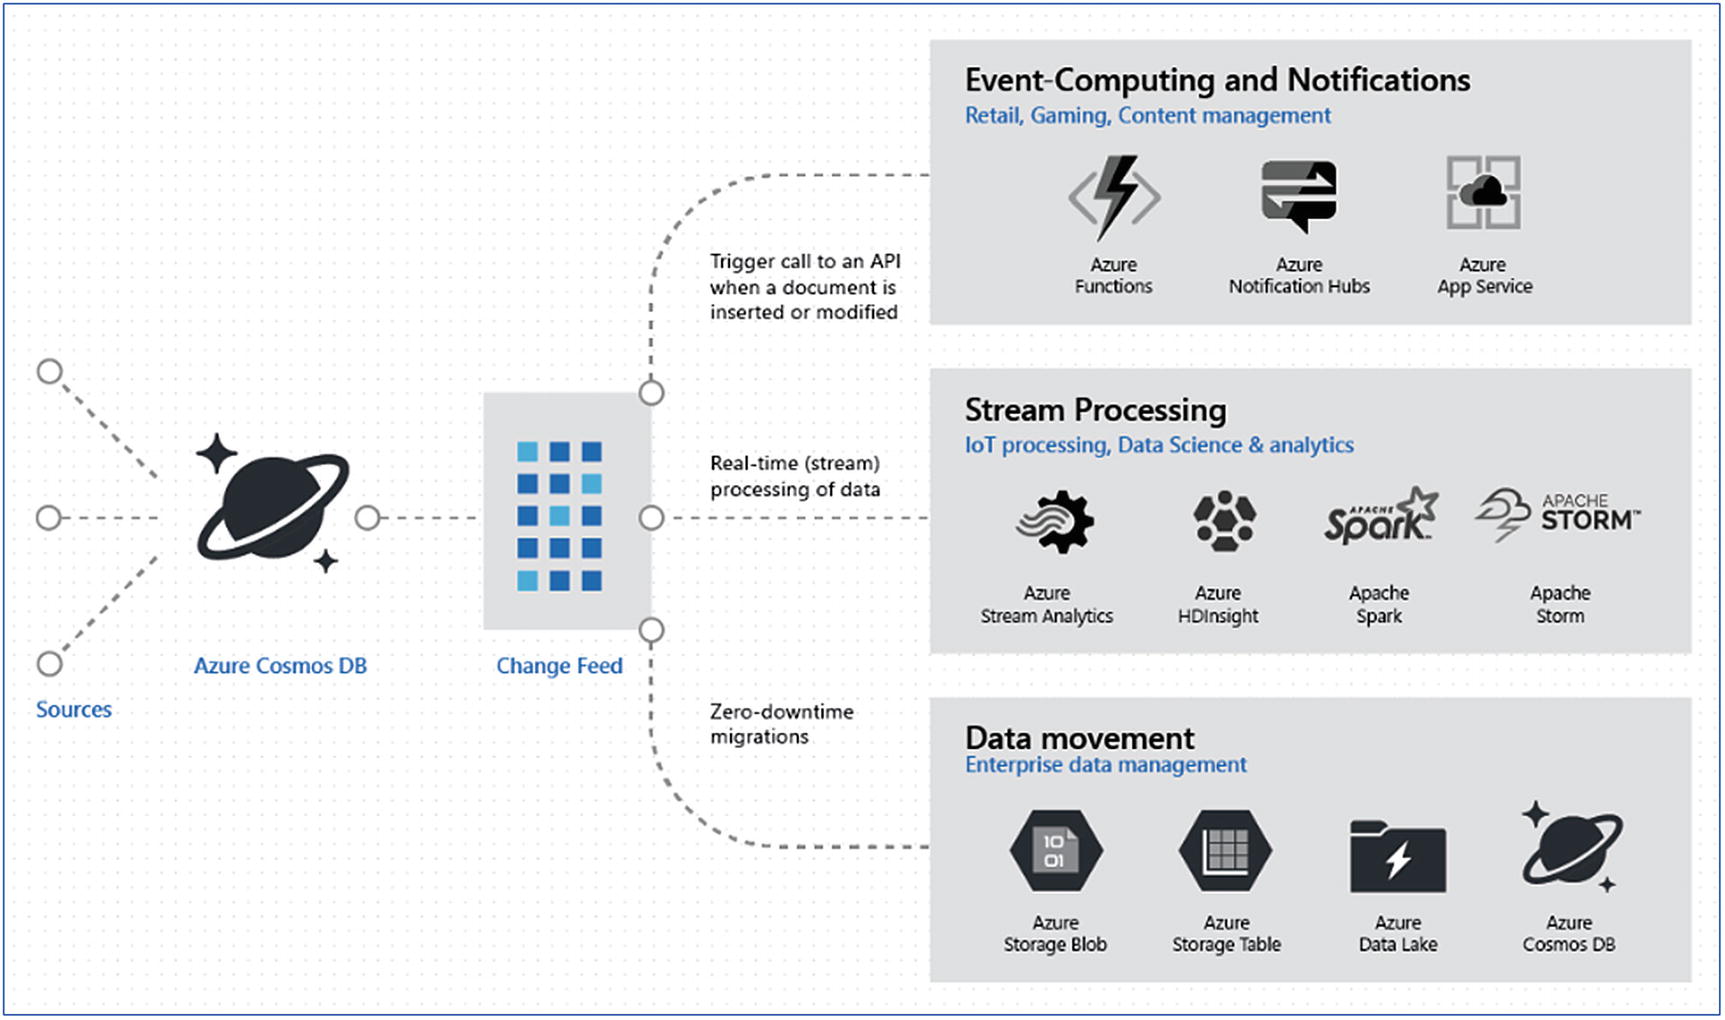
Change feed: Change feed in Cosmos DB tracks all the changes done in a container. It then sorts the list of documents in the order in which the change was applied. This feature gives lots of flexibility to notify the users using Azure functions, invoke event hubs, or store data directly into the storage layer (Figure 8-11).
Change feed scenarios
- 2.
This feature can be useful in IoT scenarios to raise alerts for a specific event like temperature rising above a certain threshold, or notifying the end users if part of some machinery is malfunctioning. Moreover, there are applications that directly write to Cosmos DB and may not need the complete lifecycle of a data analytics solution. Scenarios like retail, where a customer’s shopping data is stored, can use this change feed functionality to understand what items were removed or added to the cart. Accordingly, product recommendations can be made to upsell more products or maybe pass some discounts to get a successful purchase.
Change feed can be read by either a push or pull mechanism. Under push, there are two ways to invoke further actions: Azure functions or change feed processor. For pull, only the change feed processor can be used. In the Cosmos DB console, there is an option to select Azure functions. When the Azure functions option is clicked, the following (Figure 8-12) is invoked; check various output options to process the change feed. Figure 8-12
Azure functions output options
However, Azure function service should be created prior to clicking this option.
- 3.
HTAP scenario: As shown in Figure 8-13, real-time IoT data is coming through the stream analytics job and landing in Cosmos DB. Using the analytical store feature, this data can be replicated to Synapse sink and can be processed further using Spark notebooks or SQL queries.

IoT predictive maintenance scenario

Enable analytical store
- 1.
Enable Synapse link in Cosmos DB under features setting
- 2.
Set Analytics store to “ON” while creating a new container
- 3.
Click ok to create the container.
- 4.
Go to the Synapse workspace and Click the Data tab.
- 5.Under the Linked tab, you can add the Cosmos DB database by adding the following information:
- a.
Select Connect to external data
- b.
Select the API (SQL or MongoDB).
- c.
Select Continue.
- d.
Name the linked service.
- e.
Select the Cosmos DB account name and database name.
- f.
(Optional) If no region is specified, Synapse runtime operations will be routed toward the nearest region where the analytical store is enabled.
- g.
Select Create
- a.

Query Cosmos DB data in Synapse workspace
This capability of Cosmos DB makes data analytics extensible and builds multiple layers using Synapse Analytics capabilities.
In summary, under the model and serve phase of a data analytics solution, new features of Cosmos DB, Synapse Analytics, Spark ML, and Power BI provide lots of features and flexibility for IoT, retail, ecommerce, etc. Data can be either shown directly in a dashboard or used to trigger another data pipeline and leverage ML and Spark, which can be used to enhance real-time response of an application. With these technologies the possibilities are endless, and data can be transformed into various forms to extract maximum output.
Now, let’s get into the model and serve scenarios of data coming from batch mode data processing.

Data analytics solution architecture before Synapse Analytics
Scenario 1, for the data coming in real-time, has been discussed in the preceding section. Now, let’s discuss scenario 2: batch mode data processing. In this scenario, generally the delay of a few hours is acceptable. ELT jobs bring the data at regular intervals, and the transformation engine kicks in accordingly during the day and puts the data in the model and serve phase.
In the model and serve phase, under batch mode, the most preferred technology is Azure Synapse Analytics (formerly called SQL DW). By the time the data is transformed, there is always a structure to it, and putting it in a structured data store is always a preferred choice. However, it can go into any other preferred technology solution under this category.
If Azure Synapse Analytics (SQL pool) isn’t needed to run 24/7, Azure Analysis Services comes into the picture; it acts as a caching layer, which needs to be refreshed multiple times during the day. The entire BI and dashboarding can be served from this layer, and Azure Synapse Analytics can be activated on-demand to refresh the cache. However, there can be scenarios where the SQL pool needs to run 24/7.
Azure Synapse Analytics is much more than an SQL DW (MPP) offering; it has got Spark, SQL MPP, and orchestration under one workspace called Azure Synapse Analytics workspace. Let’s understand a little more about this technology solution in the following section.
Azure Synapse Analytics
Azure Synapse is a limitless analytics service that integrates data warehousing, big data, and data integration in one place. This capability has disrupted the way data analytics and advanced data analytics solutions could be built. Let’s understand how the solutions were built earlier and how these are anticipated to change with the new features in Azure Synapse Analytics.
- 1.
Ingest data from different sources using Azure Data Factory (ADF).
- 2.
Store the data into Azure Data Lake Storage or Blob storage.
- 3.
Use Spark to crunch and transform the data.
- 4.
Apply ML using Spark ML or other ML services.
- 5.
Load the data in SQL DW using ADF.
- 6.
Build cubes and dimensions in Azure Analysis Services.
- 7.
Build dashboards using Power BI on top of Azure Analysis Services.
- 1.
Ingest data from different sources using pipeline feature under Synapse Analytics workspace.
- 2.
Store the data into Azure Data Lake Storage or Blob storage.
- 3.
Create Spark pools to crunch and transform the data using Spark notebooks.
- 4.
Apply Spark ML using Spark notebooks in the same workspace.
- 5.
Pick up the data in SQL pools using PolyBase with an SQL query (no need to manually insert data again using ADF).
- 6.
Build cubes and dimensions in Azure Analysis Services outside the Synapse workspace. This step is optional but can save lots of money, as there wouldn’t be any need to keep Synapse Analytics SQL pool running all the time.
- 7.
Build dashboards using Power BI on top of Azure Analysis Services.
Technically there is no change, but now everything could be done under a single Azure Synapse workspace without manually moving data between different components.
Currently, Synapse Analytics is in public preview, and multiple changes are expected until it’s generally available. However, let’s explore a little more about these components.
- 1.Synapse SQL: Complete T-SQL–based analytics—Generally available (GA)
- a.
SQL pool (GA)
- b.
SQL on-demand (preview)
- a.
- 2.
Spark: Deeply integrated Apache Spark (preview)
- 3.
Synapse pipelines: Hybrid data integration (preview)
- 4.
Studio: Unified user experience (preview)
- 1.
SQL pool: It’s a provisioned Azure SQL DW instance that will be continuously running to process the queries. It’s charged based on the data warehouse units under the Compute optimized Gen1 tier and units under the Compute optimized Gen2 tier.
- 2.
SQL on-demand: This is a new offering which can be spun up on demand. It’s for ad hoc analytics and data transformation requests. It’s charged based on the TBs of data scanned in the queries and is a serverless service.
Moreover, there is an option to select either an SQL on-demand or SQL pool instance before executing the query.
Apache Spark – This is another capability available in the Azure Synapse Analytics workspace. This is a service that can be provisioned as an Apache Spark pool. This service can be spun with a minimum of three nodes (i.e., one driver and two workers). Spark notebooks can be written on this Spark cluster, and this data can be picked up SQL using PolyBase seamlessly.
Synapse pipelines – This is an orchestration engine that is like ADF and is part of the Synapse Analytics code base. In fact, the interface is also like ADF, and the concept of linked services and pipelines, etc. is also the same.

Synapse workspace interface
Data - Under data, all the database, storage accounts, and even Cosmos analytics data falls under this option.
Develop – Under develop, the option to create SQL script, Spark notebook, Data flow, or Spark job definition can be created.
Orchestrate – Under orchestrate, the ETL/ELT pipelines can be configured. It’s a similar canvas as ADF has.
Monitor – Under monitor, pipelines, SQL script, and Spark jobs can be monitored.
Manage – Under manage, all the resources created under this workspace can be managed; even security can be configured under this option.
The coming sections discuss the other technologies like Azure Analysis Services and Power BI, under the model and serve phase/
Azure Analysis Services
Azure Analysis Services (AAS) is a fully managed platform as a service (PaaS) that provides enterprise-grade data models in the cloud. It supports Analysis Services tabular models, which enables any tabular models to be moved into Azure.
Using data from multiple data sources, defining and calculating metrics, and securing your data in a single, trusted tabular semantic data model is enabled by using advanced mashup and modeling features that AAS has to offer. The data model provides an easier and faster way for users to perform ad hoc data analysis, using tools like Power BI and Excel. In the traditional world, SSAS was used for cached reporting. AAS offers this very experience and more for the cloud.
Azure Analysis Services lets you govern, deploy, test, and deliver your BI solution. It is the engine powering the Power BI Premium platform.
Enterprise grade analytics engine with built-in schema
Create and Deploy: Tabular models (1200 compatibility) including Direct Query, Partitions, Perspectives, RLS, and Translations
Manage: Fully managed PaaS; up to 100 GB memory; SSMS & XMLA management APIs; pause and resume; elastic scale up/down (GA); 99.9% uptime SLA (GA)
Consume: Interactive query performance over large datasets; simplified view over complex data; data models; single model for one version of the truth; full MDX and DAX support. Offers perspectives to define viewable subsets of model focused for specific business reporting
Easy integration with Azure services: Secure role-based data access through integration with Azure Active Directory (AAD) . Integrate with ADF pipelines for seamless controlled model development and data orchestration. Lightweight orchestration of models using custom code can be leveraged with the Azure Automation and Azure functions.
DevOps friendly: Version control; scale out for distributed client query
Power BI
Power BI is the business intelligence offering from Microsoft that delivers beyond the quintessential dashboards and visualizations. The Power BI platform is a collection of software services, apps, and connectors that work together to give coherent, visually immersive and interactive insights out of your varied data sources.
The Power BI platform comprises three apps: Power BI Desktop, Power BI Pro, and Power BI Premium. A citizen user can now do data analysis, modeling, and reporting, which were originally supposed to be done only by business analysts or data scientists.
A Power BI dashboard is a single page, often called a canvas, which tells a story through visualizations.
Power BI Desktop – It’s a free version that can be installed on your desktop.
Connectors to 70 cloud-based and on-premises sources
Rich widgets and visualizations
Storage limit of 10 GB per user
Data relationships between tables and formats autodetected
Export your reports to CSV, Microsoft Excel, Microsoft PowerPoint, and PDF
Save, upload, and publish to the Web and Power BI service
No app workspaces; no API embedding
No email subscriptions
No peer-to-peer sharing
Power BI Pro – This is the upgraded version of Power BI Desktop, which allows you to create unlimited dashboards, reports, and share across the organization. Power BI Pro has one-user licensing.
Ability to embed Power BI visuals into apps (PowerApps, SharePoint, Teams, etc.)
Share datasets, dashboards, and reports with other Power BI Pro users
Can create app workspaces
Peer-to-peer sharing
Native integration with other Microsoft solutions (Azure Data Services)
Power BI Premium – For large organizations that require sharing and hosting of datasets across the organization without individual licensing, Microsoft offers Power BI Premium, a hosted service (SaaS). Power BI Premium provides dedicated hardware and capacity hosted by Microsoft for reliable and consistent performance. Power BI Premium includes several other workloads, including dataflows, paginated reports, and AI—apart from datasets. You have an ability to scale up and down the service tiers as per consumptions.
Import: Import the data into Power BI for small data sources and personal data discovery.
Direct query: Connect directly to Synapse in order to avoid data movement and delegate the query movement to the back-end source there by leveraging its compute power.
Composite models and aggregation tables: Keep summarized data local within the Power Bi Premium workspace and get detail data from the source. Composite models are individual datasets that support tables with direct query, import, or both—all in a single dataset.
Prep and model your data with ease. Save time and make data prep easier with data modeling tools. You can ingest, transform, integrate, and enrich data in Power BI. Supports self-service Power Query
Ability to embed Power BI visuals into apps (PowerApps, SharePoint, Teams, etc.)
Larger storage sizes for extended deployments compared with Pro licensing
Apart from the aforementioned options, there is another unique offering recently launched on Microsoft Azure called Azure Data Explorer. Let’s understand how Azure Data Explorer can disrupt the way data analytics solutions are built.
Azure Data Explorer
Interactive analytics on terabytes and petabytes of data is a challenging job. Azure Data Explorer (ADX; Figure 8-18) helps to solve this challenge well by analyzing billions of rows in seconds. ADX is an analytical service that customers can use for doing real-time analytics on data that is streaming from IoT devices, applications, websites, and other sources. It includes a rich query engine that is optimized for low latency in JSON and lightning flush query performance. It’s a fully managed Cloud Service.
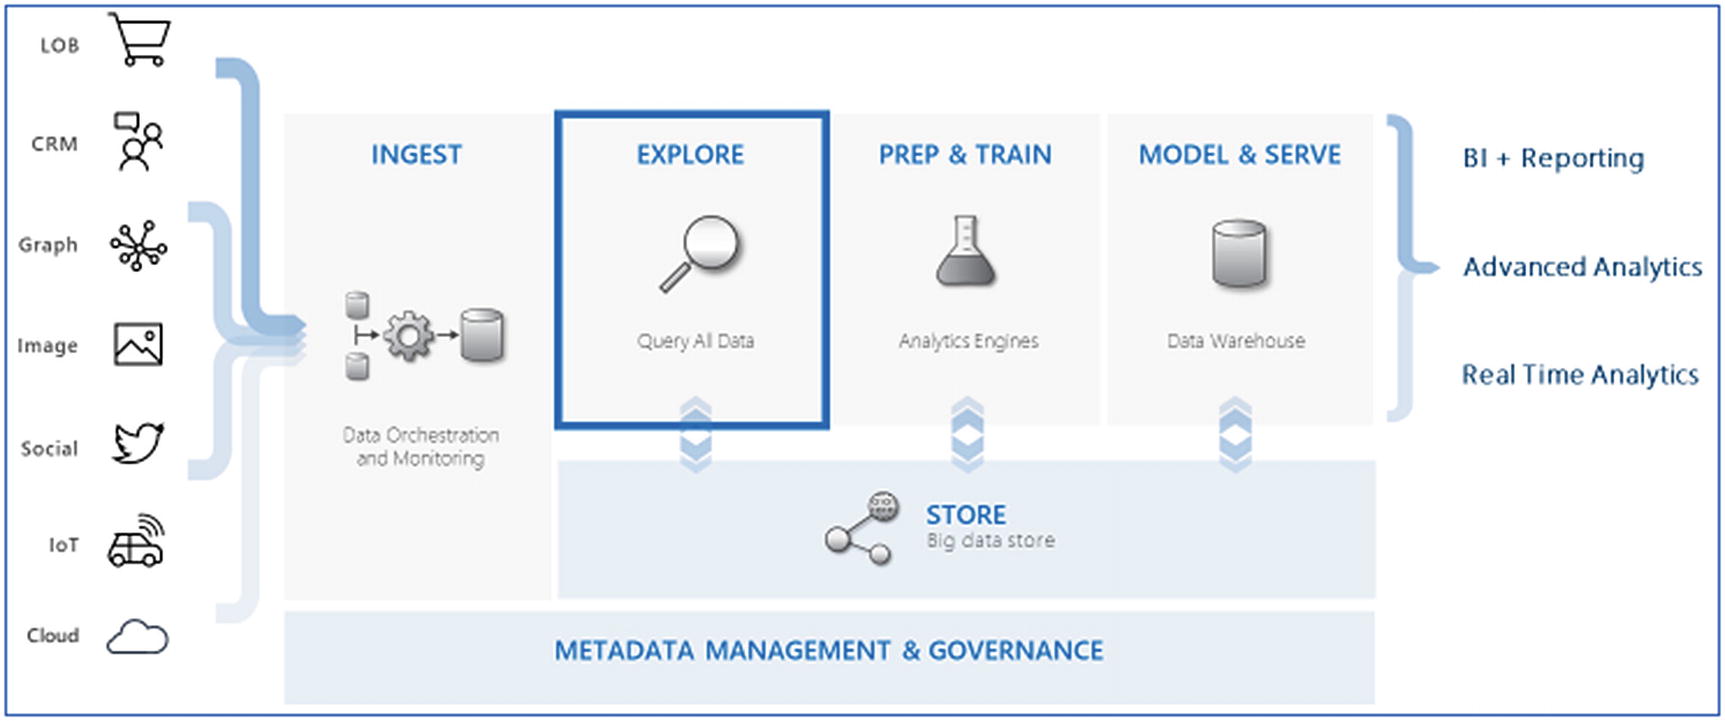
Explorer phase
Hence it gives users the possibility to handle different scenarios in the same database. So, you don't have to query one database for searching data and another database for aggregations; one can perform everything in one database (i.e., search and also run analytical queries).
ADX provides native connectors to Azure Data Lake Storage, Azure SQL Data Warehouse, and Power BI and comes with an intuitive query language so that customers can get insights in minutes.
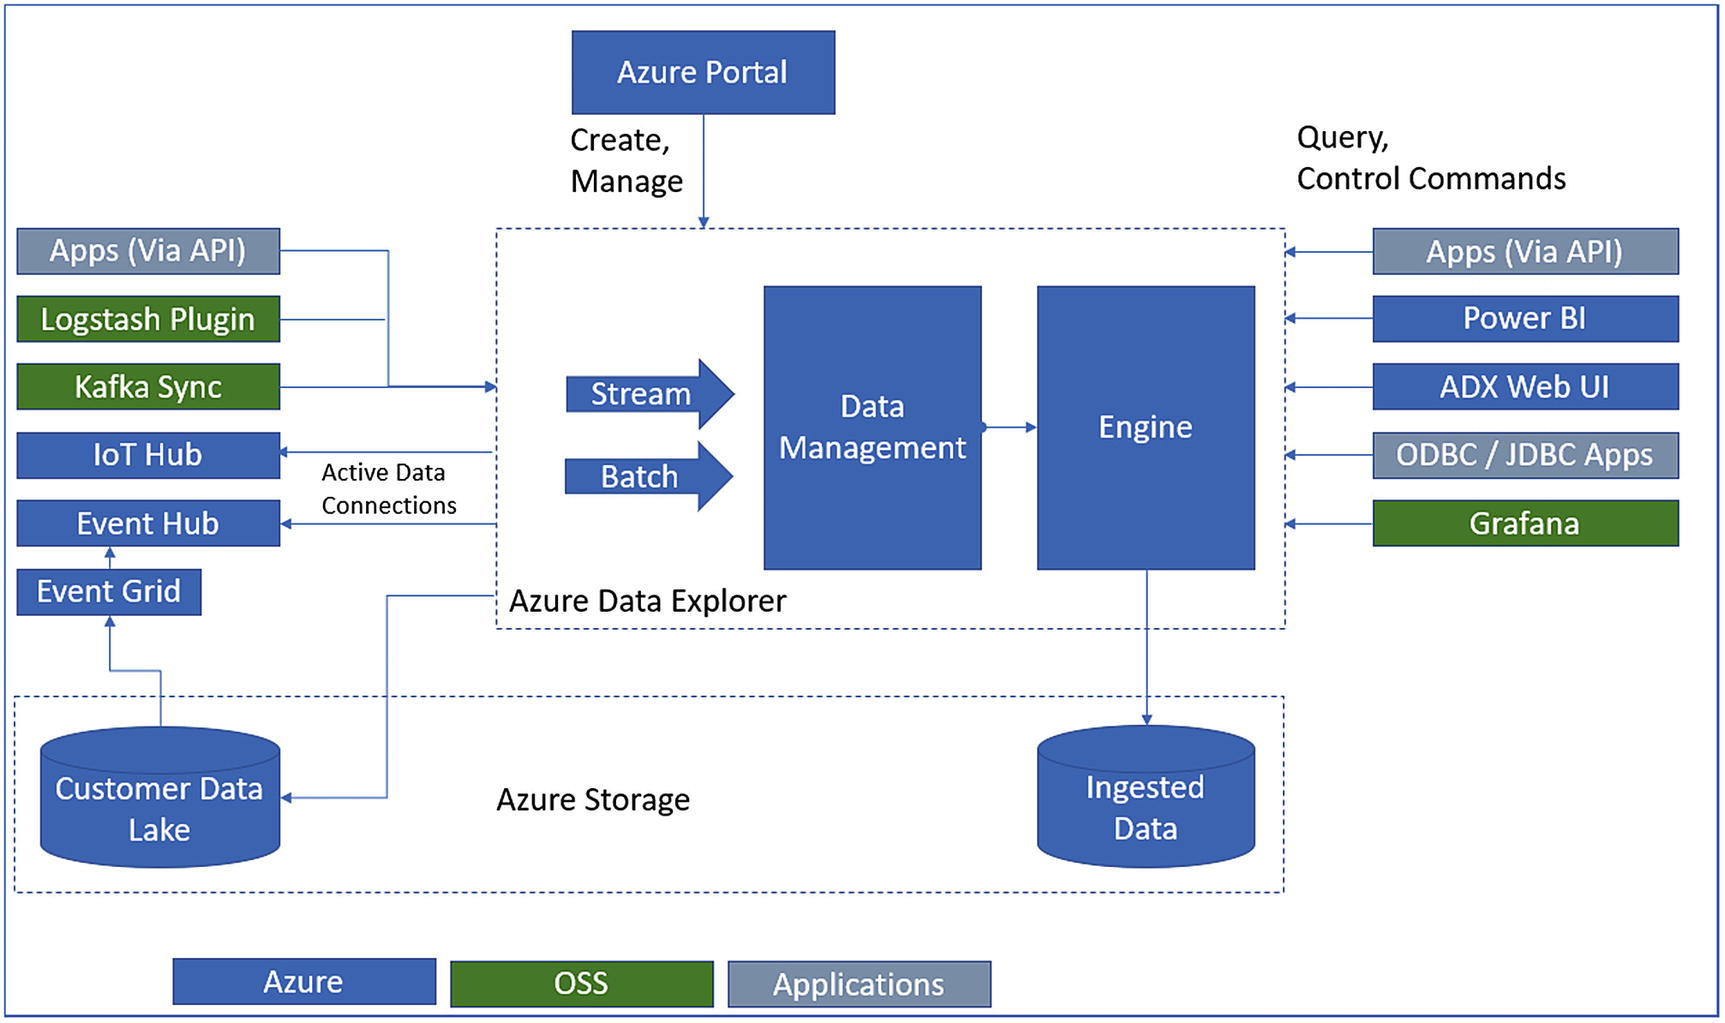
Azure Data Explorer architecture
The Data Management (DM) service ingests different sorts of crude information and oversees failures, backpressure, and performs information prepping tasks. The DM service likewise empowers quick information ingestion through techniques like autoindexing and compression.
The Engine service is liable for handling the incoming raw information and serving client queries. It utilizes a mix of autoscaling and data sharding to accomplish speed and scale. The read-only query language is intended to make the syntax simple to peruse, write, and automate. The language gives a characteristic movement from one-line questions to complex information handling contents for proficient query execution.
- 1.
Create database: Create a cluster and then create one or more databases in that cluster.
- 2.
Ingest data: Load data into database tables so that you can run queries against it. Data ingestion could be in batch or streaming mode.
- 3.
Query database: Use our web application to run, review, and share queries and results. It is available in the Azure portal and as a stand-alone application. In addition, you can send queries programmatically (using an SDK) or to a REST API endpoint. ADX provides Kusto Query Language (KQL) for querying the data.
Operator/Function | Description |
|---|---|
Filter/Search/Condition | Find relevant data by filtering or searching |
Filters on a specific predicate | |
Searches all columns in the table for the value | |
take | Returns the specified number of records. Use to test a query |
Adds a condition statement, similar to if/then/elseif in other systems | |
Produces a table with the distinct combination of the provided columns of the input table | |
Date/Time | Operations that use date and time functions |
Returns data in various date formats | |
Sort and Aggregate Dataset | Restructure the data by sorting or grouping them in meaningful ways |
Sorts the rows of the input table by one or more columns in ascending or descending order | |
Counts records in the input table (for example, T) | |
join | Merges the rows of two tables to form a new table by matching values of the specified column(s) from each table. Supports a full range of join types: flouter, inner, innerunique, leftanti, leftantisemi, leftouter, leftsemi, rightanti, rightantisemi, rightouter, rightsemi |
union | Takes two or more tables and returns all their rows |
range | Generates a table with an arithmetic series of values |
Visualization | Operations that display the data in a graphical format |
render | Renders results as a graphical output |

Azure Data Explorer interface

Azure Data Explorer interface
Link to clipboard
Link query to clipboard
Link, query, results to clipboard
Pin to dashboard
Query to Power BI
So, in summary, why should you use Azure Data Explorer (ADX)? Well, because ADX is a fully managed data analytics service that can be embedded in SaaS applications to build multi-tenant or single-tenant SaaS analytics solutions for time series logs, events, transactions, and security data. No infrastructure management or maintenance is required. You create and manage the cluster using Azure Portal. ADX supports advanced analytics, geospatial analytics, and model training or you can use your own model for: scoring of time series data, anomaly detection, forecasting, regression, and to incorporate inline Python and R. ADX has a query editor with powerful intelligence and built-in visualization, support, and sharing and ADX provides deep integration with popular dashboard tools. There is a rich connecting ecosystem that allows you to easily create business workflows, bi-directional data, and lake integration with external tables that enable you to provide a unified query experience and achieve deeper insight and continuous export of information assets. ADX is a big data platform that supports near-real-time insight over petabytes of data. ADX supports high-throughput ingestion and includes a streaming mode with sub-second response time for queries spanning billions of records. ADX instantly analyzes freshly ingested data in its raw format, and ADX can automatically scale as your business grows or shrinks.
Summary
This chapter explored the options like Cosmos DB HTAP capabilities, Synapse Analytics workspace, and Azure Data Explorer that are completely new capabilities added to Microsoft Azure. These technologies are going to accelerate the adoption of data analytics solutions multifold. The model and serve phase deals with data modeling and consumption, and the previously discussed options make it easy to build and consume. Not only useful for dashboards, these features can also be used to further trigger events, feed data to other applications in real time, and make these solutions of endless scale.