
14
Scheduling Extract Refreshes
In the previous chapter, we discussed keeping data fresh for our data flow outputs using Tableau Prep Conductor. We are going to explore keeping data extracts created in Tableau Desktop and in the web client up to date using the scheduling service of Tableau Server and Cloud. We will also look at the role Tableau Bridge plays in making on-premises data available on Tableau Cloud.
In this chapter, we’re going to cover the following topics:
- How to set up and run schedules
- Using schedules with subscriptions
- Tableau Bridge – what it is and when to use it
Technical requirements
For the complete list of requirements that are needed to run the practical examples in this chapter, please see the Technical requirements section in Chapter 1.
In this chapter, we will be using the web client of Tableau Server or Cloud.
We will be using the following file in the exercises in this chapter:
- Product Sales.csv
The files used in the exercises in this chapter can be found at https://github.com/PacktPublishing/Data-Modeling-with-Tableau/.
How to set up and run schedules
We have discussed how to create extracts from both Tableau Prep Builder and Tableau Desktop and each of their corresponding web clients. We will now look at how to schedule extract refreshes for extracts created in Tableau. We will start by creating a published data source from the web client:
- Sign in to Tableau Server or Cloud. From the home page, click on the New button and select Published Data Source, as seen in Figure 14.1:
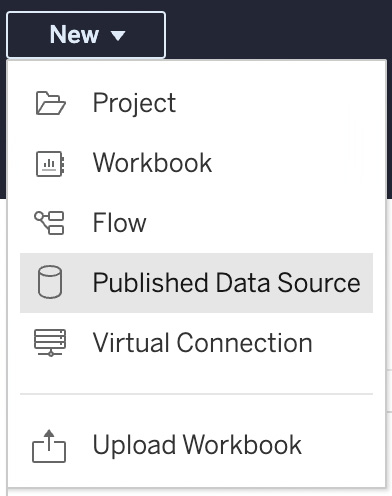
Figure 14.1 – A new published data source

Figure 14.2 – Upload file to create a data model
- When prompted, find the Product Sales.csv file from your computer and click on Open. You will be taken to the New Data Source web client. Click on the Data Source tab on the bottom left-hand corner of the screen, as seen in Figure 14.3:
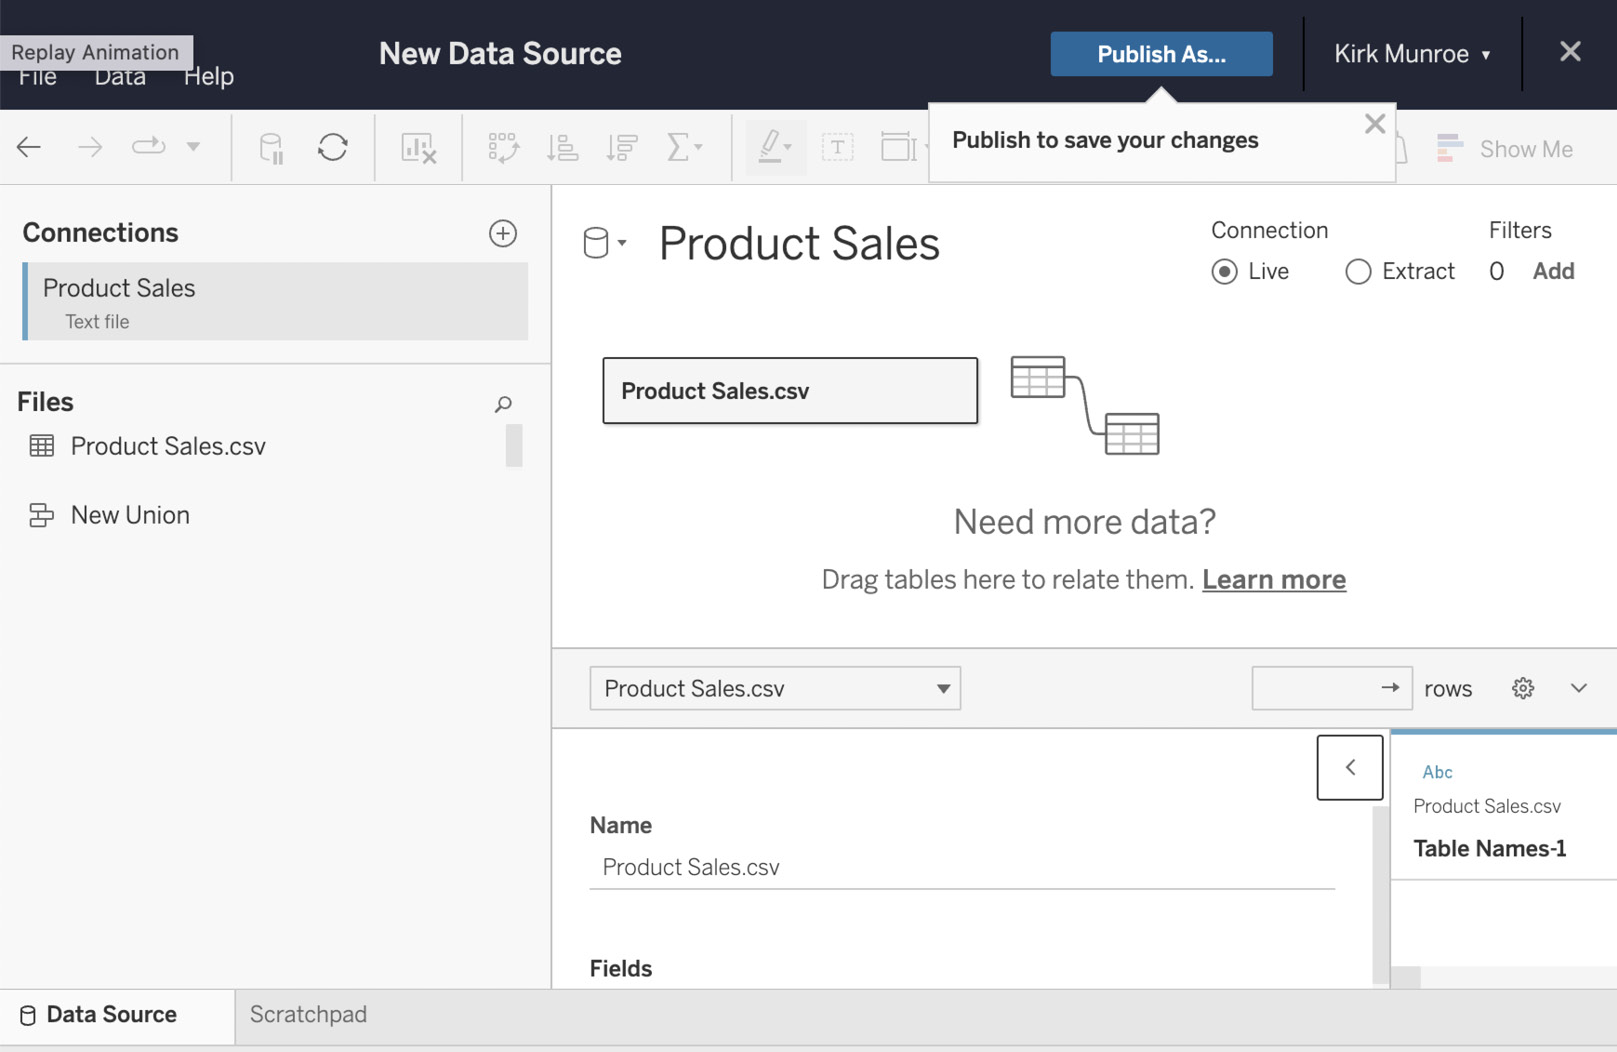
Figure 14.3 – Data source page of the published data source web client
- Click on the Extract button on the top right-hand corner of the data source page. A link to Create Extract will appear. Click on the Create Extract link, as seen in Figure 14.4:

Figure 14.4 – Create Extract button
- We will then be warned that the extract will take time to create and be given a chance to delay the creation of the extract. We would like to create our extract now, so click on the Create Extract button, as seen in Figure 14.5:

Figure 14.5 – Create Extract warning
- After our extract is created, the next step is to publish our data source. Click on the Publish As… button, which is on the right in the top ribbon as per Figure 14.6:
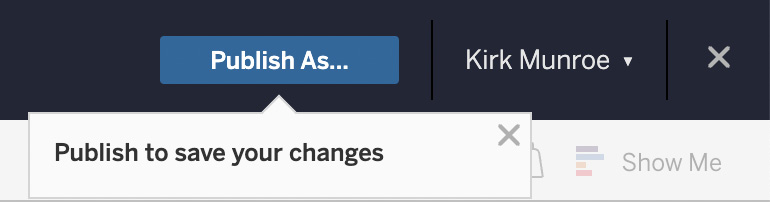
Figure 14.6 – Publish As button
- Select the Sales project and leave the name as Product Sales. Click on the Publish button, as seen in Figure 14.7:

Figure 14.7 – Publishing to a project
- We now get a message dialog box telling us that our data source has been published successfully. Click on the Product Sales link to go to our data source page, as seen in Figure 14.8:

Figure 14.8 – Publish success dialog
- We now get a message dialog box letting us know that publishing is complete. The dialog also gives us the option to schedule our refresh. Click on Schedule Extract Refresh, as seen in Figure 14.9:
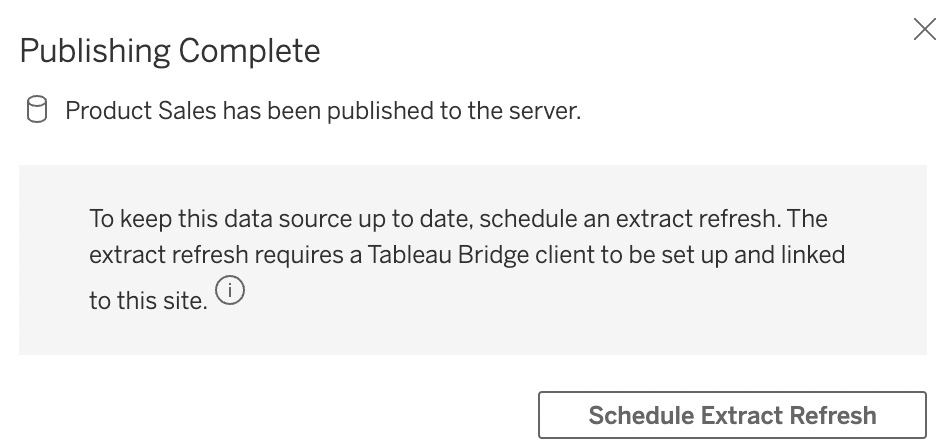
Figure 14.9 – Schedule Extract Refresh
- We are now presented with the Create Extract Refresh dialog, as seen in Figure 14.10. The scheduler gives us the following options:
- Full Refresh or Incremental Refresh – In our case, we only have a Full Refresh option because we are connected to a file. When we are connected to a data server, we can use a field, typically a data field, and set an incremental refresh to update the data since the last time an extract was run.
- Refresh Frequency – If we are using Tableau Online, this allows us to set the schedule at a granular level; we get to set when it repeats, how often, the time of day, and even which days of the week and the time zone. If we are using Tableau Server, we pick from the schedules set up by our server administrator.
Explore the different options and then click Create to create our scheduled refresh:
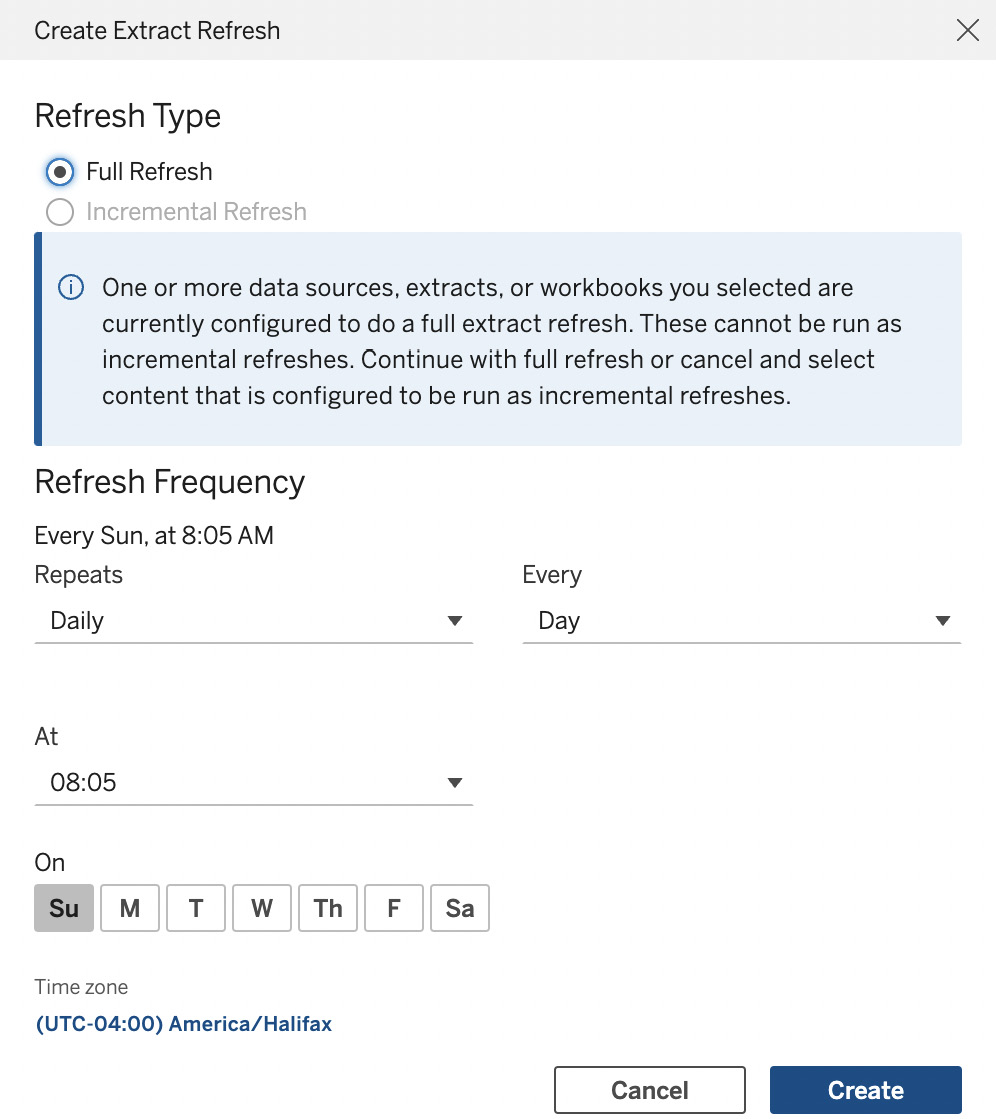
Figure 14.10 – Create Extract Refresh
- We will now be on the Ask Data tab of our data source. Click on the Extract Refreshes tab. We will see our refresh in the list. Click on the … icon in the Actions column, as seen in Figure 14.11. We see that we can manually kick off an extract by selecting Run Now…, change our schedule with Change Frequency…, or Delete…. For now, click away from the drop-down to dismiss it. Stay on this page as we will pick up from here in the next exercise:
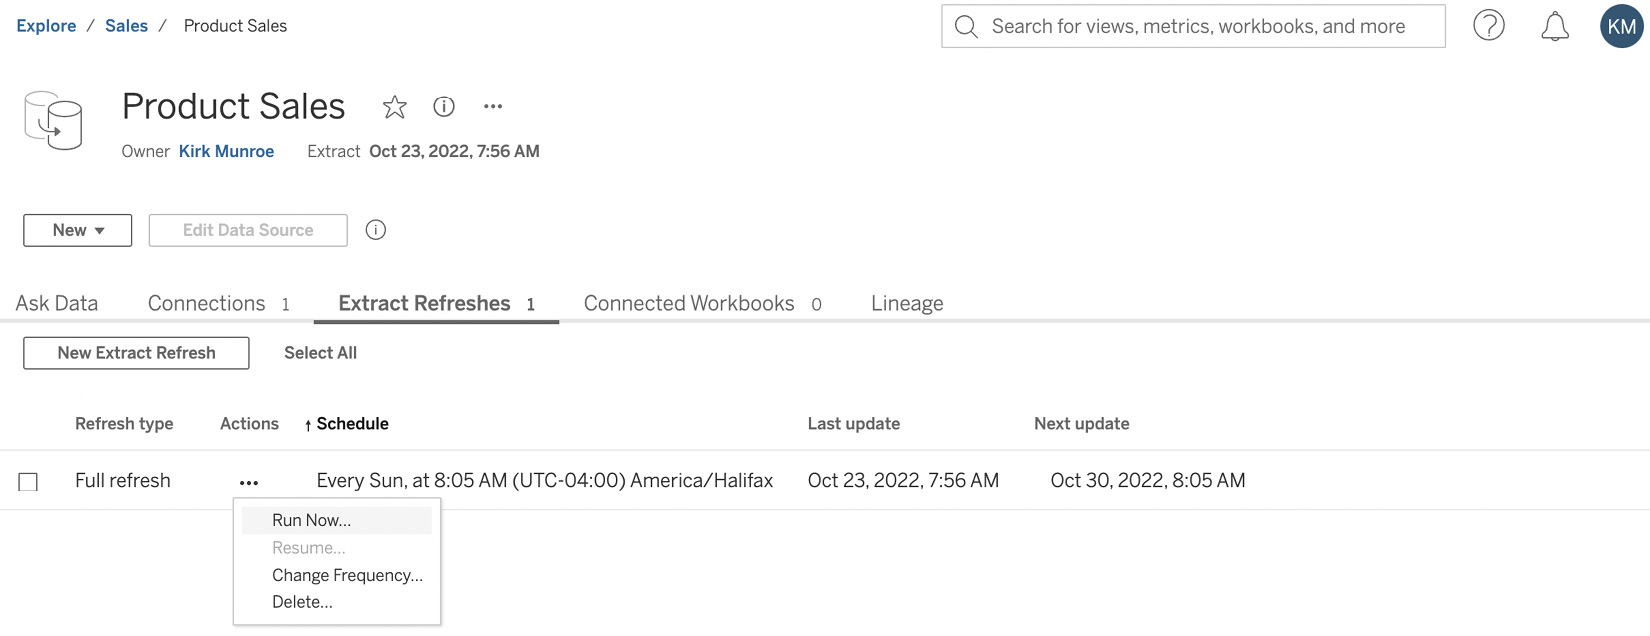
Figure 14.11 – Extract Refreshes tab
In this section, we learned how to create extract refresh schedules on Tableau Server or Cloud. Schedules allow us to automate extract refreshes without having to run them manually.
We will look at how consumers of the workbooks created from our published data sources can create subscriptions to let them know when data has been refreshed.
Using schedules with subscriptions
We often want the consumers of workbooks created from our data source to be alerted when the data has been refreshed. We can enable this through subscriptions. We will now look at how to create a subscription, picking up from where we left off in the previous exercise. In order to create a subscription, we first need a workbook using our published data source:
- From our Product Sales page on Tableau Server or Cloud, click on New | Workbook using this data source, as seen in Figure 14.12:
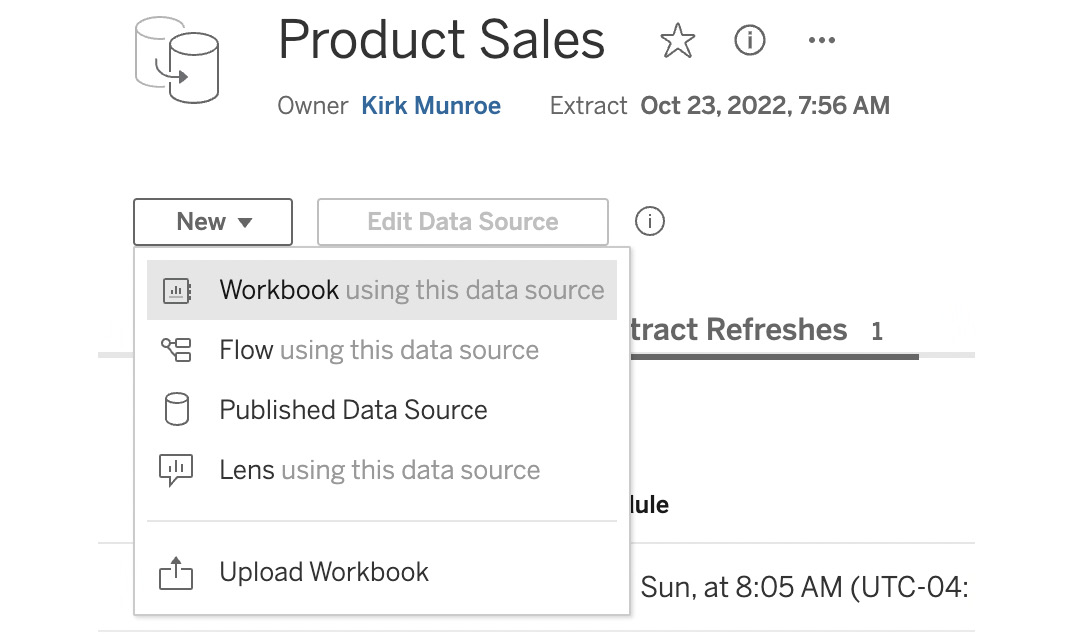
Figure 14.12 – Creating a new workbook
- Now, we just need to create a simple workbook and publish it to expose the subscription experience. Double-click on Sales and then double-click on Ship Mode. We now see a bar chart of Sales by Ship Mode. Click on the Publish As… button in the top right-hand corner. When the publish dialog comes up, enter Subscription Example in the Name field, leave all other default options, and click Publish, as seen in Figure 14.13:
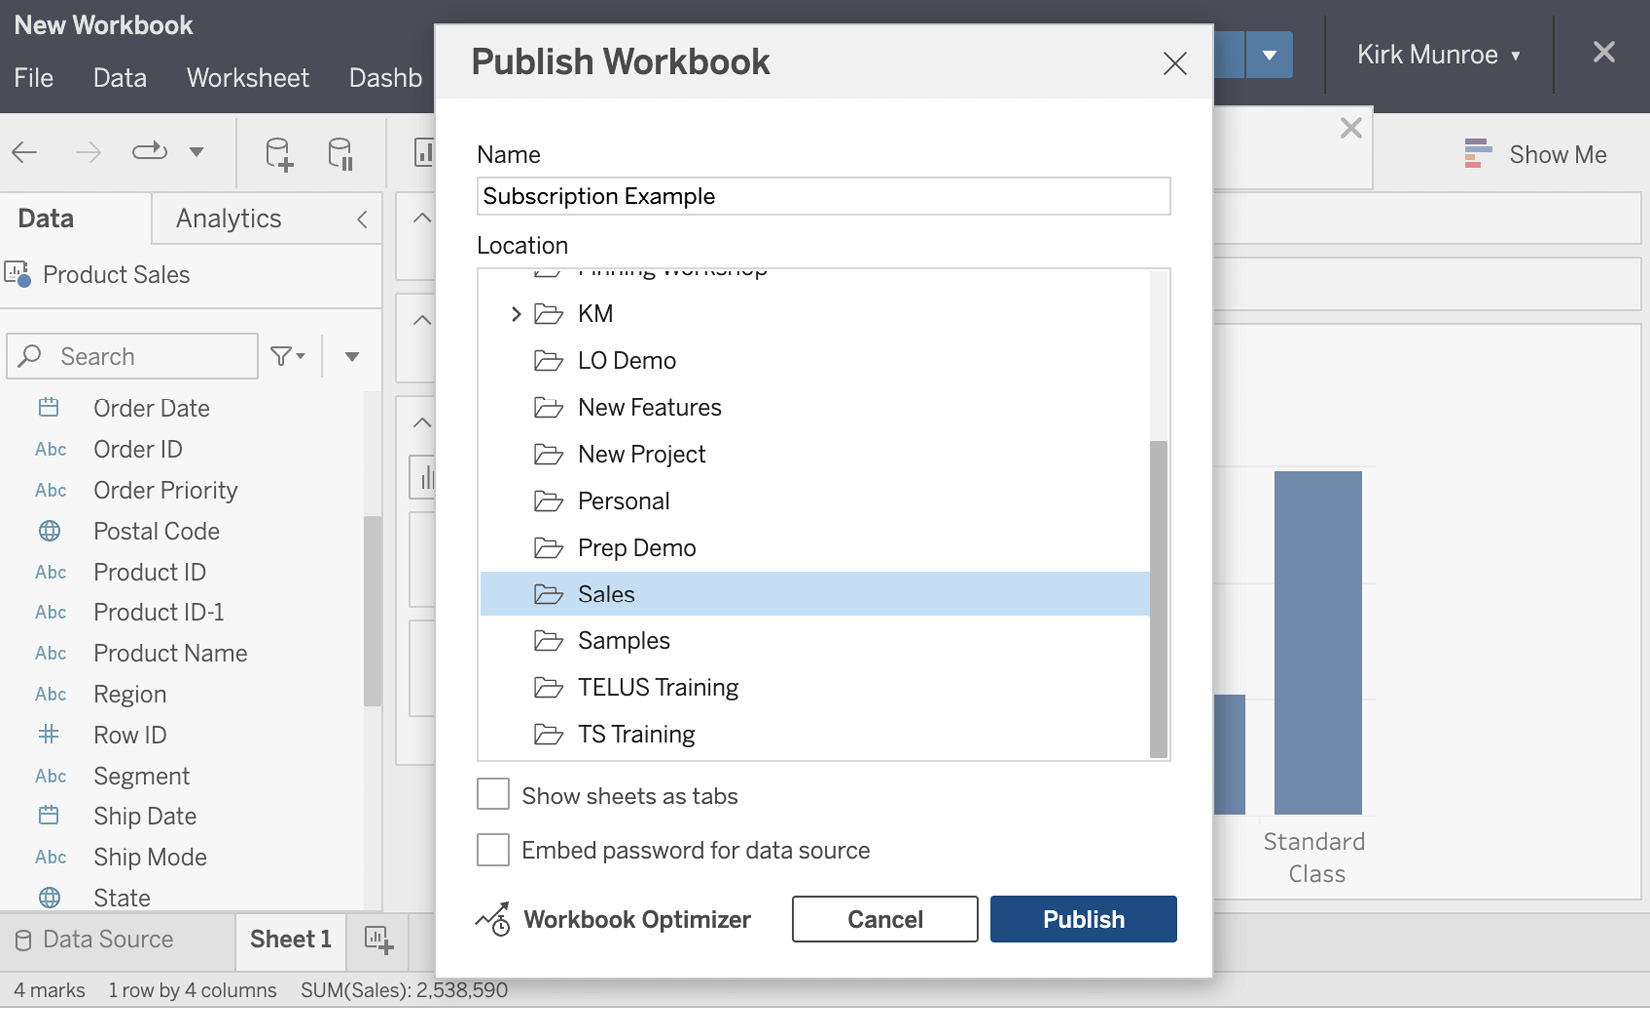
Figure 14.13 – Publishing our workbook
- We will now see an alert at the top of our screen letting us know the workbook has been published, as seen in Figure 14.14. Click on the Go to workbook link:

Figure 14.14 – The workbook has been published alert
- We are now on the page for our workbook. If our workbook had multiple sheets, they would be listed on this screen, as seen in Figure 14.15. We only have one sheet, so click on Sheet 1:
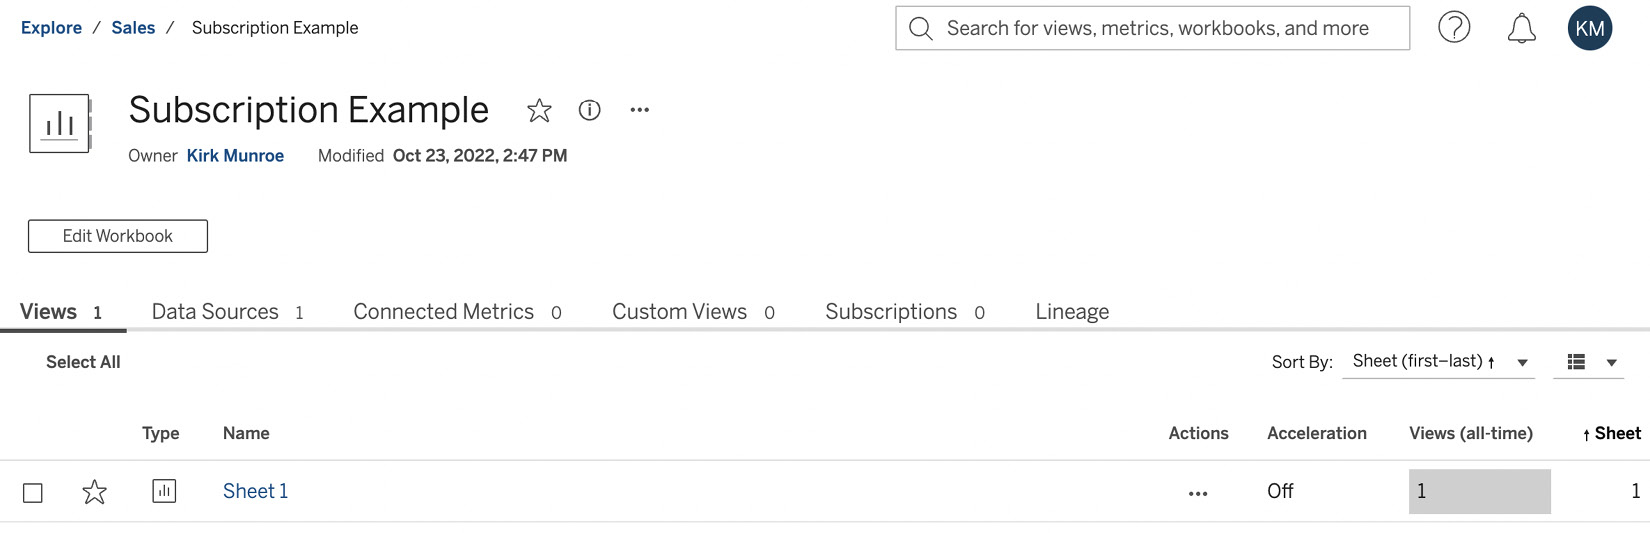
Figure 14.15 – Workbook page
- We are now on the screen that is the experience the consumers of the workbook will have. The option that we want to look at now is subscriptions, which can be found under Watch. Click on the Watch button on the top right-hand side of the screen to see our options, as in Figure 14.16. In this exercise, we will be looking at subscriptions. The other options are Metrics, which allow users to create and then monitor key numbers that they deem to be important. The Alerts function is like subscriptions except they notify only when a certain threshold, which the user sets, is met in the data:
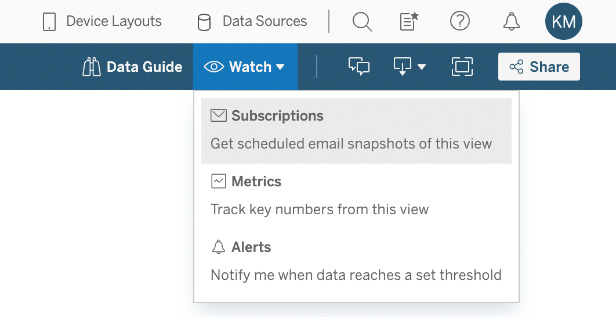
Figure 14.16 – Creating subscriptions
- Click on the Subscriptions option to bring up the subscriptions dialog, as seen in Figure 14.17. We have several options available to us as follows:
- Subscribe Users and Subscribe Me – We can subscribe other users, subscribe ourselves, or both. In our example, [email protected] has been added to the subscription.
- Include – We can include information and the link to the sheet or dashboard from where the subscription is created or to the entire workbook.
- Format – Choices are images, PDF, or both.
- Subject – The subject of the email. In our example, the text Data has been refreshed has been typed into the subject.
- Message – Optional text for the body of the email that will be sent.
- Frequency – There are two options. The first is to subscribe to a schedule. This option gives the same choices as the schedules we explored in the previous section of this chapter. The second option, and the one selected in our example, is When Data Refreshes. This is the option through which we want to let people know that new data is available:
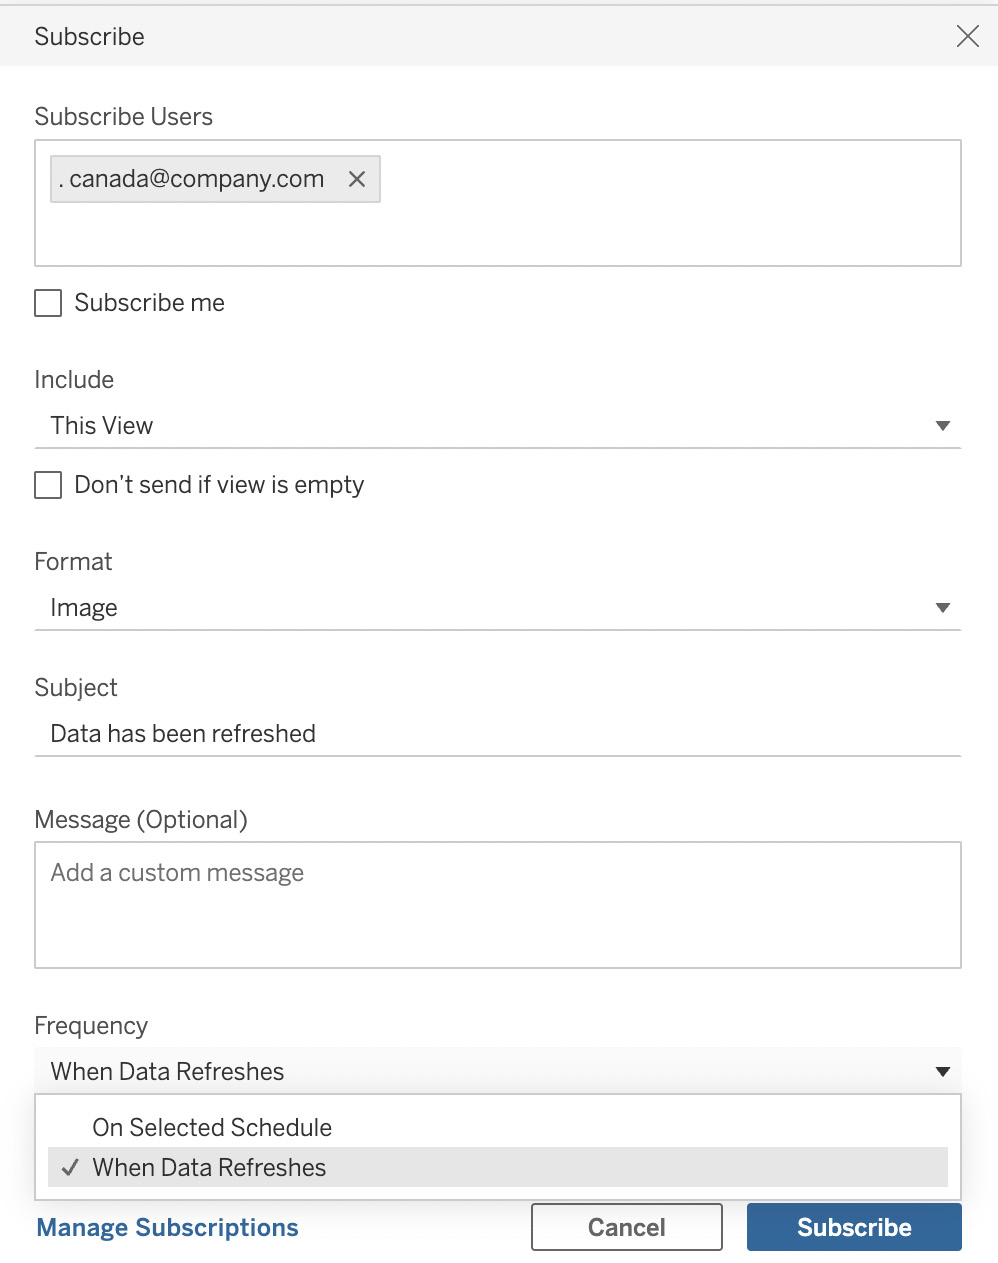
Figure 14.17 – Subscribe dialog
- Click on Subscribe to create our subscription. We will leave our exercise here as we have seen how to create a subscription on the condition of our extract refreshing.
In this section, we learned how to create subscriptions to notify end users when the published data source in their workbook has been refreshed. This is a key feature that works with extract refreshes to make sure key people are notified when data is refreshed.
We will explore Tableau Bridge to learn how to keep data fresh with on-premises data with Tableau Cloud in the next and final section of this chapter.
Tableau Bridge – what it is and when to use it
When we are using Tableau Server inside our organization, Tableau Server needs to be able to access the data. A few factors need to be considered. If we are using text files, they need to be in a directory accessible from Tableau Server. If we are using data servers, the drivers for the data servers need to be installed on Tableau Server and Tableau Server needs to be able to access the data server over the network or in the cloud.
When we are using Tableau Cloud, access might need an extra step and Tableau Bridge might be required. If we are using Tableau Cloud with public cloud databases, a direct connection for both live connections and extracts is straightforward if the data server is a listed Tableau Cloud connection. Tableau Cloud already has the drivers we need installed.
When we are using data servers or files from inside our organization (on-premises data) with Tableau Cloud, if we want the connection to be live or if we want to use extract refresh schedules, we need to use Tableau Bridge.
Tableau Bridge is a free client that we can download from https://www.tableau.com/support/releases/bridge. Tableau Bridge is only available as a Microsoft Windows application or service. To run it from a Mac, we must run it in a Windows virtual machine.
After installing the Tableau Bridge client, all scheduling works the same as the exercise earlier (see the How to set up and run schedules section) in the chapter. The client can be launched from the Windows system tray. The screenshot in Figure 14.18 shows what the Tableau Bridge UI looks like when connected to a published data source called Sales for Bridge. We can decide whether to run Tableau Bridge as an application or a service. If it is run as an application, the user needs to be logged in to the machine for Tableau Bridge to run. If the computer is logged in to Tableau Cloud, refresh schedules will run and live connections will be available:
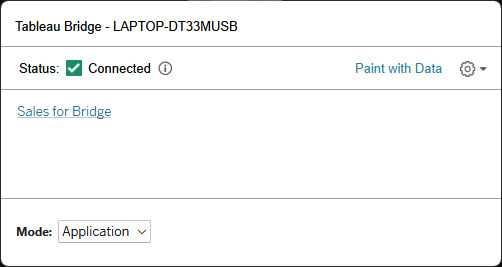
Figure 14.18 – Tableau Bridge client user interface
The Tableau Bridge client can also be configured on the Tableau Cloud site by a Site Administrator, including setting up multiple clients to achieve scale with many published data sources.
Creating an exercise to run a Tableau Bridge connection is beyond the scope of this book as it requires connecting a file from your local network to the cloud which could lead to security concerns. We will leave the learnings on Tableau Bridge at this point.
Summary
In this chapter, we explored how to set up and run schedules to refresh the data in extracts on Tableau Server and Tableau Online. Schedules are an important part of data modeling in the Tableau platform as they keep our data fresh in an automated fashion, helping us scale.
We also looked at using schedules with subscriptions from within workbooks on Tableau Server and Cloud. Subscriptions are a way for consumers of dashboards to be notified when new data is available.
In the final section of the chapter, we looked at Tableau Bridge. Tableau Bridge is a required component for keeping on-premises data fresh on Tableau Cloud.
The next chapter is the final chapter of our book. It will wrap up all the components we have learned throughout the book by determining which components we need by audience and use case.