2
Licensing Considerations and Types of Data Models
Tableau licensing has an impact on how a person can create and maintain data models. First, Tableau has role-based pricing for individual users of the platform. Second, Tableau has different tiers for how organizations license Tableau, which impacts data modeling capabilities.
Tableau data models are used by analysts and developers to create Tableau workbooks. Workbooks are a series of sheets, dashboards, and stories. Every workbook must be connected to a minimum of one data model. These data models can be embedded in the workbook, meaning they are only available in the workbook. Alternatively, they can be published separately and made available in many workbooks; these are called published data sources. We will create both types in this chapter.
Data models can also connect live to data sources. This means the queries from the model are serviced by the underlying data server. Data can also be extracted into the Tableau data engine, called Hyper. We will learn about both types of connections in this chapter.
Tableau also provides the capability to put a layer between the data model and the underlying data server through a virtual connection. We will also explore virtual connections in this chapter.
This chapter will give you the foundational knowledge of how data modeling fits into the Tableau platform. This knowledge is a crucial foundation for the exercises we will be doing in future chapters. The main topics we will be discussing are how Tableau connects to and publishes data and the licensing considerations for which users can perform these tasks.
In this chapter, we’re going to cover the following main topics:
- Tableau roles – Viewer, Explorer, and Creator
- Tableau Data Management
- Tableau virtual connections
- Tableau published data sources
- Tableau embedded data sources
- Live versus extracted data
- The Tableau Hyper engine
For the complete list of requirements to run the practical examples in this chapter, please see the Technical requirements section in Chapter 1. The files used in the exercises in this chapter can be found at https://github.com/PacktPublishing/Data-Modeling-with-Tableau/.
Tableau roles – Viewer, Explorer, and Creator
The method Tableau uses for product licensing is important to understand as it has ramifications on the data modeling capabilities available to the user of the Tableau platform.
For Tableau Cloud and most Tableau Server deployments, Tableau’s first and primary licensing method is by user role. The three Tableau roles are:
- Viewer – This role is aimed at executives and other information consumers. A person who is assigned a Viewer role has a robust set of capabilities available to them for exploring and sharing data. As the Viewer role is aimed at the information consumer, it does not allow for the creation and maintenance of the data modeling capabilities we will learn in this chapter and throughout this book.
- Explorer – This role is aimed at business users. A person who is assigned an Explorer role can create data visualizations for themselves and others and do everything someone with a Viewer license can do. A person with an Explorer role has very limited access to data modeling features. They do not have access to Tableau Desktop and Tableau Prep Builder, two of the main components we cover in this book. They can connect to published data sources and create their own embedded data sources from flat files.
- Creator – This role is aimed at analysts. A person who is assigned a Creator role has the full capabilities of the Tableau platform. One of the primary jobs of Creators is to create and manage the data models for Explorers (and other Creators), assuming the role of Data Management and governance for the organization. The audience for this book is Creators.
Before leaving this section, we should acknowledge that two other roles exist and can determine some of the capabilities available to Viewers, Explorers, and Creators. These two roles are Server Administrator and Site Administrator. Neither of these roles is a licensed role, rather they are additional roles that are layered on top of the licensed roles. The Server Administrator role is a specific role to administer a Tableau Server on-premises deployment. The Site Administrator is a role intended for the management of content and users within a Tableau site. Tableau Server has both roles and Tableau Cloud only has the Site Administrator role, as the Server Administrator roles of installation, upgrade, and management are included in the Tableau Cloud service.
To have the role of Site Administrator, you must first be licensed either at the Explorer or Creator level.
Although we do not cover server and site administration functions in this chapter, it is important to know of the existence of these roles because both Site and Server Administrators have access to settings that could affect your ability to perform some of the tasks we do in this book. If you are working on these exercises and find you don’t have access, reach out to a Site Administrator for help.
Tableau Data Management
Starting with the 2019.3 release, Tableau enhanced Data Management capabilities with the introduction of Tableau Prep Conductor and Tableau Catalog. Since the initial release of Data Management, Tableau has continued to add and enhance capabilities. The virtual connections functions we mentioned in the first part of this chapter are an example. These Data Management features require additional licensing costs.
It is important to understand this product add-on as it enables some of the Data Management functions that layer onto the modeling capabilities we will learn about in this book. As it is a set of bundled features that are licensed on top of user roles, you might not have these capabilities available to you if your organization has not purchased Data Management licenses. To get access to these features, you can download a 14-day free trial of Tableau Cloud with Data Management enabled, as described in the Technical requirements section in Chapter 1.
Table 1.1 outlines which capabilities are available with and without Data Management licensing. For all capabilities listed, the user role is Creator:
|
Base Tableau Creator license |
Capabilities requiring Data Management |
|
|
Table 2.1 – Additional capabilities with Data Management
In addition to the data modeling capabilities that are only available with this add-on, there are also some key data governance capabilities that are included. Data lineage, data catalog, and data warnings are all included with Data Management. We will look at these features in Chapter 13.
Tableau virtual connections
Prior to the Tableau 2021.4 release, data model creation started with a direct connection to the underlying data source. This meant that data modelers would most often connect directly to enterprise database tables in their organization. This approach works well when the data modeler understands databases, but it falls short in several important ways, especially when the organization wants to delegate the role of data modeling to less technical users in the business.
If the organization is going to delegate data model creation to business users, the information technology, data engineering, and security teams will often want to ensure that the data modeler:
- Cannot have access to all the data in the database for confidentiality reasons
- Limits access to the number of tables in the database
- Ensures that analytics are not run against live tables, that is, ensures that data is extracted to an analytics store so impacting performance of the database is minimized to a scheduled window
Tableau virtual connections can only be created in the web client of either Tableau Server or Tableau Cloud. Virtual connections are intended for large organizations. For this reason, they are only available with Data Management and are only available for data servers and cloud data drives.
We will now go through the starting process for creating a virtual connection:
- Start by signing into your organization’s Tableau Server or to Tableau Cloud from your browser. If you are using your organization’s Tableau Cloud or signed up for a trial as described in the Technical requirements section in Chapter 1, the URL to enter in your browser is https://online.tableau.com.
- After entering your sign-in credentials, navigate to the home page of the Tableau interface. Once there, you will find a button labeled New. Click on this button to bring up the menu seen in Figure 2.1. From this menu, choose Virtual Connection. ( In this case, if you want to follow along in this section, taking the trial option described in the Technical Requirements section in Chapter 1 will allow you to.):
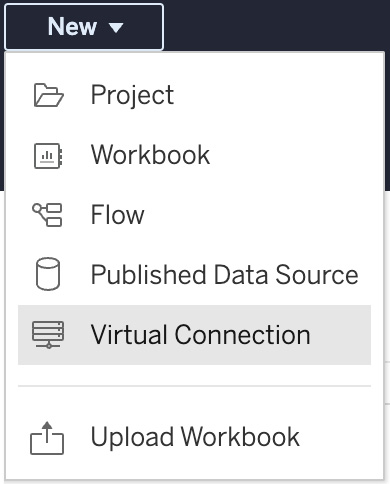
Figure 2.1 – New options on Tableau Server and Tableau Cloud
- Tableau will take you to a screen to create a connection. Unlike Tableau Desktop and Tableau Prep Builder, virtual connections are designed to work exclusively with data stored in database server technology. This means that the options for flat files, Tableau published data sources, web data connectors, and others aren’t available.
We will stop at this point, for now, and look at virtual connections in more detail in subsequent chapters. The most important takeaway from virtual connections is that they are not data models per se but a layer that sits between underlying databases and Tableau data models. Virtual connections are also not always needed in the data modeling pipeline, meaning you can create Tableau models directly on top of data sources without first creating a virtual connection.
Tableau published data sources
Published data sources are the primary method of sharing data models between analytics users. A published data source contains all the information a person will need to start creating visualizations, namely, a published data source can have the following:
- The connection string to the underlying database or the reference to a Tableau virtual connection
- Metadata changes relating to the renaming and casting of fields into new data types
- Descriptions of fields
- Embedded flat files
- Organization of fields into hierarchies and folders for easier navigation
- Reusable calculations
Published data sources can be created in three different places in Tableau: Tableau Desktop, Tableau Prep Builder, and from the home page in the web client. In this chapter, we will look at the creation of published data sources from Tableau Desktop and the home page in the web client. We will create a published data source from Tableau Prep Builder in Chapter 6, Data Output.
Let’s open Tableau Desktop and connect to the same Superstore sales 2022.csv file we used in the previous chapter:
- Open Tableau Desktop.
- Click on the Connect to Data blue hyperlink near the top left-hand side of the Tableau Desktop user interface.
- Find the To a File section and click on the Text file option. Navigate to the Superstore sales 2022.csv file at the location you saved it at on your computer. Click Open.
- Follow the prompt in the bottom left-hand corner of the application to go to Sheet 1, as seen in Figure 2.2:

Figure 2.2 – Go to Worksheet prompt upon connecting to data
- When we go to Sheet 1, we will be presented with our data model in the data pane on the left-hand side of the user interface:
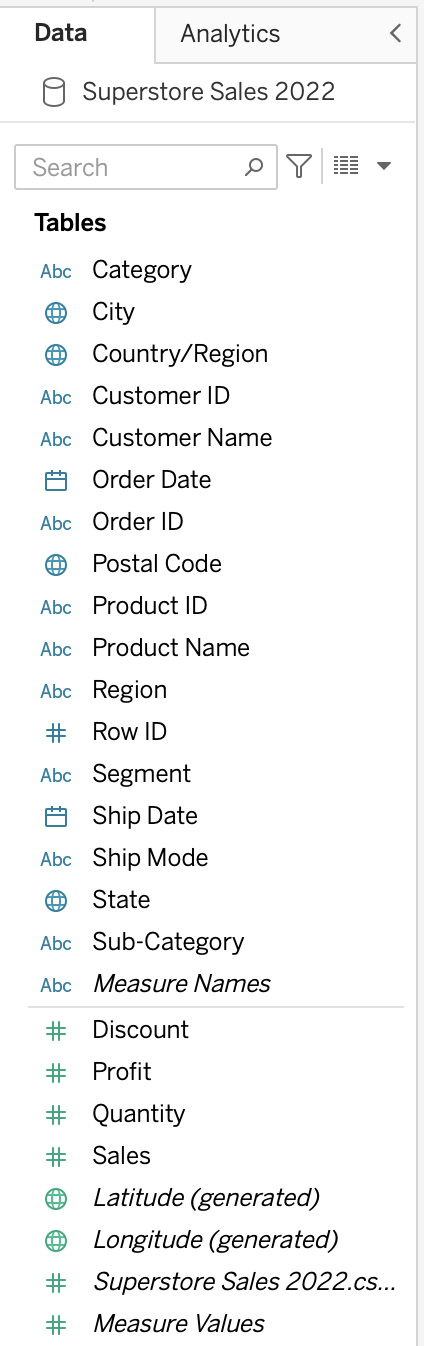
Figure 2.3 – The Tableau Desktop data pane
- In Chapter 7, Connecting to Data in Tableau Desktop, we will explore the ways in which we can enhance metadata using the data pane. For now, we want to introduce the concept of a Tableau published data source and demonstrate how to create one. From the menu bar in Tableau Desktop, select Server and then the Publish Data Source selection. Select Superstore Sales 2022, as seen in Figure 2.4. If you aren’t signed into Tableau Server or Tableau Cloud, you will be first prompted to sign in. Enter your credentials to continue:
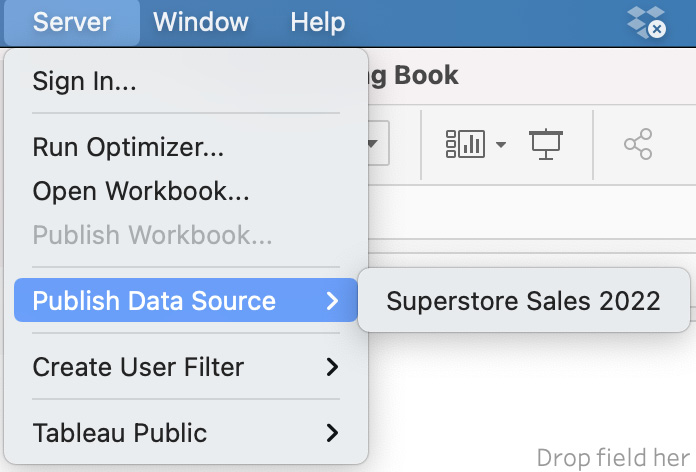
Figure 2.4 – Publish Data Source
- We are now presented with a dialog box for settings of our published data source, as seen in Figure 2.5. The first part of the dialog box asks for a Project location. Projects are the method that Tableau uses to organize and secure content on Tableau Server and Tableau Cloud. Choose the project where you want to save the published data source:
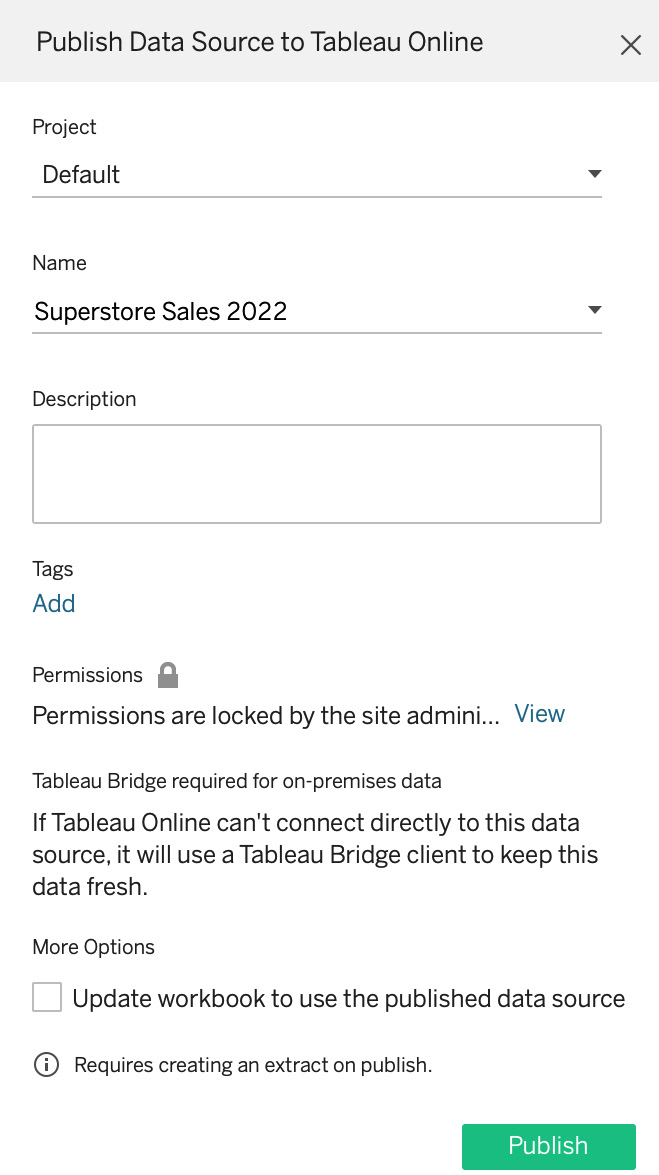
Figure 2.5 – Publish Data Source dialog box
- The next three selections are name, description, and the ability to add tags. Tags are keywords used to add in searching for content on Tableau Server and Tableau Cloud. Take the default name and leave the description and tags blank for now.
- Permissions give the ability to determine which users can access the published data source on Tableau Server or Tableau Cloud. In Figure 2.5, you will see that permissions are locked by the Site Administrator. One way to manage Tableau Server and Tableau Cloud content, including published data sources, is to lock permissions to projects. The reason for this is to separate the roles of content creators from security administrators. If the project you are publishing is not locked by a Site Administrator, you will have access to a dialogue box, as seen in Figure 2.6. You can use this to add security to your data model:

Figure 2.6 – Adding security to a data model
The last option is a checkbox that says Update workbook to use published data source? If you plan to create visual analyses in this workbook, you should check the box. This ensures that the analysis will be kept up to date when the published data source is updated. In this case, we are only using the workbook to create a published data source so leave the box unchecked.
Before we hit the Publish button, you might notice two warnings. The first is specific to Tableau Cloud. If you use Tableau Cloud with data sources that are housed within your organization’s network or on your individual computer, you will need Tableau Bridge to create a connection between the data source and Tableau Cloud. We will explore Tableau Bridge in detail in Chapter 14, Scheduling Extract Refreshes. The other message might be Requires creating an extract on publish. We will discuss extracts later in this chapter.
- Click the Publish button to publish your data source.
Tableau will now open the page to your published data source in a browser. Please keep Tableau Desktop open in the background as we will begin the next section where we left off here.
In your browser, you might see the dialogue box in Figure 2.7. For now, please disregard this dialogue box by clicking on the cross in the top-right corner.
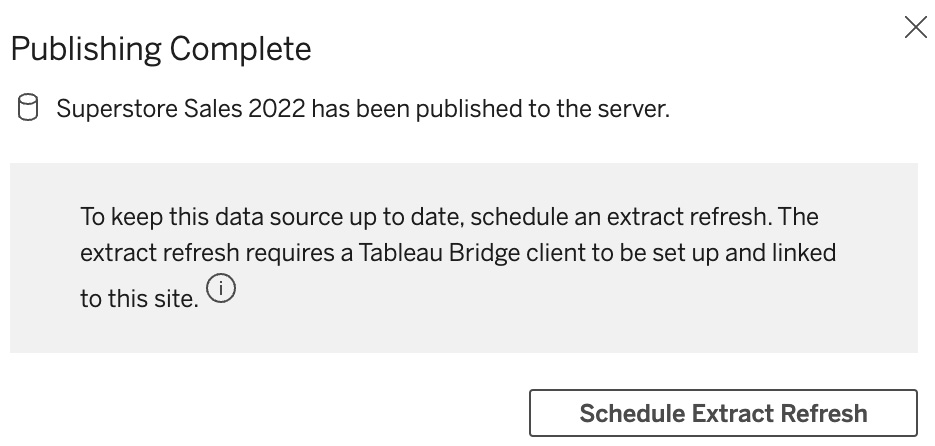
Figure 2.7 – Publishing Complete dialogue
Now that we have seen how to create and publish a Tableau published data source from Tableau Desktop, let’s look at published data sources on Tableau Server and Tableau Cloud.
Working with published data sources on Tableau Server and Tableau Cloud
We will now look at working with published data sources from the Tableau web user interface, that is, working with published data sources without needing to use Tableau Desktop:
- Click on the dropdown next to the New box. You should see the options that are available in Figure 2.8. This screenshot is from Tableau Cloud version 2022.1. One of the options is to create a new published data source and another is to upload a workbook. The other three are important to this published data source. You can create a new workbook starting with all the data modeling work you put into the data source. You can also leverage the data source as a starting point for creating a flow, which we will be discussing in the next chapter, and a lens, which we will be exploring in Chapter 12, Data Modeling Considerations for Ask and Explain Data, with Ask Data:

Figure 2.8 – The New button from the published data source in the browser
- Click away from the new dropdown options. You will see a button that enables you to edit this published data source in the browser without having to download it to Tableau Desktop first. Only the owner of the data source can edit it.
- Click on the Connections tab. This tab will show you all the information about the underlying data connections within your published data source. In our example, it is a simple connection to a CSV file. In your organization, these data connections can get more complex.
- Click on the Extract Refreshes tab and then on the New Extract Refresh button. This will bring up a dialogue box, as seen in Figure 2.9:
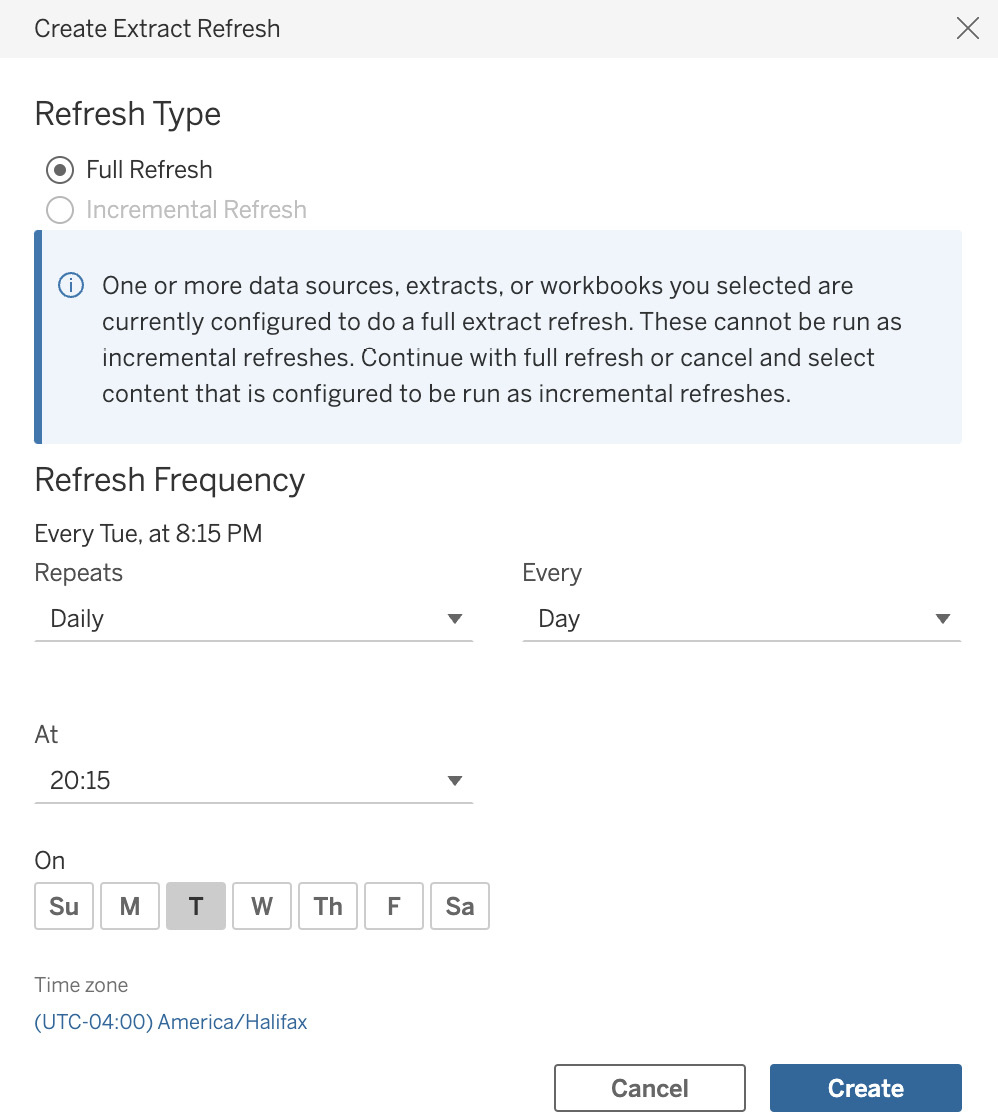
Figure 2.9 – Create Extract Refresh dialogue
- This dialogue allows you to schedule a regular refresh of your data source if you are extracting data into Tableau’s high-performance Hyper engine. You set whether you want to extract your data when you create it. You also set whether you want the refresh to be full (replace existing data) or incremental (only add new rows since the last refresh). You can schedule your refresh to run on a finely tuned schedule through this dialogue and you can always come back and change it. We discuss extracts in more detail later in this chapter.
- For now, click Cancel on the Create Extract Refresh dialogue box. The next tab we see is Connected Workbooks. We do not yet have any connected workbooks at this point. As people create workbooks from our published data source, we will be able to see them on this tab in the web user interface.
- The last tab where we see whether our Tableau Server or Tableau Cloud has Data Management enabled is Lineage. The Lineage tab shows the descriptions of all the fields in our data model as well as all the upstream and downstream connections of our model. As we see in Figure 2.10, we have not yet added descriptions to our data model, nor have we connected workbooks. We will look at these features in Chapter 13.

Figure 2.10 – Data Lineage
- Let’s look at the process of creating a published data source in the web user interface versus Tableau Desktop. Click on the New button.
- This time, we will select the option for Published Data Source. We will be asked to connect to the data source, as seen in Figure 2.11. Click on the Files tab and then upload from computer. Then find the Superstore Sales 2022.csv file that we used earlier in this chapter and click Open:

Figure 2.11 – Connecting to a data source in the browser
- Once you have connected to the file, you will see the user interface, as shown in Figure 2.12. This user interface works almost the same as the Tableau Desktop experience with a slight change in the way you publish and manage user access. To publish, click on the Publish As button and select the name of the project where you wish to publish the data source:
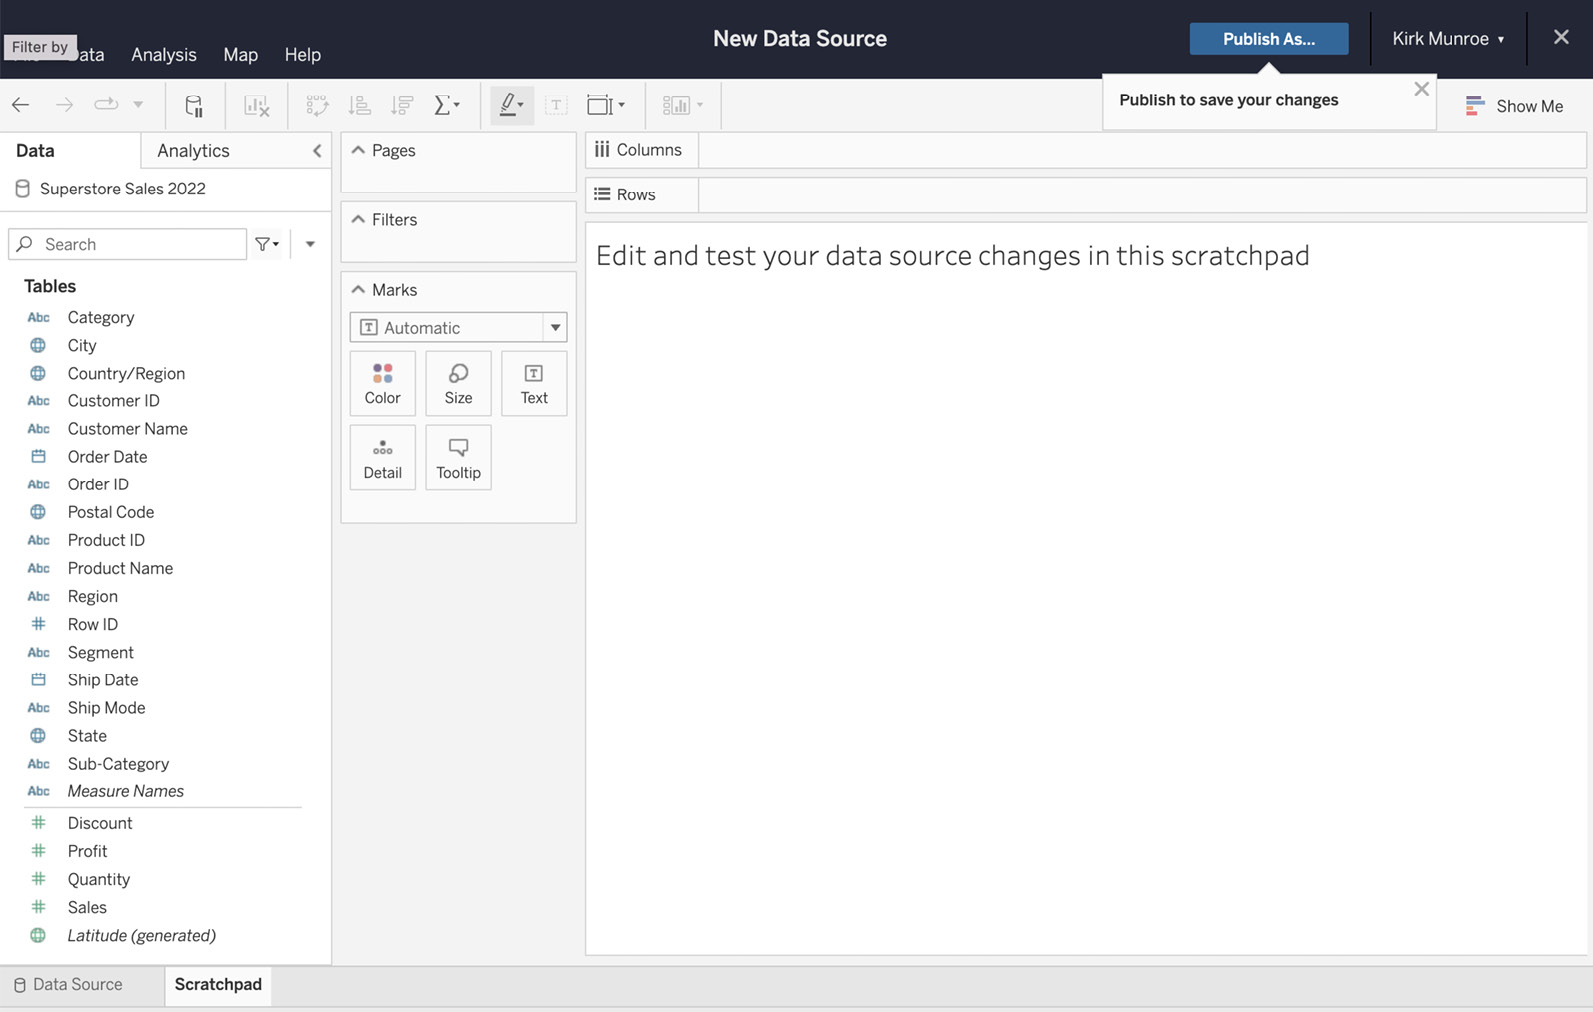
Figure 2.12 – Web client version UI to create a published data source
That covers the basics of understanding and creating published data sources, the primary method of creating shareable data models. In future chapters, we will look at creating more complex data models and publishing and maintaining them. Next, we will look at embedded data sources.
Tableau embedded data sources
The other main data source type in Tableau is an embedded data source. An embedded data source has the data model embedded within the Tableau workbook. What does this mean?
When we publish an embedded data source, we don’t publish the data source, but rather we publish a workbook that is not connected to a previously published data source. This is what makes the data source embedded. It is embedded in the workbook that has been published.
To see how this works, let’s go back to where we left off in Tableau Desktop in the previous section, namely, step 10:
- Before we publish a workbook, we need to create a chart on at least one sheet. From Sheet 1, double-click on Sales in the data pane. This will create a single bar representing all sales. Next, double-click on Region in the data pane. This will break sales up into four bars, one representing each region, as seen in Figure 2.13:
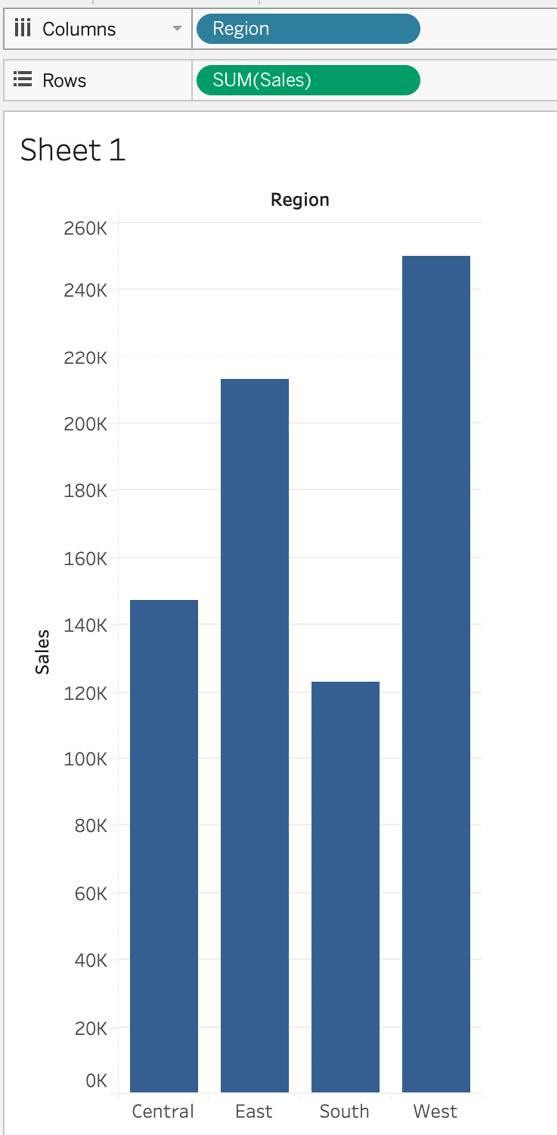
Figure 2.13 – Sales by region
- Now we have a very basic workbook that we can publish. We should rename our sheet before we publish it. On the Sheet 1 tab on the bottom right of the screen, right-click, choose Rename, and then type Sales by Region over Sheet 1 (Figure 2.14):

Figure 2.14 – Renaming a sheet
- We are now ready to publish. Go back to the Server option in the menu bar. This time, we will pick the option Publish Workbook… instead of Publish Data Source, as seen in Figure 2.15. At this point, you might be presented with a dialog recommending to create a data extract. If you are, please click on Publish Without Extract before continuing:

Figure 2.15 – Publish Workbook... menu item
- You will be presented with the dialogue box seen in Figure 2.16. Choose a project that you want to publish and change the name of the workbook to Sales by Region. Ensure that the Data Sources option says 1 embedded in workbook and click Publish:

Figure 2.16 – Publish Workbook to Tableau Online dialog box
If the Data Sources option says 1 published separately, first edit this option to Embedded in workbook as per Figure 2.17:

Figure 2.17 – Changing the data source type
- This action publishes your workbook to Tableau Server or Tableau Cloud with your data source embedded. This means that other people, with the right permissions, can download or edit a version of our workbook but they cannot connect directly to our data source. This means that if they want to leverage the data modeling work we may have done in the workbook, they have to take the entire workbook to do so.
Embedded data sources have their place in the Tableau infrastructure. For individual analysts creating workbooks where the data model is not likely to be used by others, embedded data sources make sense to avoid the overhead of managing the workbook and its data source separately.
As the main goal of this chapter is Tableau data modeling, we will spend the rest of our time focusing on creating data models that will be available for your entire organization and perhaps beyond your organization. For this reason, we are going to focus exclusively on published data sources, but it is important for you to understand embedded data sources and when they make logical sense.
Live versus extracted data
Tableau broadly gives two options for connection types for the data behind your data models. These are Live and Extract.
If you choose a live connection, Tableau will query your data source every time a user interacts with a visualization when it needs to get additional data that isn’t in the view. If you choose to extract the data, Tableau will move the data from where the data is sourced to a high-performance analytical store.
The most basic use case for live connections is when the analysis being performed needs to occur on up-to-the-minute data. When the analysis is slightly delayed, as of the end of the close of business of the previous day, for example, an extract will often make the most sense as it allows for faster query time and less impact on operational databases. These use cases often simplify the many nuisances that determine the best option between live connections and extracts. We will explore each of these considerations as they come up in the use cases we cover throughout the rest of this book.
Another use case for live connections is when your data is stored in a highly performant database that is already optimized for analytic analysis. Traditionally, this included cube technologies and in-memory database appliances. More recently, all the major cloud vendors, as well as companies such as Snowflake and Databricks, offer analytical databases as a service.
To create an extract in Tableau Desktop, navigate to the Data Source tab in the bottom left-hand corner of the screen. Near the top right-hand corner of the data source screen, you should see the option for a Live or Extract connection as per Figure 2.18:

Figure 2.18 – Changing the connection type
It is as simple as clicking the appropriate radio button and Tableau will handle the rest for you. Next up, we will discuss Tableau Hyper, the database engine that powers Tableau extracts.
The Tableau Hyper engine
Tableau extracts are stored in a proprietary database engine called Hyper. The Hyper engine is included with Tableau Desktop, Tableau Prep Builder, Tableau Server, and Tableau Cloud and therefore does not have any additional licensing requirements. In a technical sense, the term extract refers to data that is moved from its original source for the purposes of analysis. The term Hyper refers to the Tableau technology that houses and manages the extracted data. However, the terms are often used interchangeably or even together as Hyper extract. In fact, the extracted data will sit on a disk with a .hyper extension.
It is important to mention Hyper in this chapter as it is an important piece of the data modeling stack in Tableau. For the purposes of this book, we never interact with Hyper directly, but it is often at work behind the scenes when our data models are from extracted data. We have now explored published and embedded data sources and live and extract connections. We are now ready to tackle Tableau Prep Builder in Chapter 3.
Summary
In this chapter, we explored the different Tableau licensing options and how they impact us as data modelers.
We then looked at how Tableau uses data models in workbooks. We looked at embedded data sources, which are data models that are linked to one workbook and cannot be used in others. We explored published data sources as a way to share our data models to be used by many analysts and developers in the creation of their workbooks. We also looked at live and extract connections and when to use each of them.
In the next chapter, we will build on what we learned by working with Tableau Prep Builder and understanding the role it plays in creating data models.