
Chapter 7. Monitoring and Managing Greenplum
Effectively managing an MPP database shares many of the challenges of PostgreSQL database management, with some major differences due to the nature of the multi-instance architecture. Greenplum offers a set of tools to facilitate the monitoring and management of a multinode cluster. Understanding factors that have immediate effect (e.g., What is the current state of Greenplum? Why is this query running so much slower today than yesterday?) can help quickly troubleshoot day-to-day issues. Understanding longer-term issues (e.g., Which tables need to be analyzed? When should I expect my disk to fill up? What can I do to optimize frequent long queries to ease load?) ensures that issues can be proactively addressed, and rarely catch the user off guard.
Both long- and short-term issues can be addressed by Greenplum Command Center, an application bundled with Pivotal Greenplum (the commercial version of the Greenplum Database).
Greenplum Command Center
Perhaps one of the most opaque aspect of Greenplum operations is the current status of a running query. DBAs are frequently asked, “Why is my query taking so long?” The question seems simple, but diagnosing the factors that contribute to a slow query or a group of slow queries requires diving into multiple parts of the database as well as an understanding of how queries are executed in an MPP environment. Common culprits include locking and blocking of tables by competing queries or the cluster’s inablility to spare the resources to keep up with the demand of the current workload. Sometimes, a badly written query at a point of heavy workload can cause a cascading effect and block critical queries from execution. These situations can be more or less common given the Greenplum environment and normal usage, but to effectively diagnose the situation requires a monitoring tool that surfaces deep insights into all of the aforementioned factors.
Greenplum Command Center (GPCC) is an Enterprise Greenplum tool that presents DBAs with a wealth of information about Greenplum performance in a web-based interface. The current version (GPCC v4) allows the user to drill down deep into would-be issues for the Greenplum cluster, down to the query execution step. The GUI interface not only presents the information, but aims to simplify and aggregate it so that a potential problem is spotted right away. The goal is to present any user, expert or novice, with the necessary information to allow an accurate understanding of what is currently happening and what may be the underlying cause.
Figure 7-1 shows the GPCC dashboard, which provides a quick overview of the status of the Greenplum cluster.
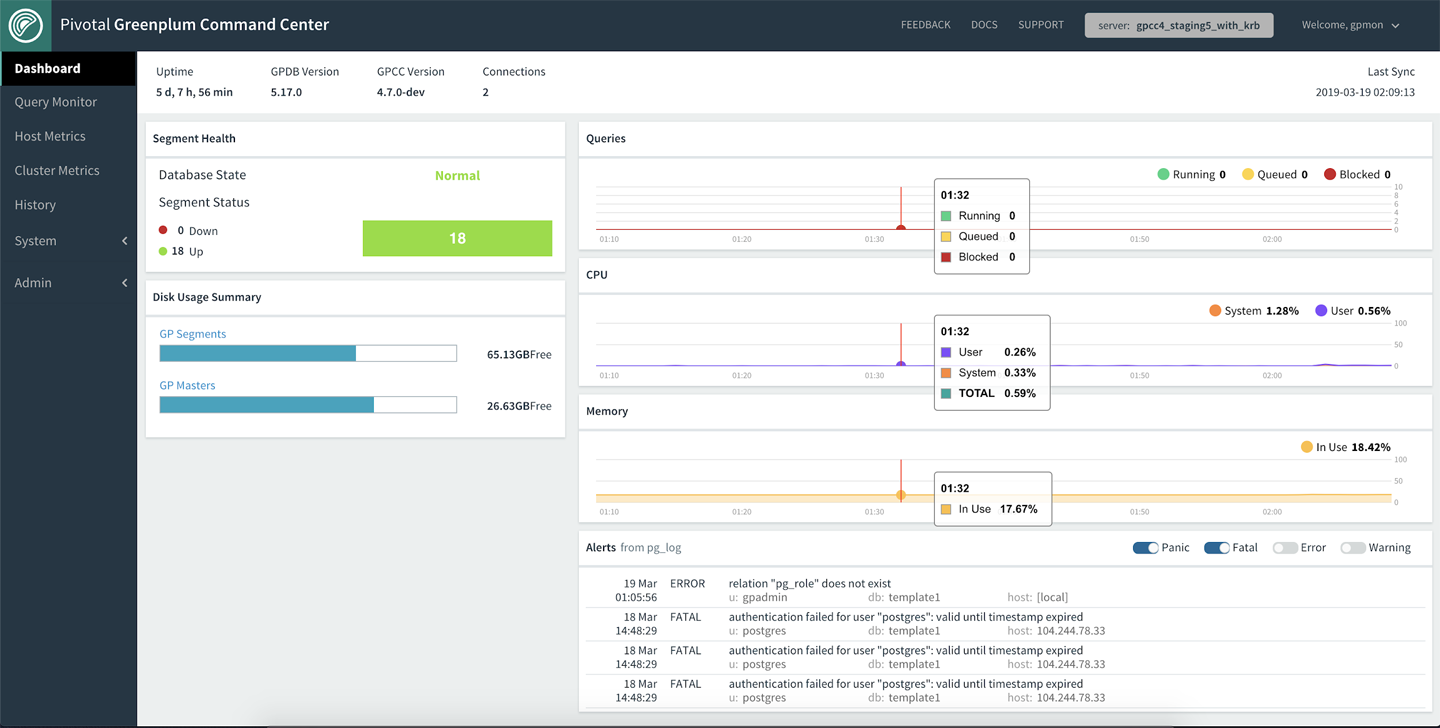
Figure 7-1. The Greenplum Command Center’s Dashboard view
At a high level, GPCC presents information about the current state of the database. The most pressing issues are highlighted on the dashboard, allowing the user to see at a glance whether there are any downed segments, whether the disk is full, or any heavy spikes in the system resource usage. Additionally, GPCC allows a deeper view into the status of any individual host. As usage skew is often an issue that plagues performance and leads to a slowdown in workload, this data is presented readily for the DBA.
In the pane on the left side of the dashboard, click the Host Metrics tab to drill down into the performance of each host and diagnose potential usage skew, as demonstrated in Figure 7-2.

Figure 7-2. Host Metrics view
One great improvement in GPCC v4: all currently running queries can be viewed in real time. With each query’s status clearly marked, it is easy to see whether the query is executing or whether it is waiting for either a concurrency slot or a table lock held by other queries. The ability to view blocking queries at a glance allows DBAs to construct a blocking hierarchy map that illustrates a chain possibly leading to the query holding up the rest. Problematic queries can be quickly identified by the spill file column, status, and runtime. With this information the DBA can either quickly cancel offending queries or drill down into their details.
Figure 7-3 shows all currently running queries as well as their status. Any queries waiting on a table lock will show “Blocked” status. Hover over the information in the “Blocked By” column to see the blocking query as well as the total time spent waiting for the lock.

Figure 7-3. Query Monitor view
For users drilling down into a specific query, the GPCC shows a number of important metrics regarding the performance, as well as a visual representation of the query execution steps. The information is summed up into data points to help users figure out how much longer the query is expected to run, and decide whether to terminate the query to release the table lock or free up system resources.
Figure 7-4 shows query details and metrics vital to understanding the query’s current performance and contribution to the overall cluster resource usage. You can expand each step of the plan for more information. You also can expand the plan to a full-page view to facilitate troubleshooting for a complex query.
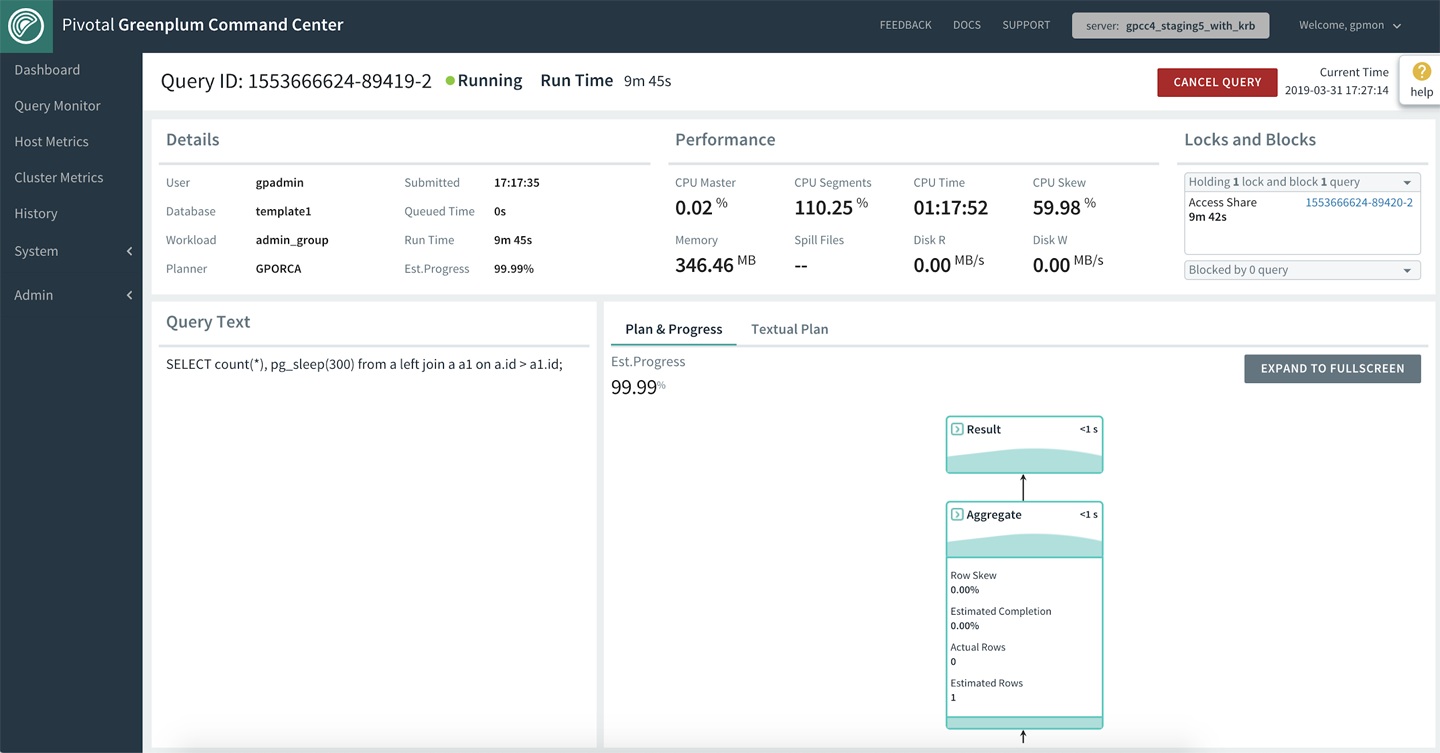
Figure 7-4. Query Details view
Beyond taking reactionary measures for ad hoc problems, GPCC also provides the DBA the ability to view historic Greenplum usage. Understanding historic trends such as “What is the busiest time of the day?” or “How does my last Tuesday compare to the current Tuesday?” can drastically improve performance by adjusting for predictable increases in workload. Additionally, the historic view allows the DBA to troubleshoot problems that occurred at some point in time in the past. For certain scenarios such as “a segment went down last night at 2 a.m.,” the ability to interactively view the cluster usage and running queries greatly aids in the investigation of any resource spikes and bad queries leading up to the failure.
Figure 7-5 shows how you can interactively narrow down potential causes and pinpoint problematic queries such as those with high skew or spill files.

Figure 7-5. Historical Queries view
After the problematic trends and problem origins are identified, the DBA can capture this information and surface alerts for cluster and query performance to proactively prevent issues before they occur. Users can specify the problem threshold, as seen in Figure 7-6, and set up GPCC to natively send alert emails via SMTP configuration. Additional alerting methods (SMS, PagerDuty, Slack, etc.) can be configured by utilizing the shell hook provided. A full list of the alert capabilities is available in the Pivotal documentation.
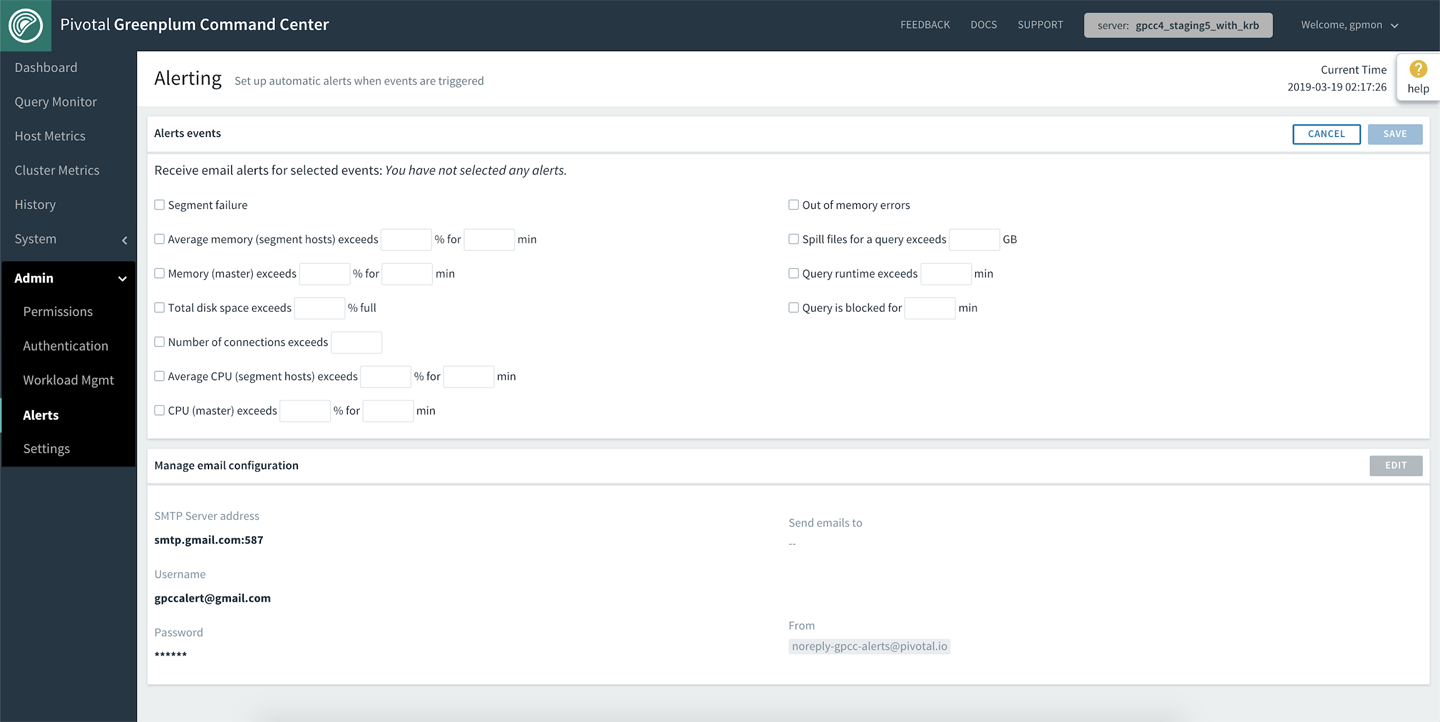
Figure 7-6. Alerts view
Workload Management
Whether it’s routine ETL or ad hoc user queries, controlling resource utilization and concurrency is important to ensure smooth database operation. Data warehouse queries with high enough concurrency can consume enough CPU, memory, and I/O to overwhelm the cluster. To control resource usage, Greenplum encompasses the concept of resource queues and resource groups. Although each controls resource usage, resource groups are a much more robust method.
Resource Queues
Prior to version 5, Greenplum used the notion of resource queues. Each user or role is associated with a resource queue. Each queue defines the limits on resources that its associated roles can use.
For example, the following two statements will create a resource queue named adhoc and associate the role group2 with the queue:
CREATE RESOURCE QUEUE adhoc WITH (ACTIVE_STATEMENTS=3);

ALTER ROLE group2 RESOURCE QUEUE adhoc;
The ACTIVE_STATEMENTS parameter specifies that at most three statements submitted to the server from logins associated with this role can be executed at any one time. If a fourth request is submitted while the previous three are still running, the new request will be held in a queue until a slot is available for it to be run.
In addition to the active statement limit, the queue definition can contain limits on memory utilization and/or maximum estimated query cost.
CREATE RESOURCE QUEUE etl
  WITH (ACTIVE_STATEMENTS=3, MEMORY_LIMIT = '500MB');
Estimated cost is a bit of an amorphous metric and can vary from the use of the legacy query optimizer in comparison to the Pivotal Query Optimizer (aka GPORCA). Given this background, we suggest that you not use the estimated cost of a plan.
In addition to these queue controls, several GUCs (or system configuration parameters) control memory utilization for the system.
CPU usage for queues is managed by the priority setting. It can be LOW, MEDIUM, HIGH, or MAX. Compared to active statements or memory, the priority setting is less well defined. As a general rule, the higher the setting, the more CPU:
CREATE RESOURCE QUEUE poweruser
  WITH (ACTIVE_STATEMENTS=3, MEMORY_LIMIT = '1500MB',
  PRIORITY = HIGH);
The system sets roles that have no assigned resource queue to the pg_default resource queue. As with many defaults, it’s best practice to not use it; rather, you should create resource queues and assign roles to them as appropriate. A typical data warehouse implementation might have a resource queue for ETL jobs, with another for ad hoc queries, another for standard reports, and yet another for short, high-priority queries. Only certain statements are actually affected by the resource queue mechanism. By default, these include SELECT, SELECT INTO, and CREATE TABLE AS SELECT. In an analytic data warehouse, these are the statements that are most likely to consume large amounts of resources.
The following query reveals the status of the queues:
select * from gp_toolkit.gp_resqueue_status;

-[ RECORD 1 ]--+------------
queueid        | 228978
rsqname        | power
rsqcountlimit  | 3
rsqcountvalue  | 0
rsqcostlimit   | −1
rsqcostvalue   | 0
rsqmemorylimit | 1.57286e+09
rsqmemoryvalue | 0
rsqwaiters     | 0
rsqholders     | 0
-[ RECORD 2 ]--+------------
queueid        | 6055
rsqname        | pg_default
rsqcountlimit  | 20
rsqcountvalue  | 0
rsqcostlimit   | −1
rsqcostvalue   | 0
rsqmemorylimit | −1
rsqmemoryvalue | 0
rsqwaiters     | 0
rsqholders     | 0
A fuller description of the resource queues is available in the Pivotal documentation.
Resource queues do an important job in proactively managing workload, but they do not respond to issues with dynamic resource consumption. For example, after a query leaves a queue and begins executing, the queue mechanism does nothing to further constrain its behavior. Poorly written SQL can easily overwhelm a system.
Resource Groups
Resource groups allow fine-grained control over resource usage such as concurrency, CPU, and memory. When resource groups are enabled, the system sets roles that have no assigned resource group to the default_group. Any admin and superuser roles are assigned to a special admin_group group with concurrency and resources set aside to ensure admin queries run smoothly.
New in Greenplum Version 5
Resource groups were introduced in Greenplum 5 and are not available in previous releases.
CPU is set as a floor for each resource group, meaning that if default_group is configured for 20% of system CPU, any queries executed within default_group will share at least 20% of all CPU available to the system. If the total system CPU usage is at less than 100%, any idle CPU can be utilized as needed by any running queries on the system. Similarly, you also can guarantee memory for each resource group by defining a memory percentage. If memory for the default_group is set to 20%, running queries within default_group will share the 20% memory specified for it. If the total memory specified across all resource groups is less than 100%, unused memory can be used as needed by running queries.
CPU and memory percentages are also elastic, meaning that each group can use more or less depending on the need and overall system utilization.
Table 7-1 shows an example of resource groups created to manage workload in the cluster.
| Resource group | Concurrency | CPU | Memory |
|---|---|---|---|
default_group |
20 |
20% |
20% |
adhoc_group |
20 |
20% |
20% |
ETL_group |
20 |
0% |
30% |
Based on Table 7-1, at least 20% of system CPU is made available to the default_group. Suppose that the default_group is running under a heavy workload and using all of its assigned CPU. However, adhoc_group and ETL_group are relatively idle, so the total system CPU usage is only 30%. The CPU allowance for default_group can elastically increase to utilize some or all of the 70% of idle system CPU. When the system workload becomes busy again, default_group will release the extra CPU back to the other resource groups. Memory sharing has similarities to CPU sharing, with unassigned memory available for sharing across all resource groups. For the just-described scenario, only 70% of total system memory is specifically assigned, so the 30% unassigned memory is opportunistically utilized across the three resource groups.
To use resource groups, set the gp_resource_manager parameter to groups with the following command:
gpconfig -v gp_resource_manager -c groups
Then restart the database. After the database is restarted, you can view and modify resource groups through the command line or through the Workload Management tab on the GPCC user interface, as seen in Figure 7-7.

Figure 7-7. Viewing resource groups in Workload Management view
To make things easier for users who want to transition from resource queues to groups, GPCC can convert existing queues into matching resource groups. Figure 7-8 shows the GPCC convert workflow. The converted resource group carries over any users and concurrency settings. CPU and memory settings are automatically set based on queue priority and memory spill ratio. You can modify these settings at will after the conversion step is complete.

Figure 7-8. Creating resource groups in Workload Management view
Greenplum Management Tools
Administering a massively parallel database system requires DBAs to have a variety of tools for the various situations the cluster will encounter. Although Greenplum supports many of the PostgreSQL utilities, these are designed to act on singular database and not the parallel architecture that is core to Greenplum. To fill this void, Greenplum provides a set of command-line tools to aid administrators not only in their day-to-day work, but with the more specialized operations that they might occasionally face. These tools are provided as part of Greenplum’s Management Utilities suite. It is a best practice to restrict the access of these tools to the DBA and other management staff because they can have a significant impact on the current operating state of Greenplum.
In addition to the management tools, there are a variety of user utilities. In reality, these are almost always run by the DBA, as per best practices. They usually are command-line covers for operations that can be done in SQL and include such activities as creating a database, creating a language, and creating a user.
Following is a brief introduction to several of the common and more specialized tools available in the suite.
Basic Command and Control
Following are the utilities you will first encounter as they are used to establish and start and stop the database:
- Initializing a new cluster:
gpinitsystem -
Along with configuration files, this utility is used to create the Greenplum cluster. Configuration parameters include the use of a standby master, the number of data segments, whether to enable mirroring (recommended), the location of the data directories, port ranges, and the cluster name.
- Starting the cluster:
gpstart -
Orchestrates the parallel startup of all the individual PostgreSQL instances across the master, primary, and mirror segments in the Greenplum cluster.
- Stopping the cluster:
gpstop -
A flexible utility allowing DBAs to stop, restart, or, most often, reload runtime settings found in the pg_hba.conf and postgresql.conf files without the need to take the database offline.
System Health
After the database is up and running, the following utilities are used to determine the overall health of a running cluster and address any issues that are reported:
- Monitoring the state of the cluster:
gpstate -
Quickly provides information regarding the state of your Greenplum cluster, including the validity of the master, standby master, primary, and mirror segments.
- Recovering from a primary segment failure:
gprecoverseg -
One of Greenplum’s features is high availability. This is partly accomplished by mirroring the primary data segments in case of hardware failures (disk, power, etc.). When a primary segment fails-over to the mirror, the cluster continues functioning. There comes a time when the original primary segment needs to be reintroduced to the cluster. This utility synchronizes the primary with the mirror based on the transactions that have occurred since the primary failed. Recovery is performed online, while the system is available to end users.
- Performing system catalog maintenance:
gpcheckcat -
Checks the Greenplum catalog for inconsistencies across a variety of scenarios including access control lists (ACLs), duplicate entries, foreign keys, mirroring, ownership, partition integrity, and distribution policy.
- Performing ANALYZE selectively in parallel:
analyzedb -
Maintaining a database at top performance involves generating good query plans. Plans are determined by the statistics that exist on a table, which are generated via the ANALYZE command. This utility can target a database or group of tables and perform the ANALYZE in parallel as well as skip analysis of tables that have not changed for append-optimized tables.
- Cleaning up and reclaiming space:
vacuumdb -
As you use the Greenplum database and rows are deleted or updated, the previous version is replaced using the model-view-controller-context (MVCC) framework. These rows that no longer have use take up space, which is reclaimed by running the VACUUM command.
vacuumdbwill perform this action across an entire database. It is not recommended to run thevacuum fullflag, because running this type of vacuum in Greenplum should be done only to address specific issues.
Disaster Recovery and Data Replication
Greenplum provides utilities to make copies of the data and metadata to ensure business continuity in case of technical failures and to duplicate data for test and development purposes.
- Backing up the database:
gpbackup -
This backup utility provides options for full or partial backups, which are filtered at the database, schema, or table levels. Greenplum also supports incremental backups at the partition level for AO tables. This utility is replacing
gpcrondump, which was formerly the default tool for this type of operation. - Restoring the database:
gprestore -
You can restore Greenplum objects and data on the original cluster or a different one from which the backup was taken. Similar to
gpbackup,gpdbrestoreallows for selective filtering at the database, schema, and table levels and supports. This is replacing the toolgpdbrestore, which previously had been used in conjunction withgpcrondump. - Transferring data across clusters:
gpcopy -
Moving data and objects from one cluster to another is a common task. This utility provides users with a flexible, high-speed option that uses
gpfdistand external tables. This is commonly used to move full databases to new clusters or populate a subset of data into development/sandbox environments.
Operations and System Management
Managing a clustered set of server can present challenges. Greenplum has utilities that DBAs use to help streamline this job:
- Interacting with the segment servers:
gpsshandgpscp -
Keeping configuration files consistent across large multinode systems can be difficult. These two tools allow administrators to run commands and copy files to all nodes via the master server, without the need to directly log in to each individual segment host.
- Baselining system performance:
gpcheckperf -
Knowing the performance of the underlying hardware can provide help to diagnose whether issues are at a hardware level or in the database software. This tool can check the performance of disk I/O, memory bandwidth, and network. Ideally, DBAs should run this before installing the Greenplum software to get a baseline of performance for the system. Running it later in the life cycle of the cluster (when the database is not running), the output can be used to determine hardware or system problems in the cluster and whether the systems are all performing equally.
- Setting database configuration parameters:
gpconfig -
Keeping configuration files synchronized for hundreds of underlying Postgres instances is a challenge. This tool reports and can change configuration settings in the postgresql.conf file across the entire cluster.
Other Tools
Although not strictly separate utilities, Greenplum also has techniques for managing database connections and disk space utilization.
- Maintaining database connections efficiently:
pgbouncer -
PgBouncer is the name of a Greenplum and PostgreSQL connection pooler. Any target application can be connected using
pgbounceras if it were the Greenplum master server, andpgbouncerwill create a connection to the actual server, or it will reuse one of its existing connections. Opening and closing connections has a performance impact that usingpgbouncermitigates.
New in Greenplum Version 6
diskquota is new in Greenplum 6.
- Managing disk space:
diskquota -
diskquotais a tool that controls disk usage by roles and schemas in both PostgreSQL and Greenplum. Originally written by Pivotal’s Heikki Linnakangas as a PostgreSQL extension, it has been incorporated into Greenplum 6. For a clear description ofdiskquota’s design, visit this Github repo.After you install it,
diskquotas are set by using a UDF. The first statement sets a limit of 1 GB of disk space in thegpuserschema of the current database, the second a limit of 2 GB of disk space to the roleuser27in the current database. There are also monitoring functions:
select diskquota.set_schema_quota('gpuser', '1 GB');
select diskquota.set_role_quota('user27', '2 GB');
Additional Resources
The Pivotal Greenplum Command Center documentation has both release notes as well as detailed information on installation, supported platforms, access, and upgrades from previous versions.
DBAs should read two documents on workload management:
There is a roundtable discussion on workload management in this Greenplum Chat YouTube video. Be aware, though, that it’s older than the tutorial and might not reflect the newer features.
The Pivotal Greenplum Workload Manager documentation has the most detail.
Greenplum memory management is critical. It takes two forms: Linux OS memory management and the internal Greenplum memory controls. The importance of memory management cannot be overstated and the following articles provide much useful information.
Both these topics are discussed in this PivotalGuru post by John Roberts, and also in the Greenplum memory management documentation.
More details on the tools to manage Greenplum are available in the Utility Guide.