Diagram of the Database Design Process
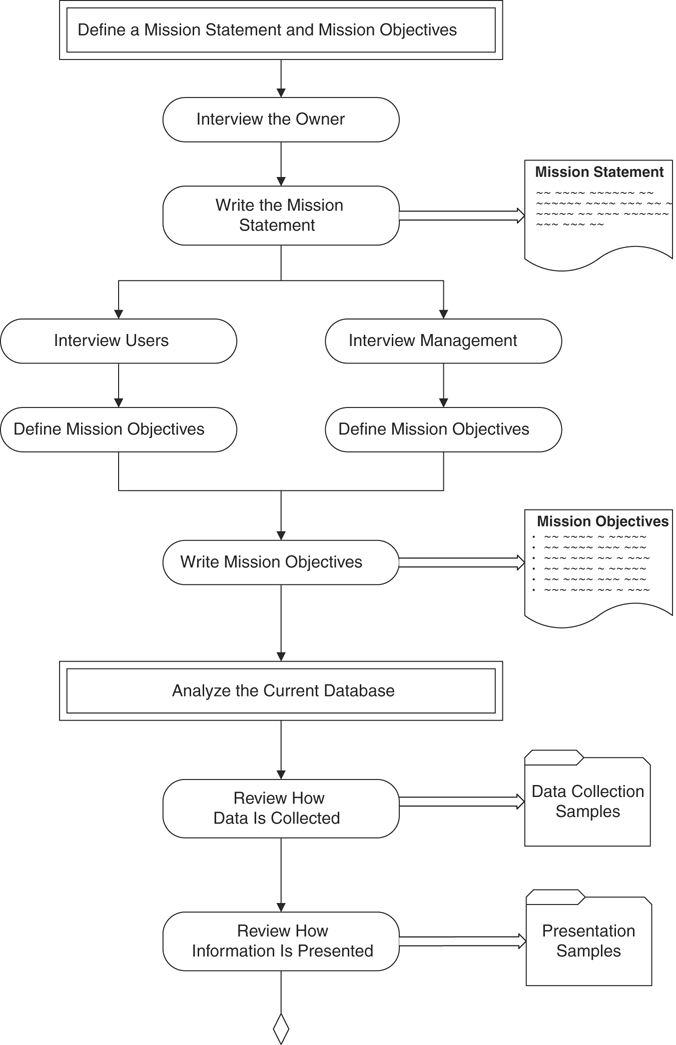
The diagram on the following pages provides you with a map of the entire database design process. It indicates each design phase, procedures within the phase, tasks within the procedure, and in some cases, subtasks within a task.
This legend shows the type of symbols you’ll see in the diagram.
The legend shows the following representations: The double bordered rectangle represents a design phase. A rounded rectangle represents a procedure. The parallelogram represents a task. A rectangle represents a subtask. The rightward pointing arrow indicates the output. The folder like symbol represents a collection of items. A rectangle with a curved base with dashed lines within, represents a written material. A rectangle with a vertical line near the left edge represents a note. A relationship diagram with two tables connected to a linking table is shown, which represents a diagram. A written material is shown with several collections of items represented in it. This represents the specification sheet.
A flowchart presents a database design process. Initially, in the design phase, the mission statement and mission objectives are defined. Then comes the procedure of interviewing the owner and writing the mission statement. That gives the output of the written material of the mission statement. Then the procedure is divided into interview users followed by define mission objectives on one side and interview management followed by define mission objectives on the other side. Both the procedures result in another procedure of writing mission objectives which gives a written material for mission objectives. The last procedure is followed by a design phase of analyzing the current database, which again is followed by the procedure to review how data is collected which gives the output as data collection samples. The procedure is followed by another one to review how information is presented, which gives the output of presentation samples.
The flowchart continues to present the database design process. The chart continues with a procedure called interview users which is followed by a task called review data type and usage. That gives the output as written materials such as the initial list of subjects, and the initial list of characteristics. The task is followed by another task to review the samples, which give the output as data collection samples, and presentation samples with descriptions. Review the samples’ task is followed by another task called review information requirements, which leads to a subtask called current information requirements. This gives an output, where a note is given to verify and note the data sources. The subtask is followed by another subtask by the name additional information requirements which gives outputs as written materials such as additional subjects and additional characteristics. This leads to another subtask called future information requirements, that gives the outputs as additional data collection and presentation samples, and written materials such as new subjects and new characteristics. The chart continues further.
A flowchart continues to present the database design process. The chart continues with a procedure called interview management which is followed by a task called review information requirements. This leads to a subtask called current information requirements. This gives the outputs as the newly discovered presentation samples collection and the written materials such as new subjects and new characteristics. The subtask is followed by another one called additional information requirements, which gives the outputs as written material such as additional subjects and additional characteristics. The subtask is followed by another subtask called future information requirements, that gives the output as additional data collection and presentation samples, and written materials such as new subjects and new characteristics. This leads to another subtask called overall information requirements. This gives outputs as new data collection, and presentation samples, and written materials such as new subjects and new characteristics. The chart continues further.
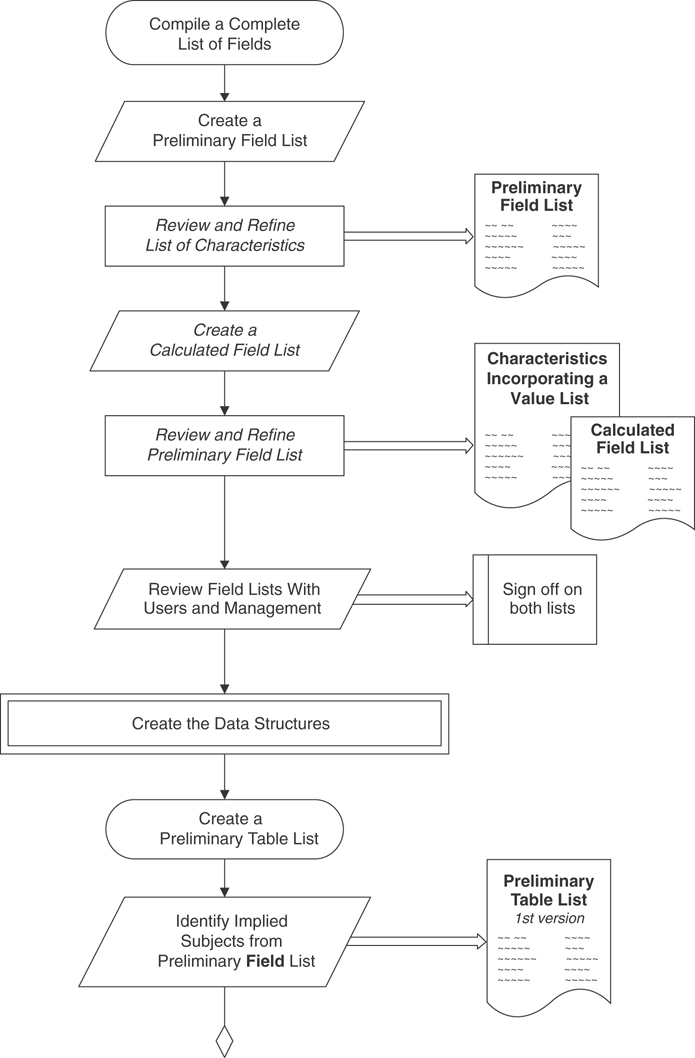
A flowchart continues to present the database design process. The chart continues with a procedure to compile a complete list of fields which is followed by a task to create a preliminary field list. This leads to a subtask to review and refine the list of characteristics. This gives the output as a written material of the preliminary field list. The subtask is followed by a task to create a calculated field list, which is followed by a subtask to review and refine the preliminary field list. This gives the output as written materials such as characteristics incorporating a value list and calculated field list. The subtask is followed by a task to review field lists with users and management, which gives the output as a note to sign off on both lists. This subtask leads to a design phase by the name, create the data structures. This leads to a procedure to create a preliminary table list. The procedure is followed by a task to identify implied subjects from the preliminary field list. This gives the output as a written material called the preliminary table list first version. The chart continues further.
A flowchart continues to present the database design process. The chart continues with a task to merge the preliminary table list with the list of subjects which gives the output as a written material called preliminary table list, second version. The task is followed by another task to incorporate subjects from the mission objectives. This gives the output as a written material called preliminary table list, third version. This leads to a procedure to define the final table list which is followed by a task to refine the table names. This task is followed by another task to indicate the table types, which is followed by another task to compose the table descriptions. This is followed by a subtask called interview users and management which gives the output as a written material called the final table list. The subtask is followed by another subtask to have everyone sign off on the list. The chart continues further.
A flowchart continues to present the database design process. The chart continues with a procedure, which associates fields with each table. This is followed by a task to associate fields from the preliminary field list to each table as appropriate. This gives the output as written material of the list of table structures. The task is followed by a procedure to refine the fields. This procedure leads to a task to improve the field names using the appropriate guidelines which leads to another task to use the elements of the ideal field to resolve field anomalies. This task is followed by another task to resolve multipart fields which is followed by another task to resolve the multivalued fields. This task gives the output as written materials called the list of table structures with revised fields. The chart continues further.
A flowchart continues to present the database design process. The chart continues with a procedure to refine the table structures which is followed by a task that uses the elements of the ideal table to refine the table structures. This gives the output as a written material of the list of table structures with revised tables. The task is followed by a subtask to resolve unnecessary duplicate fields. This subtask leads to a task to establish subset tables which further leads to a subtask to refine previously unidentified subset tables. The subtask gives the output as a list of table structures with subset tables. The subtask is followed by a procedure to establish the keys for each table which is followed by a task to define the candidate keys based on the elements of a candidate key. The task is followed by a subtask to create artificial candidate keys as necessary. This subtask gives the output as written materials called the list of table structures with candidate keys. The chart continues further.
A flowchart continues to present the database design process. The chart continues with a task to define the primary keys based on the elements of a primary key which gives the output as a list of table structures with the primary key. The task is followed by another task to designate the alternate keys from the remaining candidate keys. This gives the output as a list of table structures with alternate keys. The task is followed by another task to review the initial table structures. This task leads to a subtask to interview users and management, which gives the output as a written material of initial table structures with all keys. The subtask further leads to another subtask to have everyone sign off on the structures. The chart continues further.
A flowchart continues to present the database design process. The chart continues with a procedure that defines a field specification for each field in the database. This is followed by a task to complete as many specifications as you can. This task gives the output as specification sheets called complete field specifications and partial field specifications. The task is followed by another task to meet with the user or management representatives and review all of the specifications. This task leads to another subtask to ensure the specifications you completed are suitable and correct which further leads to another subtask to finish the specifications you were initially unable to complete. This subtask gives the specification sheet called field specification sheets for all fields. The subtask is followed by another subtask to have everyone sign off on the completed specifications. The chart continues further.
A flowchart continues to present the database design process. The chart continues with a design phase that determines and establishes the table relationships. This is followed by a procedure to identify existing relationships. This procedure is followed by a task to create and set up a table matrix. This gives a table matrix as an output. The task is followed by another task to identify the official relationships for the tables within the matrix. This gives the relationship diagrams as output. The task leads to another task that establishes each relationship using foreign keys or linking tables as appropriate. The task is followed by a subtask to review and refine the table structures which gives the revised relationship diagrams as outputs. The subtask is followed by a procedure to refine all the foreign keys using the elements of a foreign key. This procedure gives the revised relationship diagrams as output. The chart continues further.
A flowchart continues to present the database design process. The chart continues with a procedure to establish the relationship characteristics which is followed by a task to define a deletion rule. This gives the revised relationship diagrams as output. The task is followed by another task to indicate the type of participation for each table. This task gives the revised relationship diagrams as output. The task further leads to another task to indicate the degree of participation for each table. This task gives the revised relationship diagrams as an output. The task further leads to another task to verify relationships with the user or management representatives. The task is followed by a subtask to have everyone sign off on the structures. The chart continues further.
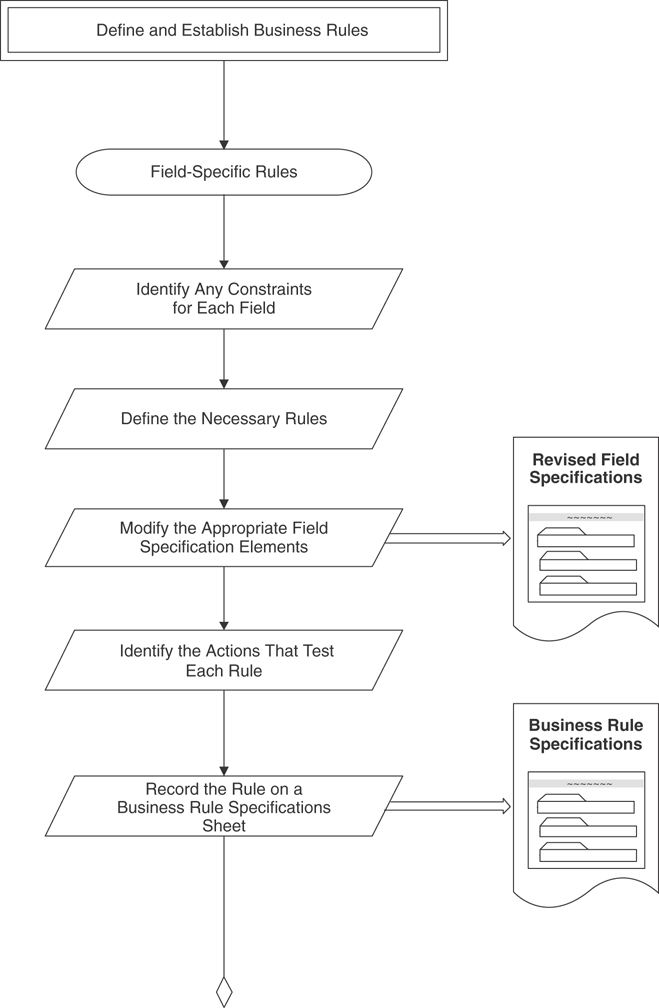
A flowchart continues to present the database design process. The chart continues with a design phase that defines and establishes the business rules. This is followed by a procedure called field-specific rules. This procedure is followed by a task to identify any constraints for each field. The task is followed by another task to define the necessary rules. The task further leads to another task to modify the appropriate field specification elements. This task gives the revised field specifications as output. The task is followed by another task to identify the actions that test each rule, which is followed by the task to record the rule on a business rule specifications sheet. The task gives the business rule specifications as output. The chart continues further.
A flowchart continues to present the database design process. The chart continues with a procedure called relationship-specific rules which is followed by a task to identify any constraints for each relationship. This task is followed by another task to define the necessary rules. The task is further followed by another task to modify the appropriate relationship characteristics. The task gives the revised relationship diagram as output. The task further leads to another task to identify the actions that test each rule. This task is followed by another task to record the rule on a business rule specifications sheet which gives the business rule specifications as output. The task is followed by a procedure that reviews the business rule specifications sheets. The procedure leads to a task to revise as necessary, where the revised business rule specifications sheet is obtained as output. The chart continues further.
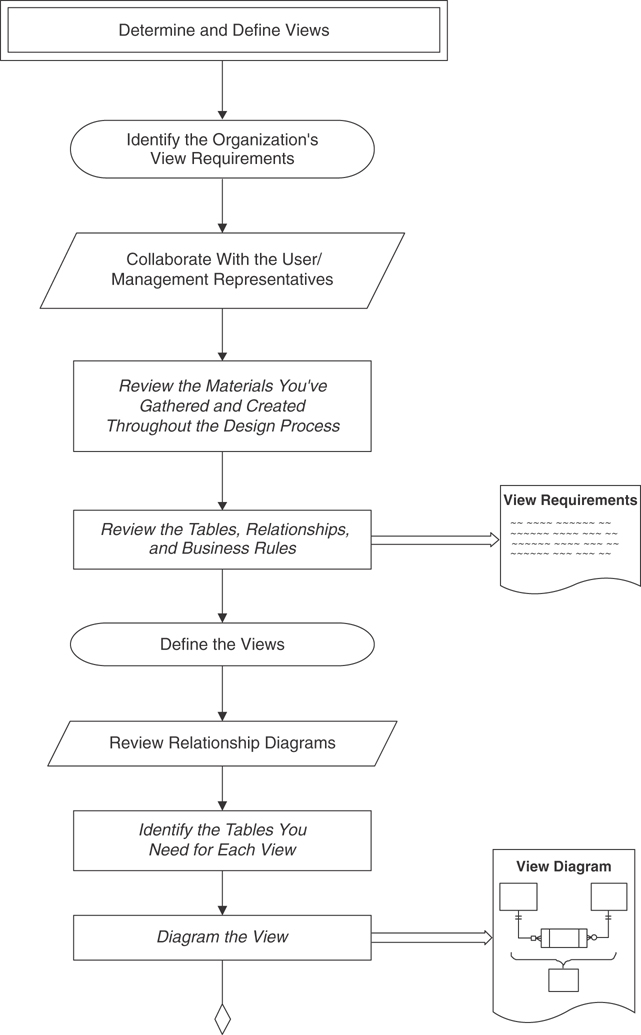
A flowchart continues to present the database design process. The chart continues with a design phase to determine and define the views, which is followed by a procedure to identify the organization’s view requirements. This procedure is followed by a task to collaborate with the user or management representatives. The task is followed by a subtask to review the materials you’ve gathered and created throughout the design process. The subtask further leads to another subtask to review the tables, relationships, and business rules. This subtask gives the output as written material of the view requirements. The subtask is followed by a procedure to define the views. The procedure leads to a task that reviews the relationship diagrams. The task leads to a subtask to identify the tables you need for each view. The subtask is followed by another subtask, where we diagram the view. The subtask gives the view diagram as output. The chart continues further.
A flowchart continues to present the database design process. The chart continues with a task to add the calculated fields as necessary which gives the revised view diagram as output. The task is followed by another task to impose criteria to filter the data as necessary. The task is followed by another task to record the view in a view specification sheet, which gives view specifications as the output. This task is followed by another task to review each of the view specifications sheets. This task is followed by a subtask to make sure if the view is properly defined and if everything is in order. The subtask further leads to another subtask to have everyone sign off on the view structures. The chart continues further.
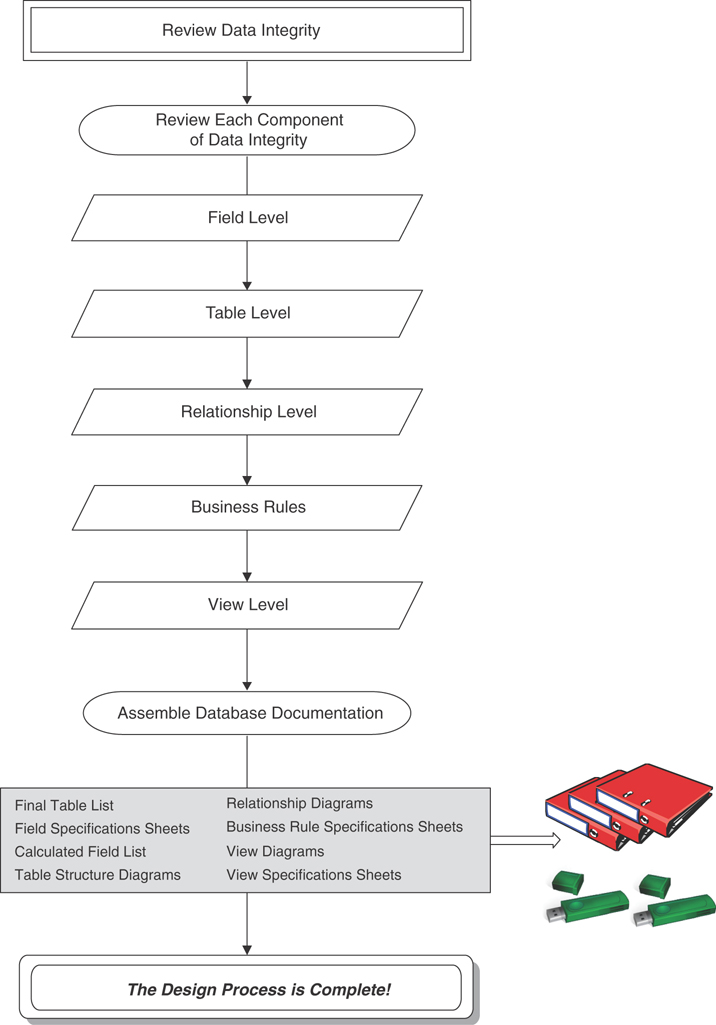
A flowchart continues to present the database design process. The chart continues with a design phase to review the data integrity which is followed by reviewing each component of data integrity. This procedure is followed by a task called field level. The task is followed by another task called table level. The task further leads to another task called relationship level which again leads to another task called business rules. This task is followed by another task called view level. The task is followed by a procedure to assemble database documentation. The procedure leads to subtasks such as final table list, field specifications sheets, calculated field list, table structure diagrams, relationship diagrams, business rule specifications sheets, view diagrams, and view specifications sheets. The subtask gives the final outputs, which are saved in pen drives and files. Thus the design process is complete.
..................Content has been hidden....................
You can't read the all page of ebook, please click
here login for view all page.