© Vlad Catrinescu and Trevor Seward 2019
Vlad Catrinescu and Trevor SewardDeploying SharePoint 2019https://doi.org/10.1007/978-1-4842-4526-2_19

19. Monitoring and Maintaining a SharePoint 2019 Deployment

Vlad Catrinescu1  and Trevor Seward2
(1)
Greenfield Park, QC, Canada
(2)
Sultan, WA, USA
 

In this chapter, we will look at how to monitor our SharePoint Server 2019 environment to assure stability as well as performance for your users. We will also look at how to monitor logs to make sure there are no issues and potential ongoing maintenance activities to keep your SharePoint farm running at peak performance.

Monitoring

SharePoint Server 2019 can be monitored with a variety of logs and tools. Logs include IIS logging, ULS logging, Event Logging (Event Viewer), and SQL Server log files. From a tools perspective, Performance Monitor will be the primary tool we will examine, in addition to the IIS Manager to look for potential long-running requests.

IIS Logging

IIS logs all web site activity to SharePoint. While not necessarily the primary place to examine for errors or performance, it can provide an indication of issues users are running into, including missing assets or server errors, such as HTTP 500 errors.

As IIS logs are plain text files and parsing them can be difficult with text editors like Notepad, Log Parser and Log Parser Studio from Microsoft makes finding specific types of log entries significantly easier.

You may consider adding additional fields to log for each request. This can be done in IIS on a server or IIS web site level under Logging in the feature pane.

Tip

Log Parser 2.2 is available from Microsoft at www.microsoft.com/en-us/download/details.aspx?id=24659 and Log Parser Studio is available on the TechNet Gallery at https://gallery.technet.microsoft.com/office/Log-Parser-Studio-cd458765 .

In this example, we will start with Log Parser 2.2. We will be looking for any HTTP 404 errors, which indicate a missing file, from all files within an IIS Web Site.
LogParser "SELECT date, cs-uri-stem FROM E:IISW3SVC548194741u_ex*.log WHERE sc-status = 500 GROUP BY date, cs-uri-stem"
date       cs-uri-stem
---------- ----------------------------------------------------------------
2018-11-03 /robots.txt
2018-11-06 /SitePages/none
2018-11-06 /_layouts/15/activitymonitor.js
2018-11-20 /SitePages/none
2018-11-20 /_layouts/15/activitymonitor.js
2018-11-20 /sites/team
2018-11-20 /favicon.ico
Statistics:
-----------
Elements processed: 6121
Elements output:    7
Execution time:     0.12 seconds

With this output, we can see there are 3 days where users received an HTTP 404 when requesting a resource. We know from this example that SharePoint does not include certain files, such as favicon.ico by default and can ignore these particular missing files.

Server errors are in the HTTP 500 range, and this output shows we have a few HTTP 500 errors across a few days. This output shows that the errors were primarily with the Publishing service.
LogParser "SELECT date, cs-uri-stem FROM E:IISW3SVC548194741u_ex*.log WHERE sc-status = 500 GROUP BY date, cs-uri-stem"
date       cs-uri-stem
---------- ----------------------------------------------------------------
2018-11-04 /_vti_bin/publishingservice.asmx
2018-11-04 /_vti_bin/client.svc/SP.Directory.DirectorySession/me
2018-11-04 /_vti_bin/client.svc/social.following/IsFollowed
2018-11-04 /_vti_bin/client.svc/SP.Directory.DirectorySession/User(principalName='lab/trevor.seward')
2018-11-05 /_vti_bin/publishingservice.asmx
2018-11-06 /_vti_bin/publishingservice.asmx
2018-11-06 /_vti_bin/client.svc/social.following/IsFollowed
2018-11-06 /_vti_bin/client.svc/GroupSiteManager/GetGroupCreationContext
2018-11-07 /_vti_bin/publishingservice.asmx
2018-11-08 /_vti_bin/publishingservice.asmx
2018-11-09 /_vti_bin/publishingservice.asmx
2018-11-10 /_vti_bin/publishingservice.asmx
2018-11-11 /_vti_bin/publishingservice.asmx
2018-11-12 /_vti_bin/publishingservice.asmx
2018-11-13 /_vti_bin/publishingservice.asmx
2018-11-14 /_vti_bin/publishingservice.asmx
2018-11-15 /_vti_bin/publishingservice.asmx
2018-11-16 /_vti_bin/publishingservice.asmx
2018-11-17 /_vti_bin/publishingservice.asmx
2018-11-18 /_vti_bin/publishingservice.asmx
2018-11-19 /_vti_bin/publishingservice.asmx
2018-11-20 /_vti_bin/publishingservice.asmx
Statistics:
-----------
Elements processed: 6121
Elements output:    22
Execution time:     3.41 seconds
By default, IIS logging is in UTC format, so account for your local time zone. When finding a particular log entry that contains the HTTP 500, for example:
2018-11-18 09:02:22 172.16.5.128 POST /_vti_bin/publishingservice.asmx - 443 0#.w|labs-crawl 10.10.20.146 Mozilla/4.0+(compatible;+MSIE+4.01;+Windows+NT;+MS+Search+6.0+Robot) - 500 0 0 78
We can directly correlate this entry with the ULS logs. In the ULS logs, which are local to your time zone, in this case, GMT-8, I will want to examine the ULS log from 1:02:22 AM. Examining this ULS log file, I can also identify the HTTP 500 from there:
11/18/2018 01:02:22.19    w3wp.exe (0x1044)    0x18DC    SharePoint Server    Taxonomy    ca42    Medium    Exception returned from back end service. System.ServiceModel.FaultException`1[System.ServiceModel.ExceptionDetail]: Retrieving the COM class factory for component with CLSID {BDEADF26-C265-11D0-BCED-00A0C90AB50F} failed due to the following error: 800703fa Illegal operation attempted on a registry key that has been marked for deletion. (Exception from HRESULT: 0x800703FA). (Fault Detail is equal to An ExceptionDetail, likely created by IncludeExceptionDetailInFaults=true, whose value is: System.Runtime.InteropServices.COMException: Retrieving the COM class factory for component with CLSID {BDEADF26-C265-11D0-BCED-00A0C90AB50F} failed due to the following error: 800703fa Illegal operation attempted on a registry key that has been marked for deletion. (Exception from HRESULT: 0x800703FA).

And finally, based on the correlation ID, using a tool such as ULS Viewer, we can further examine the errors generated. In the case of the preceding error, it was due to a registry key that was attempted to be used even though it was marked for deletion. Resolving this error typically involves simply restarting the server as Windows deletes registry keys during the reboot process.

ULS Logging

ULS provides a valuable source of information about your SharePoint farm. This is the core logging mechanism of SharePoint and is often the first place a SharePoint Administrator will look for any SharePoint-related errors. By default, ULS logs are located in C:Program FilesCommon Filesmicrosoft sharedWeb Server Extensions16LOGS. ULS logs are in the format of ServerName-YYYYMMdd-hhmm.log, for example, CALSP01-20181114-0836.log.

Tip

ULS Viewer is available from Microsoft at www.microsoft.com/en-us/download/details.aspx?id=44020 .

If the ULS logs have been relocated, you can use the cmdlet Get-SPDiagnosticConfig to identify where the logs have been relocated to.
(Get-SPDiagnosticConfig).LogLocation
The log location may also be found via Central Administration. Using Central Administration, navigate to Monitoring. Under Configure diagnostic logging, the Trace Log Path is where the ULS log is located, as shown in Figure 19-1.
../images/469662_1_En_19_Chapter/469662_1_En_19_Fig1_HTML.jpg
Figure 19-1

ULS log location

Users may encounter errors from SharePoint, which provides them the date and time the error occurred, as well as the ULS Correlation ID. An example of one such error is seen in Figure 19-2.
../images/469662_1_En_19_Chapter/469662_1_En_19_Fig2_HTML.jpg
Figure 19-2

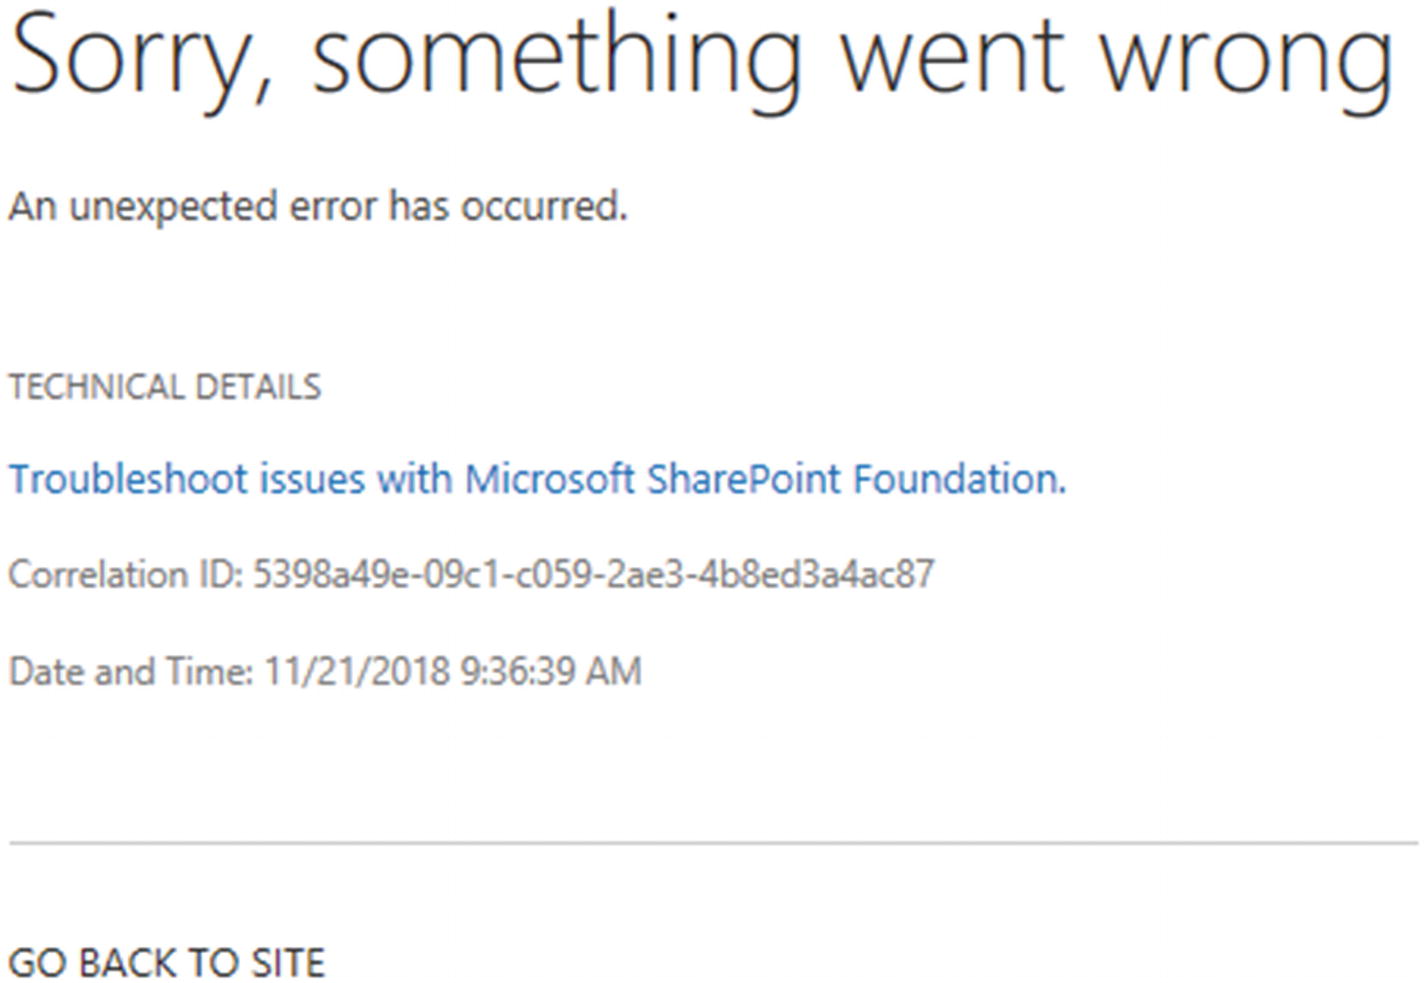
A SharePoint error as seen by a user

Using this information, the Correlation ID and Date and Time, and using Ulsviewer, open the appropriate ULS log file. By using Ulsviewer, we can filter by the preceding Correlation ID, as shown in Figure 19-3, to see the end user’s request end to end.
../images/469662_1_En_19_Chapter/469662_1_En_19_Fig3_HTML.jpg
Figure 19-3

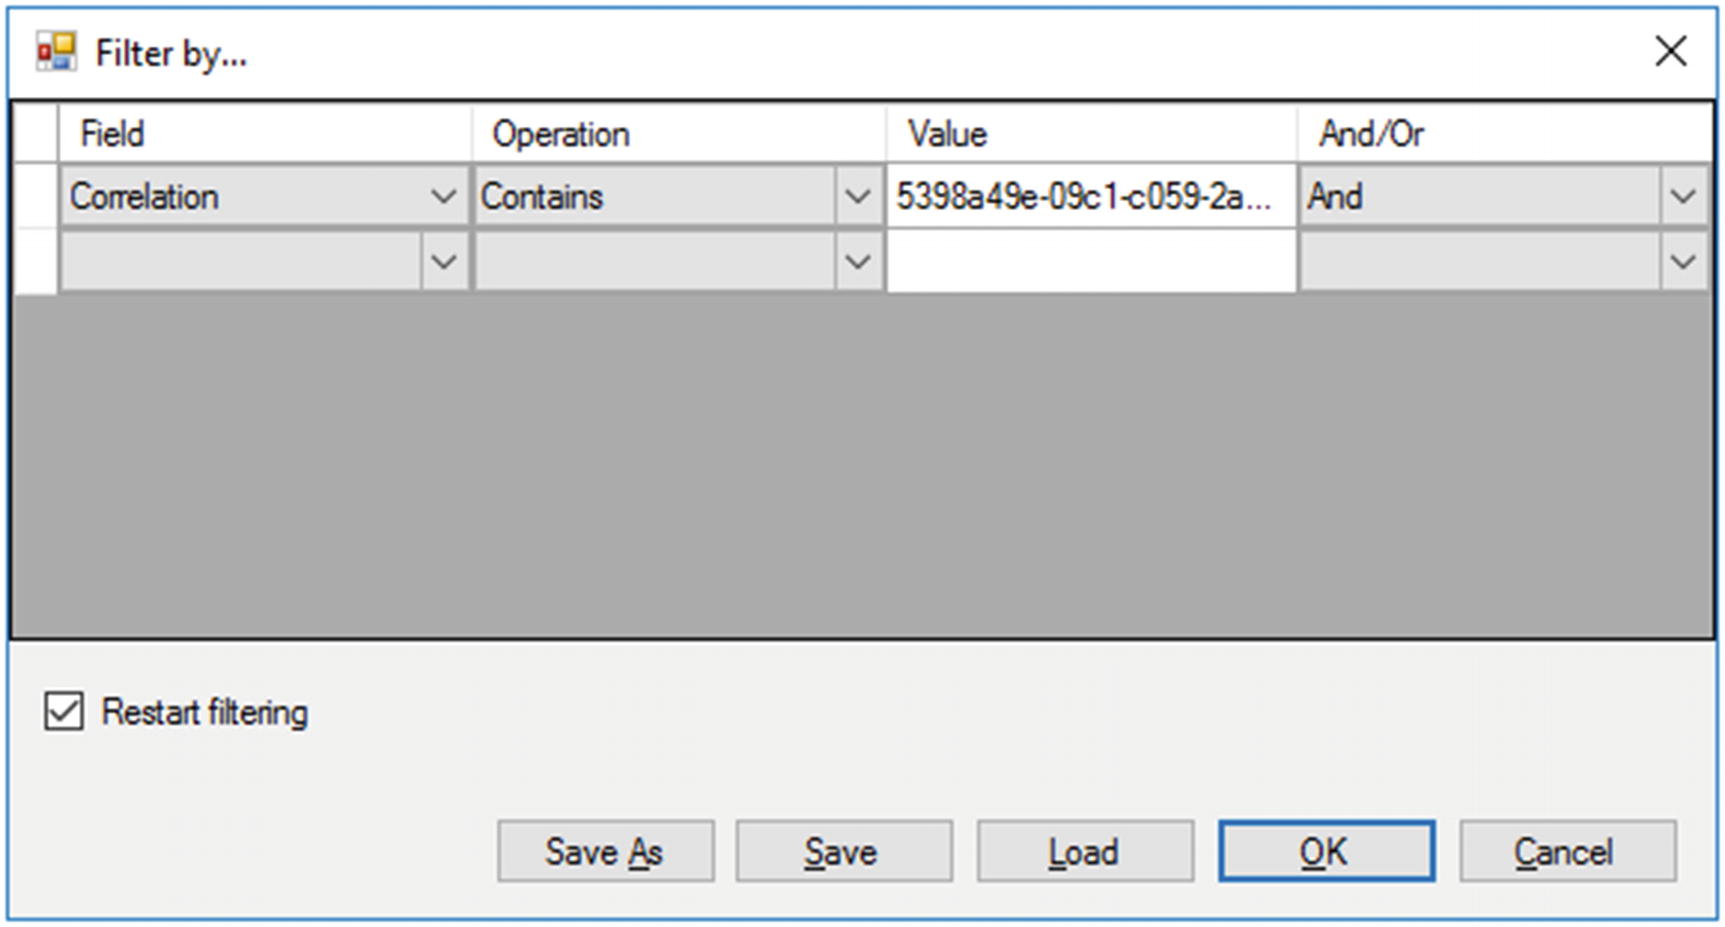
 Filtering the ULS log by Correlation ID

The error may be identified within the list of entries once filtered. In this case, the error is generic, but the user had requested a Content Type that does not exist, seen in Figure 19-4.
../images/469662_1_En_19_Chapter/469662_1_En_19_Fig4_HTML.jpg
Figure 19-4

Content Type errors in the ULS log

The ULS log will display the date and time the log entry is from, the product (e.g., SharePoint, Project Server, PowerPivot, etc.), the Category (User Profiles, Search), the Event ID, the level (Unexpected are generally errors), Correlation ID, Message, the Request, and other information depending on the type of error.

Event IDs are used internally by Microsoft and the information of what message they’re associated with is not generally published.

As many farms consist of multiple servers, sometimes it is difficult to locate an error as there may be more than one server that provides the service associated with an error, such as more than one server running Search or serving as a Web Front End. Using the cmdlet Merge-SPLogFile, one can use parameters to narrow down the search for specific errors across the farm. This is an example of how to merge all log files from all SharePoint servers in the farm by a Correlation ID.
Merge-SPLogFile -Path C:error.log -CorrelationID "5398a49e-09c1-c059-2ae3-4b8ed3a4ac87"
If the Correlation ID is found, it will output the matching ULS log entries to the C:error.log file. When you do not specify a time range, the Merge-SPLogFile cmdlet will only look at the previous 60 minutes of logs. If the Correlation ID is not known, it is also possible to narrow down the log by time. Time will be formatted in military time (24 hours), for example, to merge the logs between 3 PM and 5 PM, you would use the following cmdlet:
Merge-SPLogFile -Path C:error.log -StartTime "11/21/2018 15:00" -EndTime "11/21/2018 17:00"

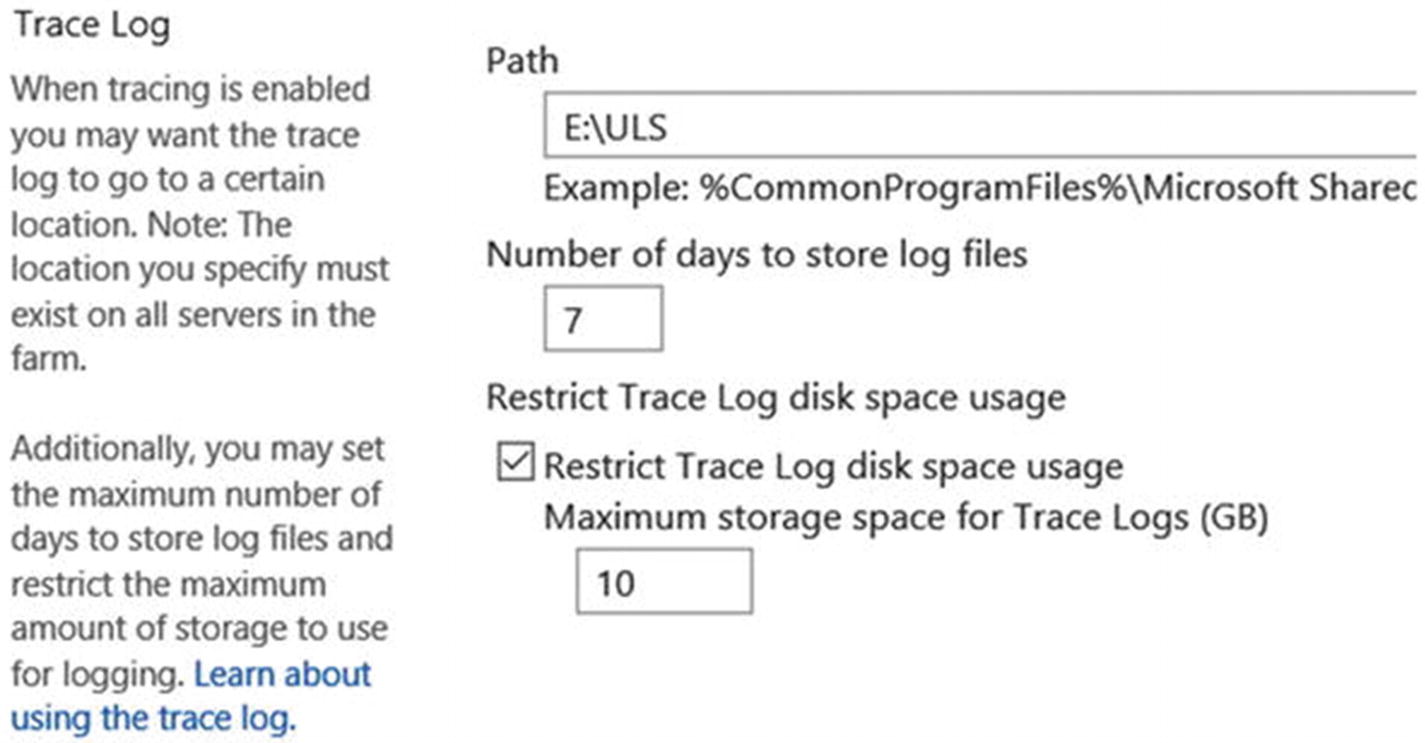
It is possible that errors may not be caught using the default logging settings. For this, we need to increase the verbosity of logs. The verbosity settings are based on Areas. These settings can be modified via Central Administration under Monitoring, Configuring diagnostic logging.

This page will list the current verbosity level for each Area, as shown in Figure 19-5, as well as provide two drop-downs to adjust the verbosity between None to Verbose or allowing you to Reset to Default.
../images/469662_1_En_19_Chapter/469662_1_En_19_Fig5_HTML.jpg
Figure 19-5

Adjusting the verbosity of an Area

Verbosity can also be adjusted through the SharePoint Management Shell. In addition, setting the verbosity via PowerShell will allow you to set the verbosity up to VerboseEx, which has additional information not provided at the Verbose logging level. The format to setting a specific area is either by simply specifying the Area, or CategoryName:Area, or even CategoryName:*, which will set the entire Category to the specified Trace Severity. Here are a few examples:
Set-SPLogLevel -Identity "SharePoint Foundation:Asp Runtime" -TraceSeverity VerboseEx
Set-SPLogLevel -Identity "Asp Runtime" -TraceSeverity VerboseEx
Set-SPLogLevel -Identity "SharePoint Foundation:*" -TraceSeverity VerboseEx

When using Verbose or VerboseEx trace levels, there may be a significant impact on farm performance. Because of this, you may want to run with these Trace Severities for a short period of time to reproduce a specific issue.

Once completed reproducing the issue, use Clear-SPLogLevel to reset all Areas back to their default Trace Severity.

ULS Viewer can be used for monitoring the live environment, as well. This is suitable when having a user reproduce a problem that does not necessarily surface an error, but will allow you to correlate the user’s action with one or more messages within the ULS log. The latest version of ULS Viewer is also able to monitor logs over the entire farm. By selecting the farm icon, represented by a tree node in the toolbar, you can enter one or more server names into the farm, then using a UNC path, Ulsviewer will allow you to see the server logs intermixed, real time. This is useful in scenarios where a user may call a service on a backend server, but you must trace the action of the user through the frontend to the backend.

Event Viewer

SharePoint records a limited amount of information to the Event Viewer, but the Event Viewer is more useful for service-specific and ASP.NET errors.

Generally, Windows Services that run SharePoint, such as the SharePoint Timer or SharePoint Administration service, will show any startup or unexpected stops in the System Event Log. For example, if the SharePoint Timer service unexpectedly stops, it will show an error in the System Event Log as seen in Figure 19-6.
../images/469662_1_En_19_Chapter/469662_1_En_19_Fig6_HTML.jpg
Figure 19-6

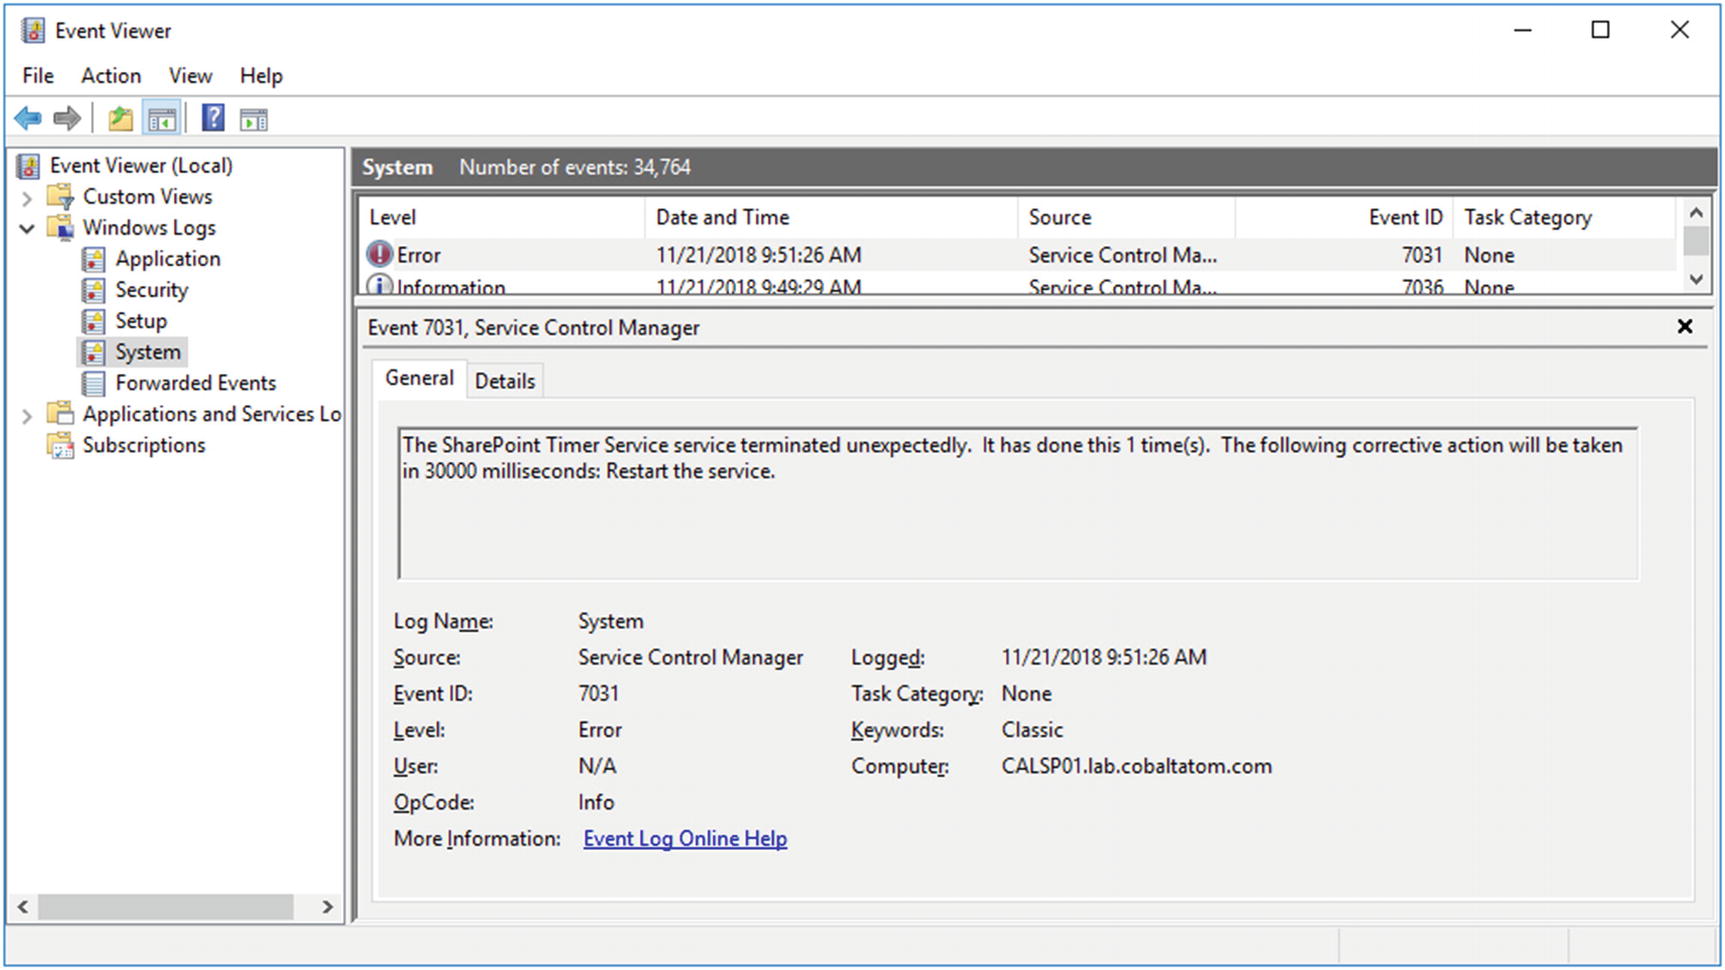
The SharePoint Timer service has unexpectedly stopped

The System Event Log is also useful for diagnosing Kerberos errors, along with any TLS/SSL errors that may occur.

The Application Event Log will show other more general SharePoint information, warnings, and error messages from a variety of sources. As an example, it will show when an IIS Application Pool has started, as shown in Figure 19-7.
../images/469662_1_En_19_Chapter/469662_1_En_19_Fig7_HTML.jpg
Figure 19-7

An IIS Application Pool starting up

SharePoint also logs data in a few Applications and Services event logs. In the Operational log for SharePoint Products, Shared, log entries typically consist of Incoming E-mail statistics, Usage and Trace Log status, such as when the log reached the retention limit based on space used or date as shown in Figure 19-8, and InfoPath Forms Services messages.
../images/469662_1_En_19_Chapter/469662_1_En_19_Fig8_HTML.jpg
Figure 19-8

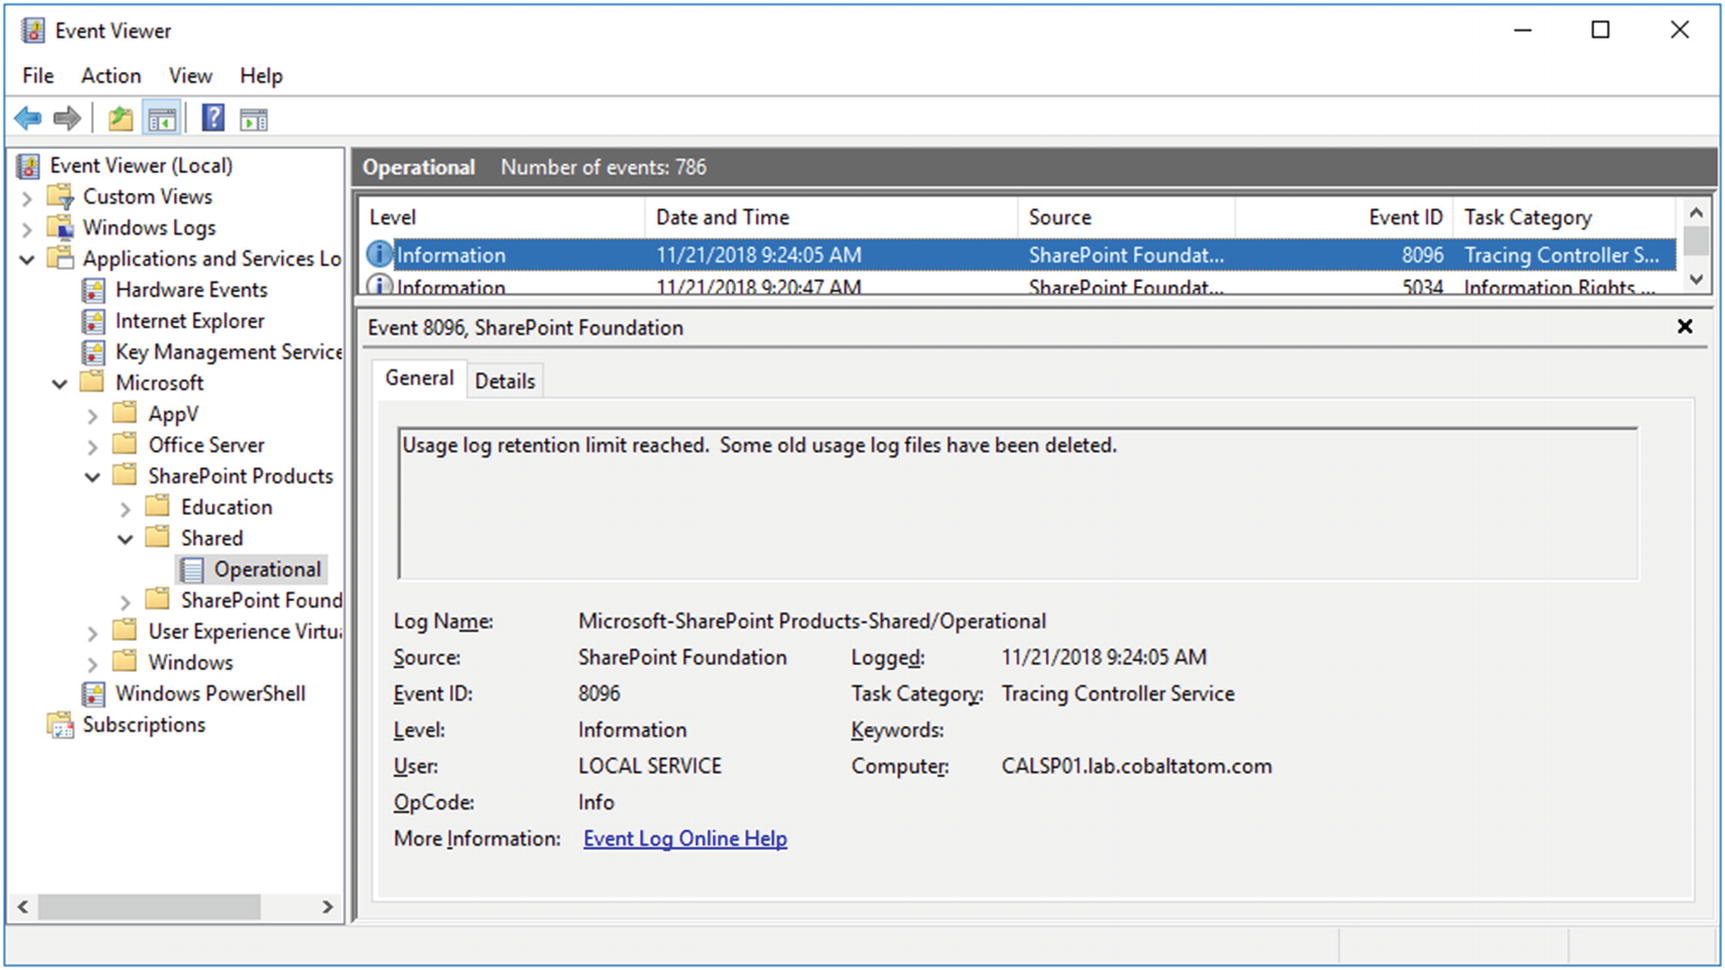
Usage service logs reaching the retention limit

IIS Manager

The IIS Manager provides a limited amount of information on active requests in Application Pools. This information may be helpful for diagnosing the origins of long-running requests, for example, a large number of requests to a OneNote notebook residing on a SharePoint site.

Using IIS Manager, at the server level, go into “Worker Processes.” From here, as shown in Figure 19-9, it will show a limited amount of information about each worker process.
../images/469662_1_En_19_Chapter/469662_1_En_19_Fig9_HTML.jpg
Figure 19-9

Running Worker Process information

By right-clicking a Worker Process and selecting View Current Requests, we can identify running requests as shown in Figure 19-10.
../images/469662_1_En_19_Chapter/469662_1_En_19_Fig10_HTML.jpg
Figure 19-10

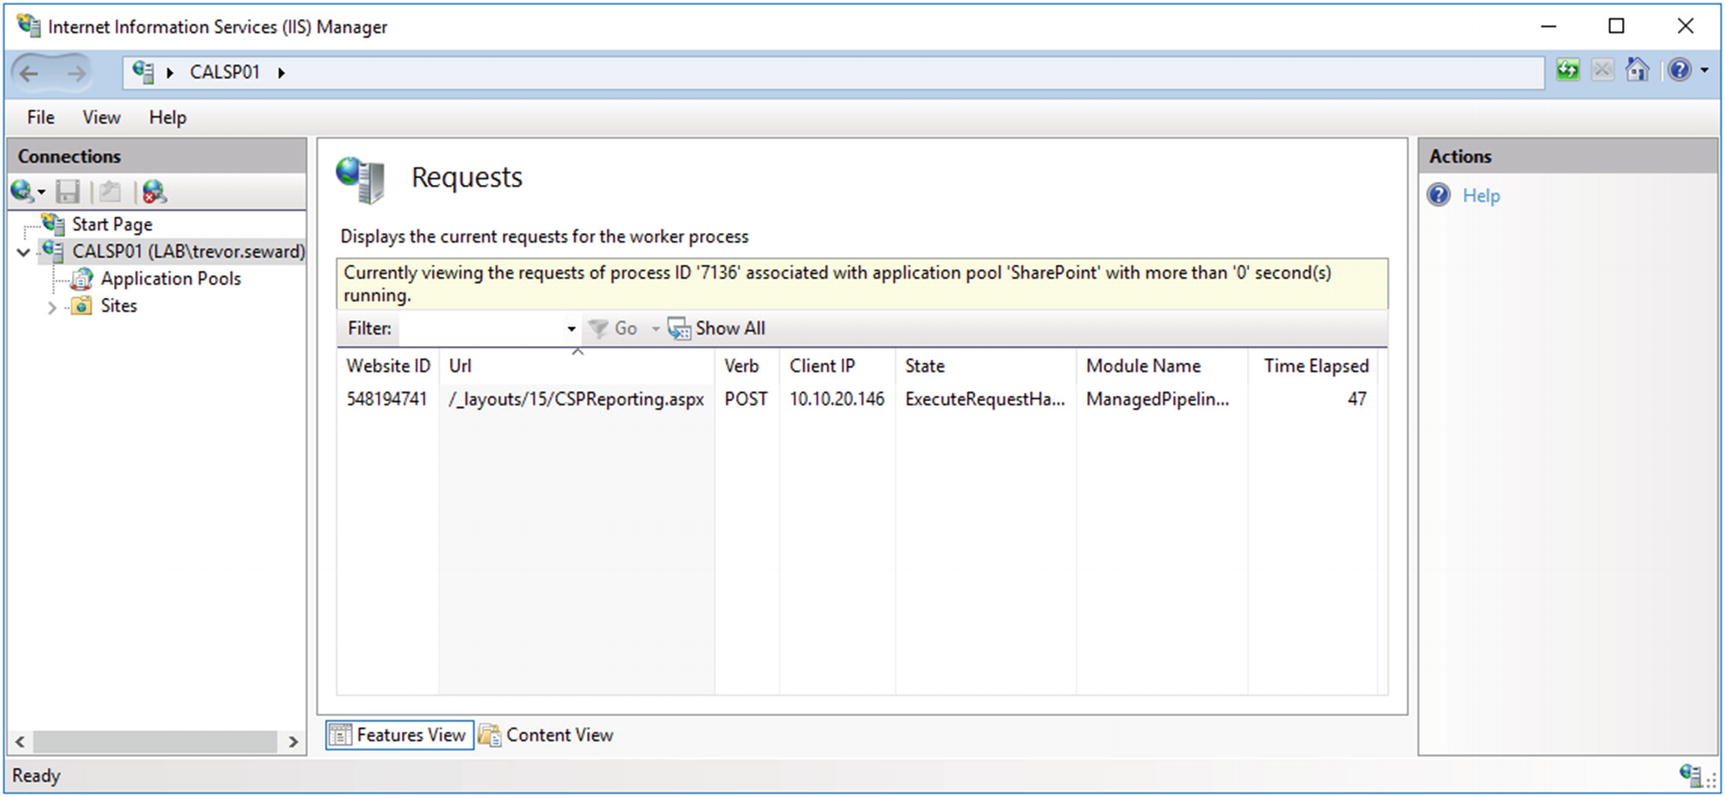
Running requests to the Worker Process

Usage Logging

SharePoint Usage Logging logs a variety of information to the Usage database. This database can be directly queried either through the tables or through the built-in Views. For example, the RequestUsage View can provide information on how long a particular request took, how many CPU megacycle it consumed, Distributed Cache reads and how long those Distributed Cache reads took, among other statistics.

Usage Logging can be configured in Central Administration under Monitoring, Configure usage and health data collection. There are a number of scenarios to gather data on, but only gather those scenarios you believe will be important for farm diagnostics. Logging more than is required may lead to farm performance issues as the data is transferred from the SharePoint farm into the Usage database, along with the Usage database size growth.

The Usage database may be queried directly via SQL Server Management Studio. Microsoft provisions Views for many common scenarios one may be interested in, as shown in Figure 19-11, but you may also construct your own Views within the database if needed.
../images/469662_1_En_19_Chapter/469662_1_En_19_Fig11_HTML.jpg
Figure 19-11

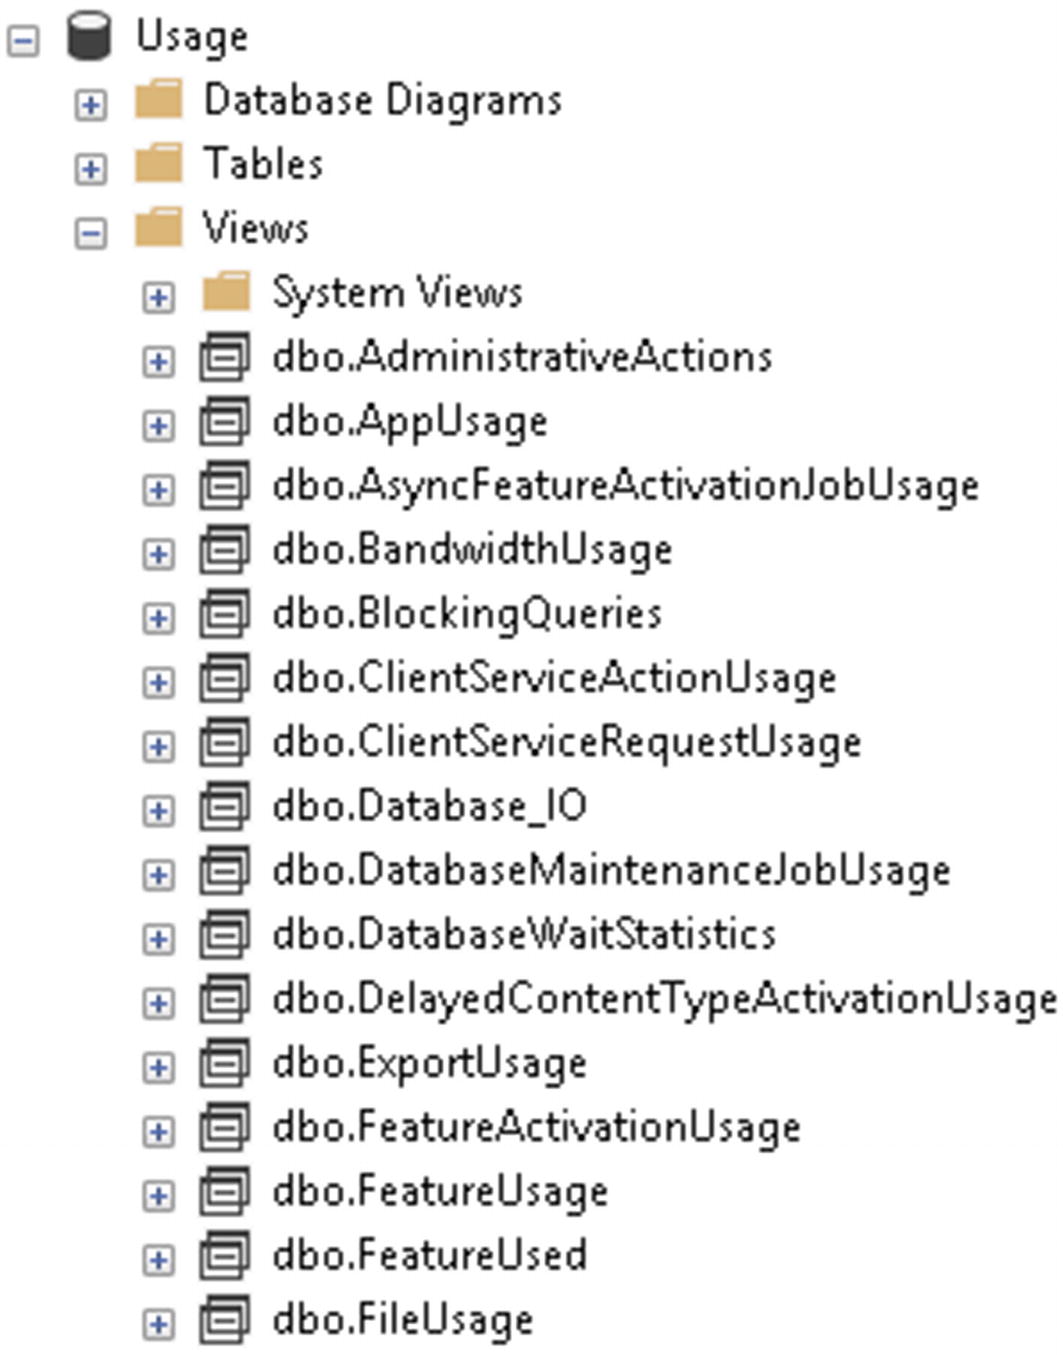
Many Views are provisioned out of the box with SharePoint

Querying the database is simple. As shown in Figure 19-12, construct your query of a View and select the columns you wish to display in the results, in the order you wish to display the results in. In this query, we are looking at the Administrative Actions View and select just the relevant columns that we’re interested in, then sorting by the time the log entry was created in the database, with the newest entries appearing first.
../images/469662_1_En_19_Chapter/469662_1_En_19_Fig12_HTML.jpg
Figure 19-12

A query of a View in the Usage database

Central Administration Health Analyzer

The built-in SharePoint Health Analyzer is a set of rules that run periodically via the SharePoint Timer Service. These rules detect various issues, as shown in Figure 19-13, such as SharePoint Application Pools recycling, or databases with a large amount of free space, and other minor to major issues with the farm.
../images/469662_1_En_19_Chapter/469662_1_En_19_Fig13_HTML.jpg
Figure 19-13

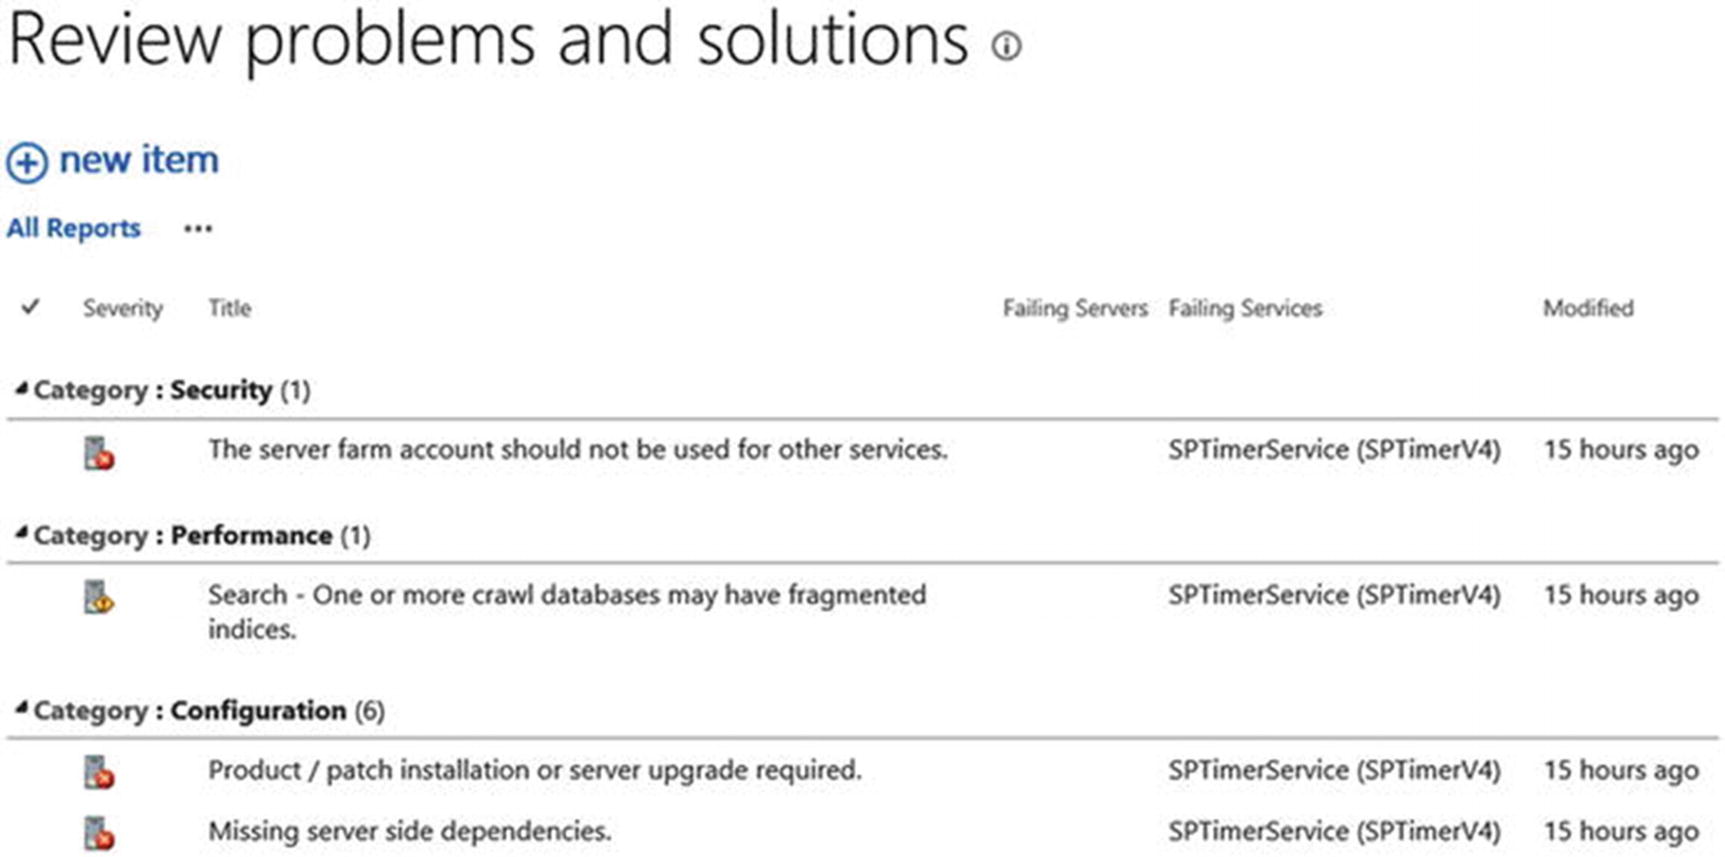
Reviewing Health Analyzer issues

While the Health Analyzer can be useful, there are rules which are out of date or Health Analyzer warnings which cannot be resolved. As these rules are written into SharePoint’s codebase, it is not possible to modify the rules. We have the option of simply disabling them or ignoring them within Central Administration. An example of one of these rules is “Some content databases are growing too large.” This rule looks at the size of the database. If the database exceeds 100 GB, the health analyzer rule shows a warning. However, we know that Microsoft supports multi-terabyte content databases. The rule was created when mechanical hard drives were in common use. This warning was primarily designed for backup and restore scenarios, where it may not have been possible to back up or restore a database exceeding 100 GB in a reasonable amount of time. With the wide deployment of either SSD or flash-based systems, these databases may be restored in a matter of minutes rather than hours. It is still important to monitor database size, but this should be done outside of the context of SharePoint with SQL Server database monitoring tools.

If there are rules which are not required, they can be disabled via the Review rule definitions, as shown in Figure 19-14. Each rule will have an Enabled checkbox. Simply uncheck it to disable the rule. You may then delete the Health Alert from the Health Analyzer and the raised issue will no longer appear.
../images/469662_1_En_19_Chapter/469662_1_En_19_Fig14_HTML.jpg
Figure 19-14

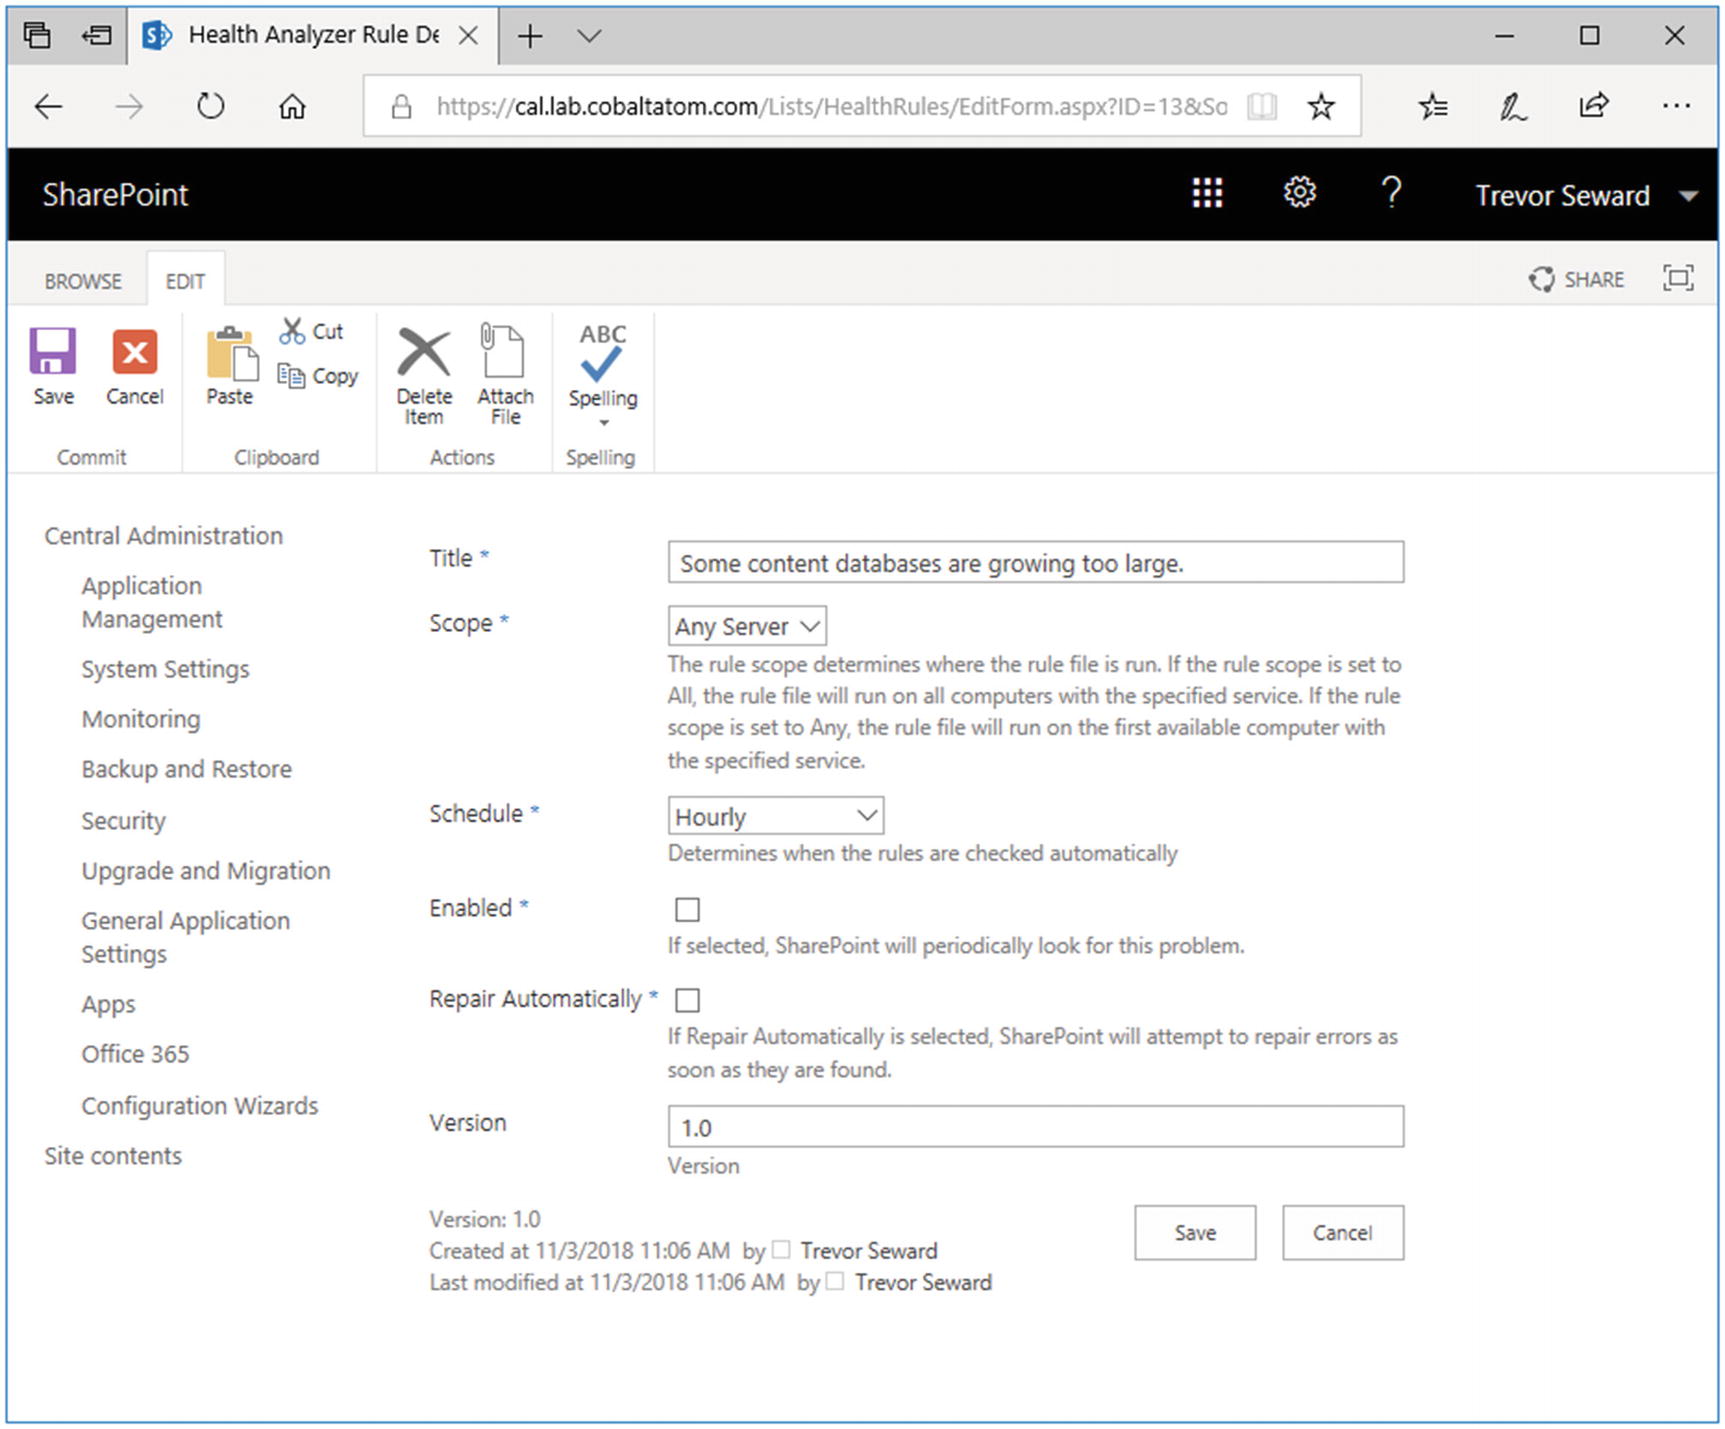
Disabling a Rule Definition

Performance Monitor for SharePoint

Performance Monitor may also be a useful tool for diagnosing server performance issues, such as examining outstanding ASP.NET requests, CPU usage by process, and so forth. The scenario in which Performance Monitor is used depends on the performance problem one is attempting to troubleshoot.

Performance Monitor for SQL Server

Performance monitoring of SQL Server can be quite in depth, but we will be skimming the surface here of “essential numbers.” For example, within the SQL Server Buffer Manager, Page Life Expectancy should be high. The value is measured in seconds; 300 seconds or higher is recommended in most systems. In addition, the Buffer Cache Hit Ratio should be well over 70 (or 70%). DMVs are also used to monitor SQL Server performance and are generally preferred over other methods.

Tip

Additional DMV information, including scripts to monitor DMVs are available from Glenn Berry at www.sqlskills.com/blogs/glenn/category/dmv-queries/ . Brent Ozar also offers DMV monitoring via sp_BlitzCache available at www.brentozar.com/blitzcache/ .

Maintaining SharePoint database is also important. With SharePoint Server 2019, databases are set to auto-update statistics, but it is still good practice to implement a maintenance plan to manually update statistics on a periodic basis. In addition, a plan should be set in place to maintain database indexes. One popular script to handle these tasks is available from Ola Hallengren at https://ola.hallengren.com/ .

..................Content has been hidden....................

You can't read the all page of ebook, please click here login for view all page.
Reset
18.220.1.239