DevOps has solved several software engineering problems, including the friction and delay in the software delivery and problem resolution. Being a manifesto designed more than a decade ago, DevOps now needs a redesign in its software development, management, and delivery, approaches. This planning can help solve the loopholes in the pipelines and cycles in DevOps. The starting principles of DevOps needed a quick response for user needs/bugs and less friction between teams—typically the development and operational teams. Although DevOps approaches these problems quite fairly, what it misses is the important aspect of modern software: the maintenance of the software.
A modern approach to software development requires the product have enough security, performance, and efficiency, and a better UX to enable customers to perform their tasks. Users should also be able to know how the application uses the data it receives. One of the main emphases put on today’s software is on security and data privacy. Security comes in all shapes and sizes. A solution must run on a desktop, a mobile device, a distributed environment on the cloud, and the smallest and lowest powered of the devices, the IoT. Our software comes toe to toe with unwanted user interactions on the interface and attacks on the servers that might compromise not only the solution but also the data of other users.
Integrating security and code quality checks in continuous integration tools.
Improving the performance of applications through several static code-analysis packages.
NuGet—and .NET Core friendly—packages that can help developers get started in no time.
The dotnet command-line interface for .NET Core development.
DevOps is a big thing, and it starts with the ownership of the product.
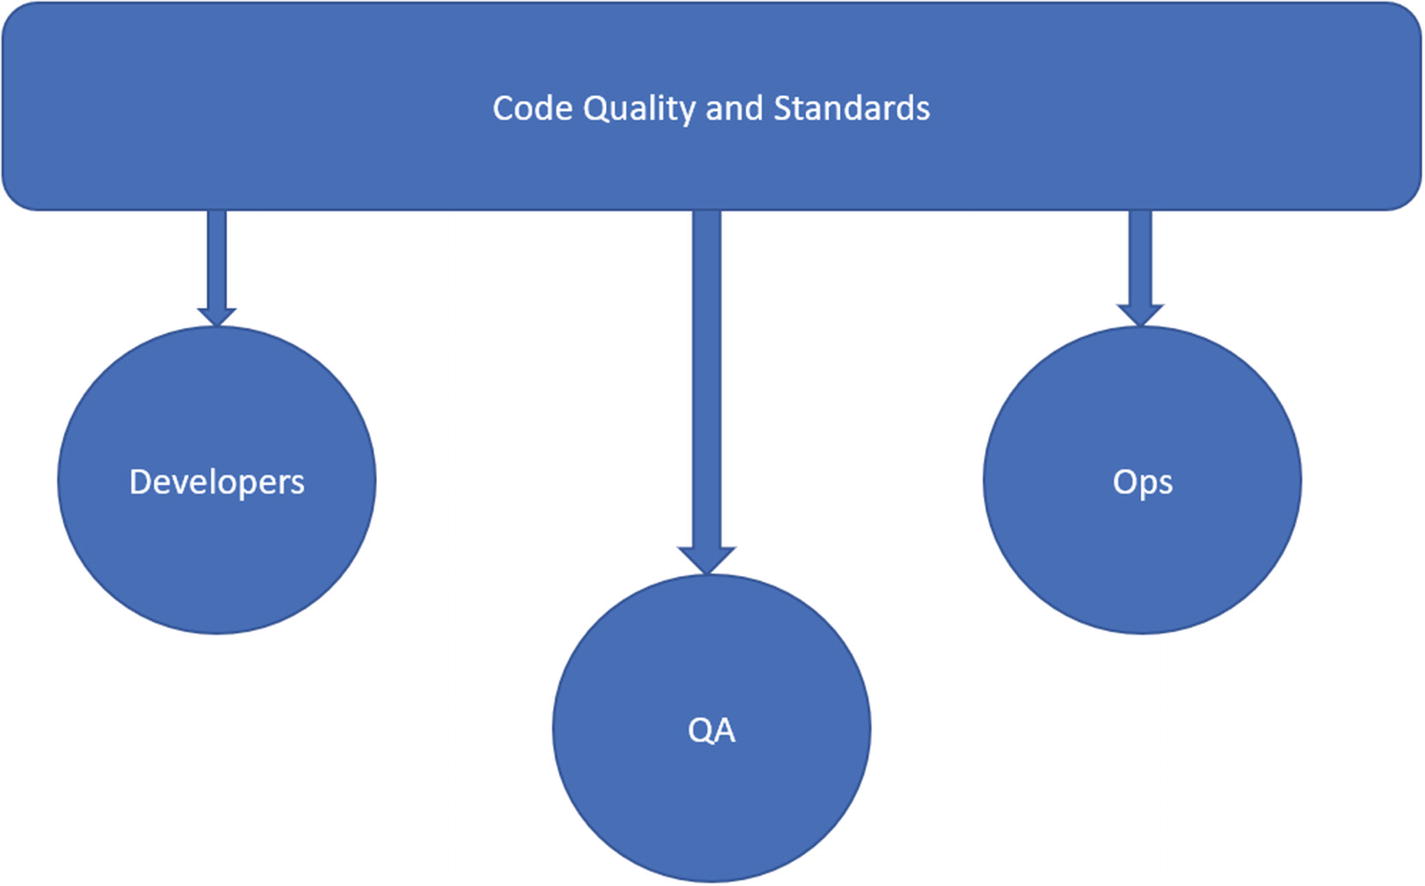
The DevOps Cycle

DevOps introduces complete ownership of the product, merging the three departments and introducing a central repository
These three departments of an organization work together—sometimes as part of the team—to manage the complete lifecycle of the product. In a typical DevOps cycle, we have our developers, IT, and operations teams, as well as the QA engineers. These teams work together to completely manage a product lifecycle—from inception to deployment and management. Some organizations like to call it “DevOps,” whereas some prefer the term “Site Reliability Engineers” (or SRE for short). The preference for either one is okay, and the only difference is that SRE is a real role that an engineer can take. DevOps is a set of principles that helps organizations revamp themselves and their teams. Restructuring the teams helps the software grow better.
The introduction of code quality checks for new code commits.
Verification of code standards/style implemented by the organization for code readability and improvements.
Static code analysis to detect unwanted code smell or code complexity.
Secure build process using Docker and (verified) containers.
Host platform inspection and analysis for potential security loopholes.
That is why every modern DevOps toolchain1 includes software packages that analyze your software code base. These extensions also explore the possibility of anti-patterns introduced by other teams in the organization.
We will analyze how our most simple code can be exposed to potential security risks and poor performance and will fix those problems in the next chapter!
Adding Security
The addition of Sec to DevOps is like the addition of code policies to your current continuous integration jobs
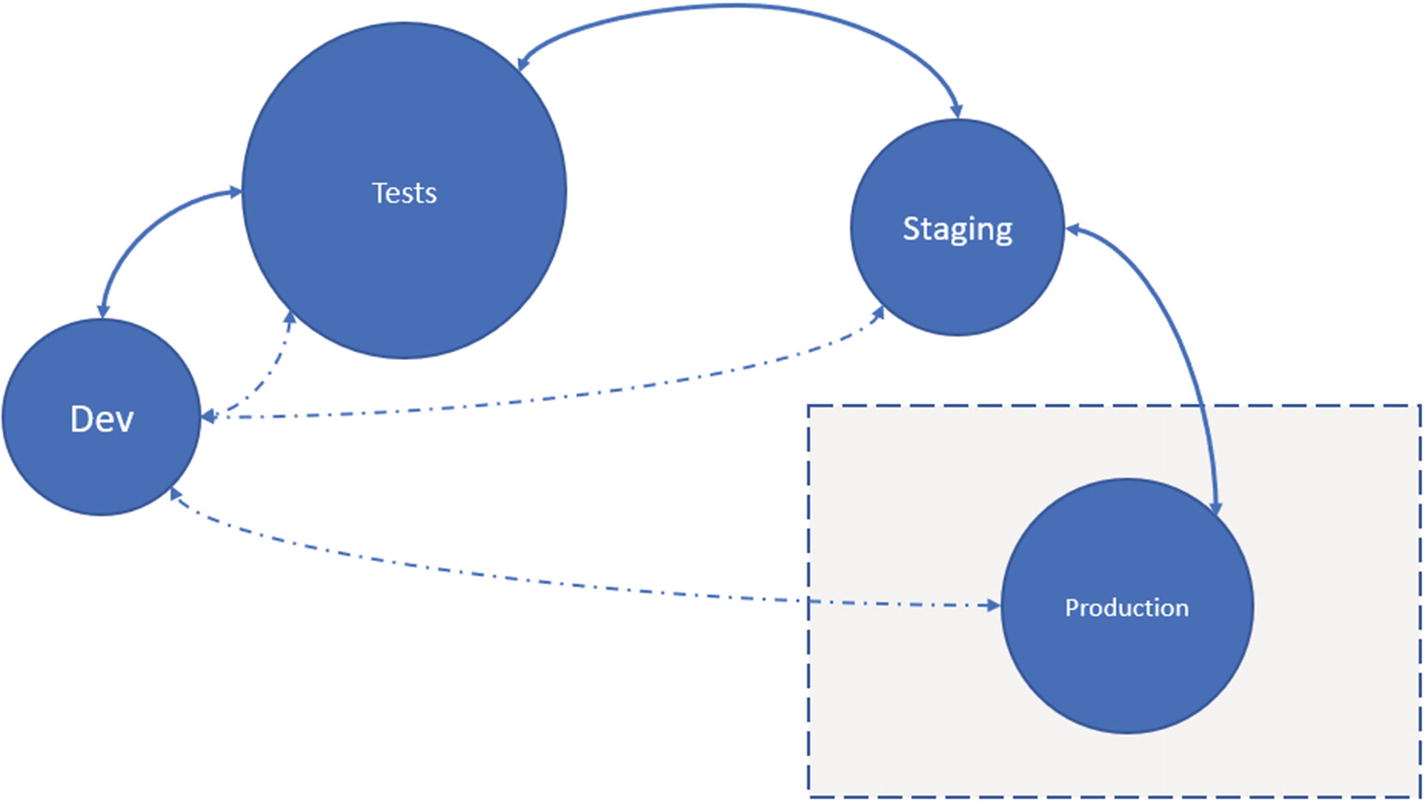
DevOps maintains the developers in the center of all the events. Every stage needs to pass; otherwise, the changes are rejected, and the developer is notified. Production environments have a special requirement to deploy to, as well as to capture the events from. Administrative privileges are needed
In other words, your build no longer passes if the code compiles. Your build pipeline analyzes the code that is committed. It verifies that the code complexity, duplication, and smell are all under a strict threshold before it is verified to be a “valid integration.”
.NET Core code uses a middleware-approach to build solutions for web apps, microservices, and desktop apps. This helps developers use a buffet-style dependency injection that supports the maintenance of the software as its complexity grows over time.
Sec: Security, Performance, and Productivity
Writing quality code not only secures the product but also improves the maintainability of the code as well as its performance. The standards that are set help some coding conventions.2 A static code-analysis package can read the code and verify if it conforms to the standards enforced by the owner of the repository. Better code also results in the best performance based on the use-case and yields an efficient software product. We are talking about .NET Core, and ultimately the topic will cover everything that C#—and sometimes F#—has in language design that can help code design and standards.
Now, let’s go ahead and create a basic .NET Core console application. Then we’ll see how our common “hello world” applications might need a code review (we’ll also see how some code reviews by the software are not necessary and how to ignore them).
How does code review work? The same way that spell correction tools work. As you are writing a paragraph, the program checks your paragraph for spelling or grammar mistakes. It also suggests changes that can improve the overall structure of the paragraph.
Simple .NET Core App
We will keep things simple and beginner-level throughout the chapter but will review how to get started with the integration of code-review and code-analysis extensions and packages.
.NET Core enables you to use graphical IDEs3 or native command-line interfaces and text editors. To keep things balanced, we will focus on both approaches. I will demonstrate both approaches (where necessary) and focus more on the command-line interfaces to incorporate the automation side of DevOps.
The $ character in the command is not entered into the terminal. It is a sign to indicate that the command has to be entered directly into a terminal.
Program.cs (the default name of a main file is Program in C#)
Project.csproj
You might say that this is a very basic level of C# code and that, since this is written by Microsoft engineers, it would be good quality. You might be4 wrong here. The output of this program is not relevant. What is relevant is the code standard.
This command performs the dotnet build internally, which then executes the dotnet restore internally.
You might also notice that, although the project is built, no output is shown. To see the output of different commands, like dotnet build and dotnet restore, you need to execute the respective command in the terminal.
Manual Builds
Downloading and adding packages from NuGet (also done using dotnet restore).
Maintaining the local project references and building the dependency projects (or attempting to).
This step is like recursion, and .NET Core builds the packages, downloads their dependencies, and builds any dependency projects that are listed.
Building the project.
Creating the specific folders where the built content is stored.
For our “hello world” project, all that happens is that it builds and generates the executable files, based on the underlying OS.7 You can set up the local builds this way. This step is necessary while developing using a text editor (including Visual Studio Code), but on an IDE such as Visual Studio, all these tasks are done by the IDE itself. The overall process is the same, but you can decide whether you want to have a hands-on experience working with the command-line interface, or you want to focus more on the business logic.
The dotnet command is also used in other tools such as Docker, or DevOps tools to automate the build setups. It is better to understand how the command works before implementing the DevOps pipeline.
Basic Testing and QA
No repository lets contributors add code that does not contain associated tests with it. In my own experience, I have collaborated on the Flutter8 repository on GitHub. Flutter developers had added checks to verify whether I added tests to verify my code. Similarly, every other project has some tests that verify the overall quality of the product after your code gets merged—and notifies is something fails. Now that our application can sum two integers and return the result as an integer. We need to make sure that the code performs as it is expected to perform.
On .NET Core we have several library options available to write testing scripts for our projects. Although we do discuss a broader set of tests throughout the book, for now, we will only focus on the unit testing approach for .NET Core. I will walk you through the usage of the XUnit library and a few of its options to create the tests that can help you maintain a stable version of your product.
Remember, lines starting with $ are the commands to be executed, and other lines are the potential output for these commands.
Arrange
Act
Assert
Since our package only had a single test, it printed one test found in the console and ran it. This verifies that our project works as expected. We can use the dotnet test CLI in our DevOps pipelines to verify the quality of the code that comes from contributors. If there is a minor bug in our code, the test will fail, ultimately causing the build to fail and the DevOps cycle to stop. This can also alert the team to review the code and fix any problems before accepting the changes.

Visual Studio shows the overall references that a class and its members have, and the number of tests for the members and how many passes/fail
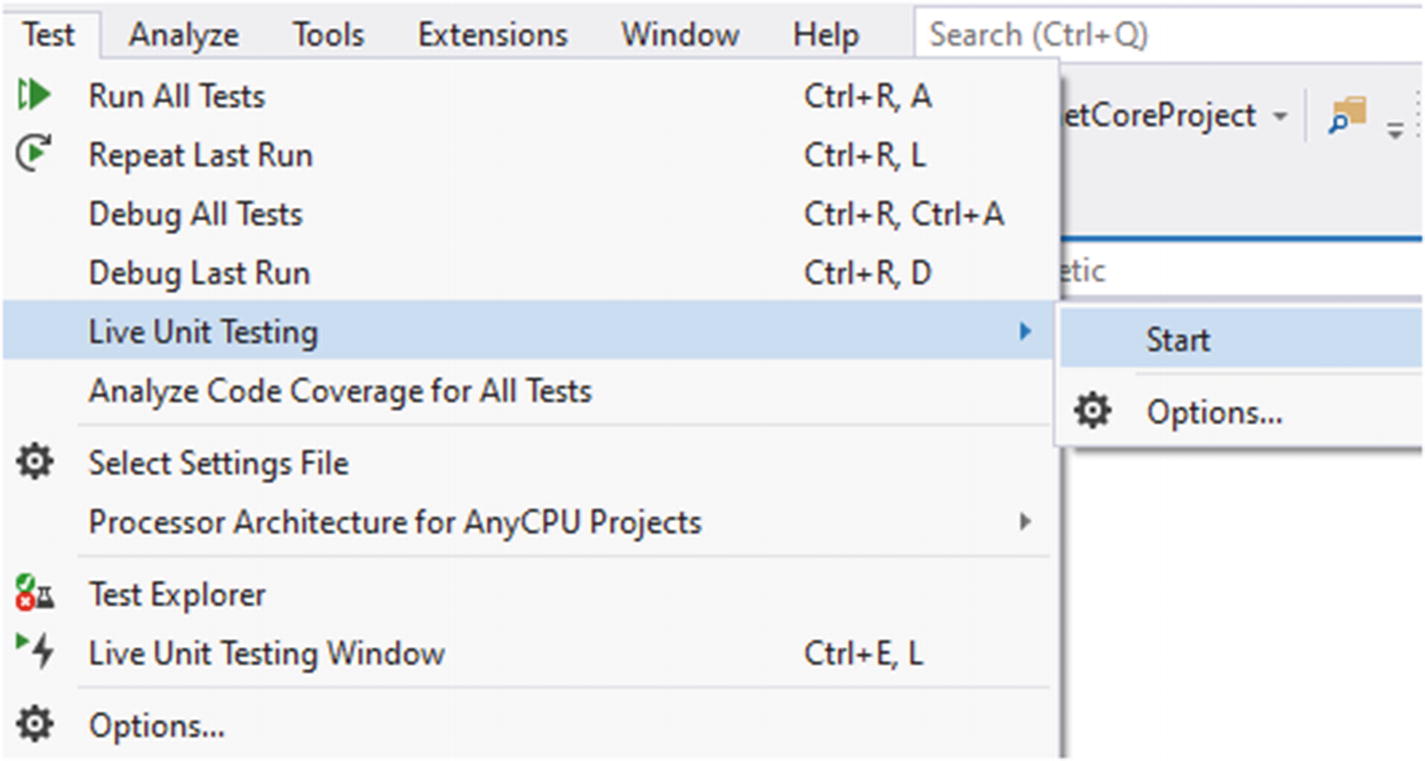
You can find the option under Test ➤ Live Unit Testing ➤ Start
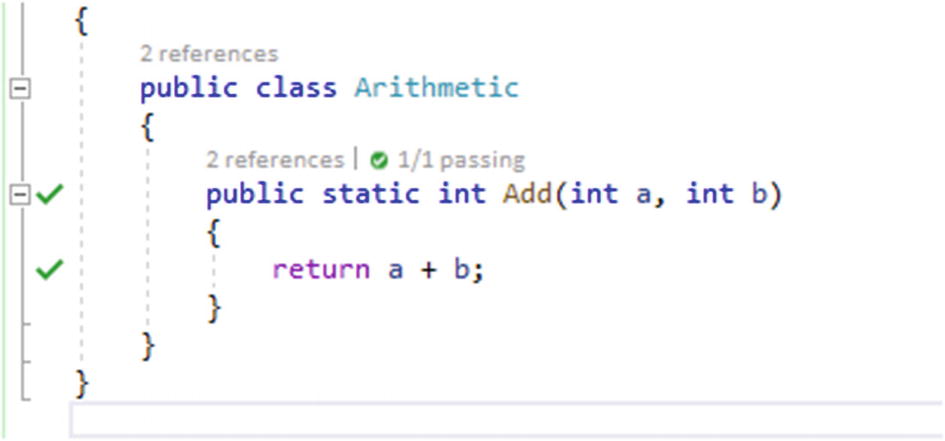
Two ticks in the gutter show the lines of code where the tests pass

Change the code to assert the result to be equal to the wrong output

Functions show a red x, demonstrating the tests failure
This gives us a hint as to how dotnet CLI builds dependency projects and prepares them to be linked to our projects.
Code-Analysis Services
Our application successfully builds and runs as expected. If you see the build outputs, you will see that each build result logs the same thing: 0 warnings and 0 errors. For a hobby or boilerplate project, this might be enough as a hint to upload the project online. But for projects that require production use or are already published online, it is our responsibility to improve the quality of the code from every side.
Performance
Security
Readability
Maintenance
Memory leaks
Anti-patterns
It might also be difficult for a novice developer to know how to tackle all these. We will focus on how to solve these problems in the next chapter. For now, we can see how to introduce packages and libraries that check our projects for any loopholes in these categories.
Previously we executed the test cases to see if the output of our program was correct. In the later sections of this chapter, we will use the (NuGet) packages that can read the code without executing and return any problems that they find in code. Analyzing the source code in this way is called “static code analysis.” In this approach, you, as a developer, do not run the code nor build it. Your tools read the code and check for any code smells. If they find a code smell or an anti-pattern being used, these tools automatically report it to the developer, along with a potential fix.
StyleCops.Analyzers
StyleCops.Analyzers is one of the tools that allow us to analyze the source code and check for any bugs. Previously, it was made available as a Visual Studio extension that you download and install. Now—thanks to the Roslyn compiler platform—it is also available as a NuGet package that can be downloaded. The NuGet package is the recommended approach to download and set up the build job.
StyleCops.Analyzers runs with the build job and reports any problems with the code. Previously, our jobs succeeded and did not report any problems with the code. We will add the package for StyleCops.Analyzers and then run the build again and study the results.
You can install the Visual Studio extension for StyleCop.11 We highly recommend and encourage you to download and install StyleCop.Analyzers from the NuGet package manager. The benefit you get by using NuGet is that everyone gets to use code analysis without having to install anything. The NuGet package manager provides a native development experience for .NET Core developers. If there is an update for the package, you can easily upgrade your existing packages with a single command. Finally, NuGet packages depend on your .NET Core version and not the Visual Studio version. The packages are available in environments where Visual Studio is not available, such as Linux or MacOS.
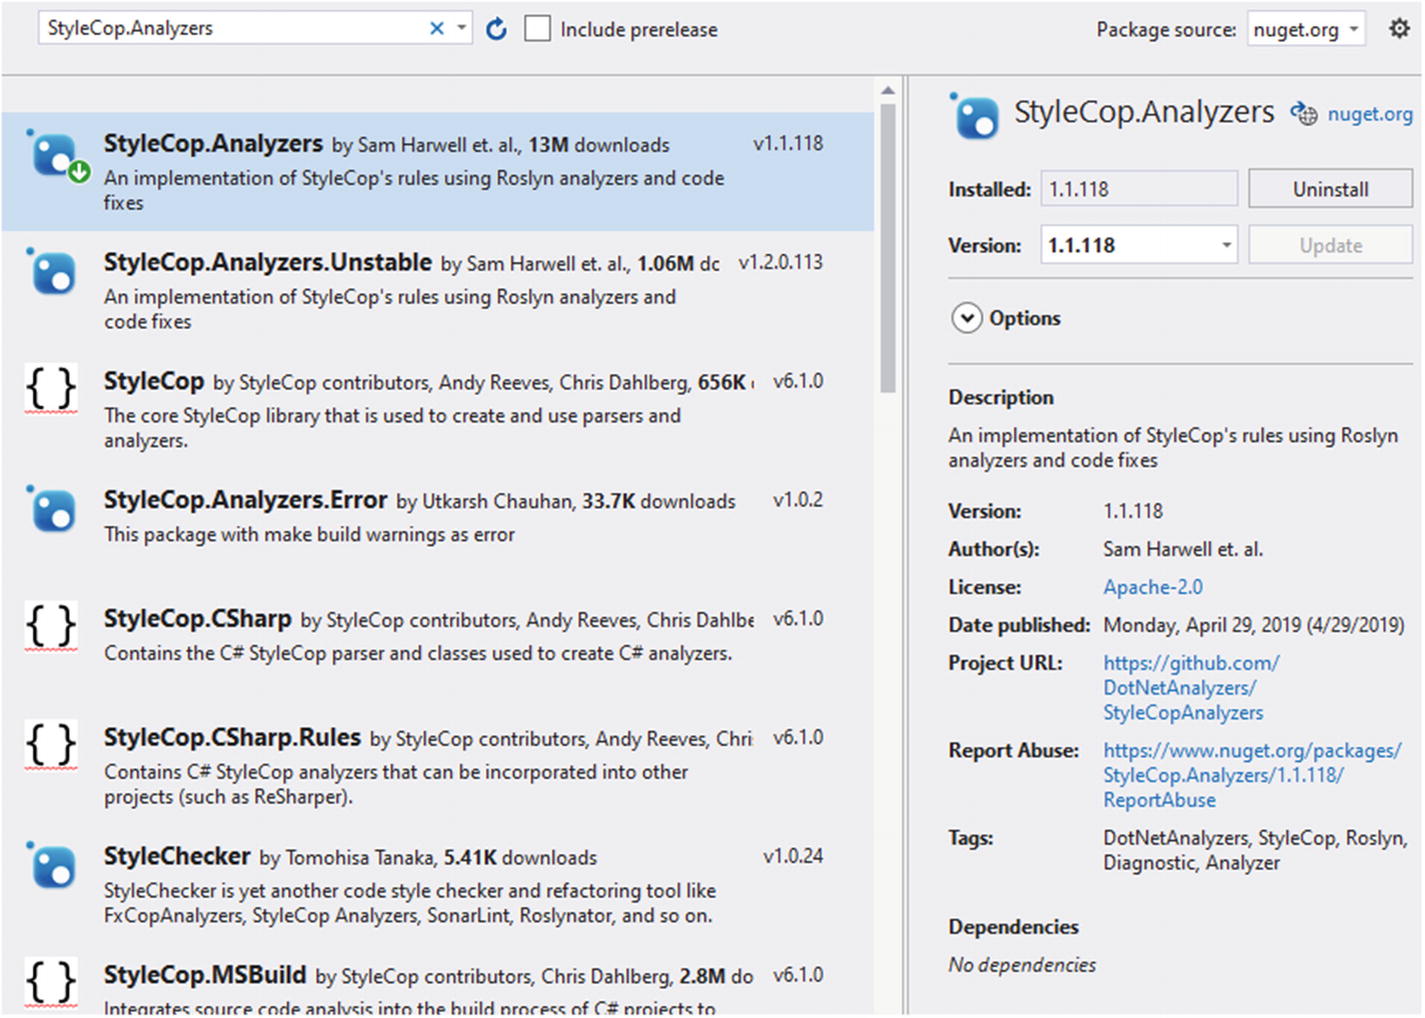
NuGet package manager showing results for StyleCop.Analyzers
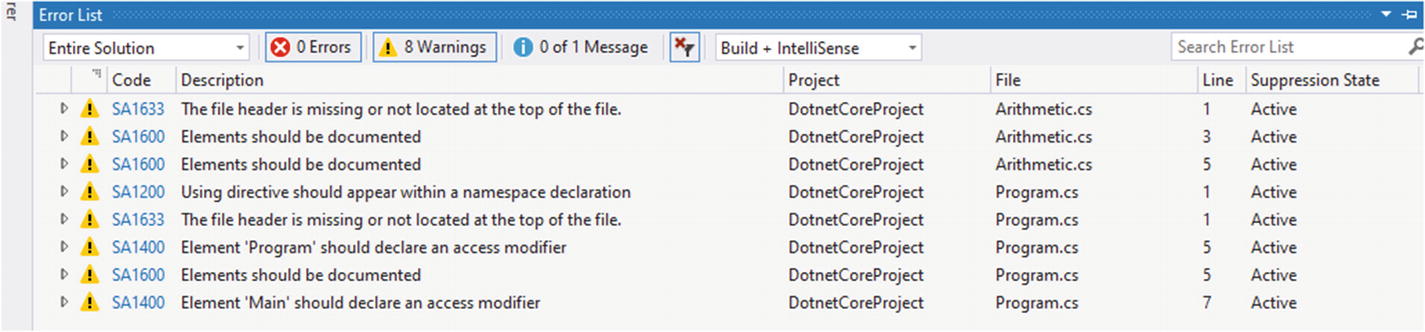
Warnings are shown by the code analysis in Visual Studio
As you see, none of these are errors and will not break the build automatically. But they help the developers enforce policies for code standards and qualities. Several warnings say that the “elements should be documented.” This provides an easy check to verify if everything in the project has an associated comment with it. Comments in the .NET Core environment have always proven to be useful and they help developers quickly make their way through difficult code. Then there are a few other warning messages, such as “Element ‘Program’ should declare an access modifier.” This message tells us that the code is missing an access modifier in the program. Leaving these can direct the compiler to use implicit access modifiers, which can sometimes lead to unexpected code and results.
We are not required to solve these warnings and fix them. You can safely ignore them if you think you know what you are doing. There are also ways in which you can politely silent the rules12 in the package. There is an intensive amount of documentation available on the GitHub repository that can help you get started with the installation and configuration of this package to suit your needs.

Code analysis configuration in JSON, showing different options to configure the rule sets for language analysis
Visual Studio provides a good autocomplete suggestion for the rule configuration. You can commit this configuration file along with the code so that everyone uses the same configuration throughout the repository.
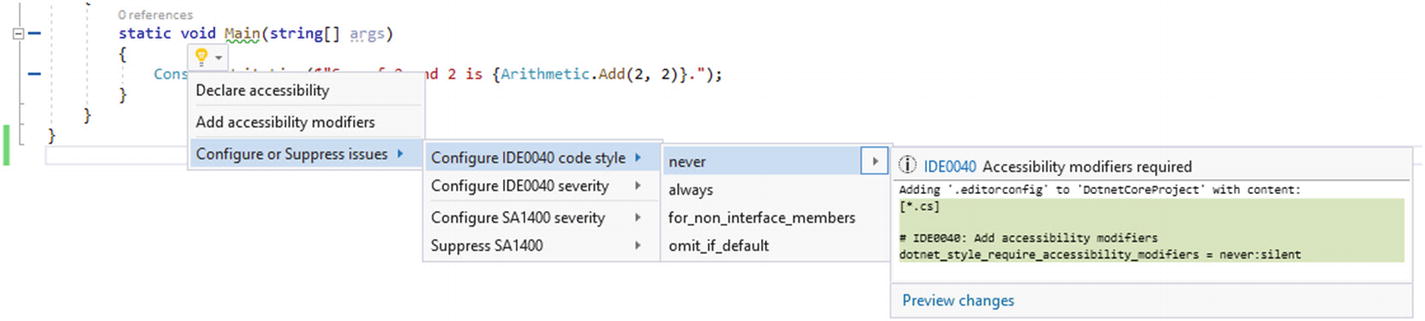
Visual Studio shows options to apply code improvement suggestions to your project using Visual Studio internal suggestions as well as third-party suggestions
Both are plain-text files, and you can use them in Visual Studio or non-Visual Studio environments. The difference is that Visual Studio also provides an autocomplete feature that might not be available in other IDEs. It is best to keep these files in your version control. These settings can be applied across devices and development environments on your machines. They can also help enforce a standard of development.
The problem with package-based code-analysis solutions is that they are limited in their functionality and features. Most tools are prohibitively expensive for indie developers and sometimes require an enterprise license.
Codacy Overview
If you are using GitHub or BitBucket, then you can use a hosted solution to analyze your code and find any bugs or code smells. Codacy14 is a hosted code-analysis solution that uses GitHub or BitBucket repositories. Codacy takes the code analysis one step further and uses online databases to scan the code against any known vulnerabilities and code smells. Let’s now see how this free service can extend the capabilities of code analysis for your project.

Codacy showing the list of active repositories a user has access to
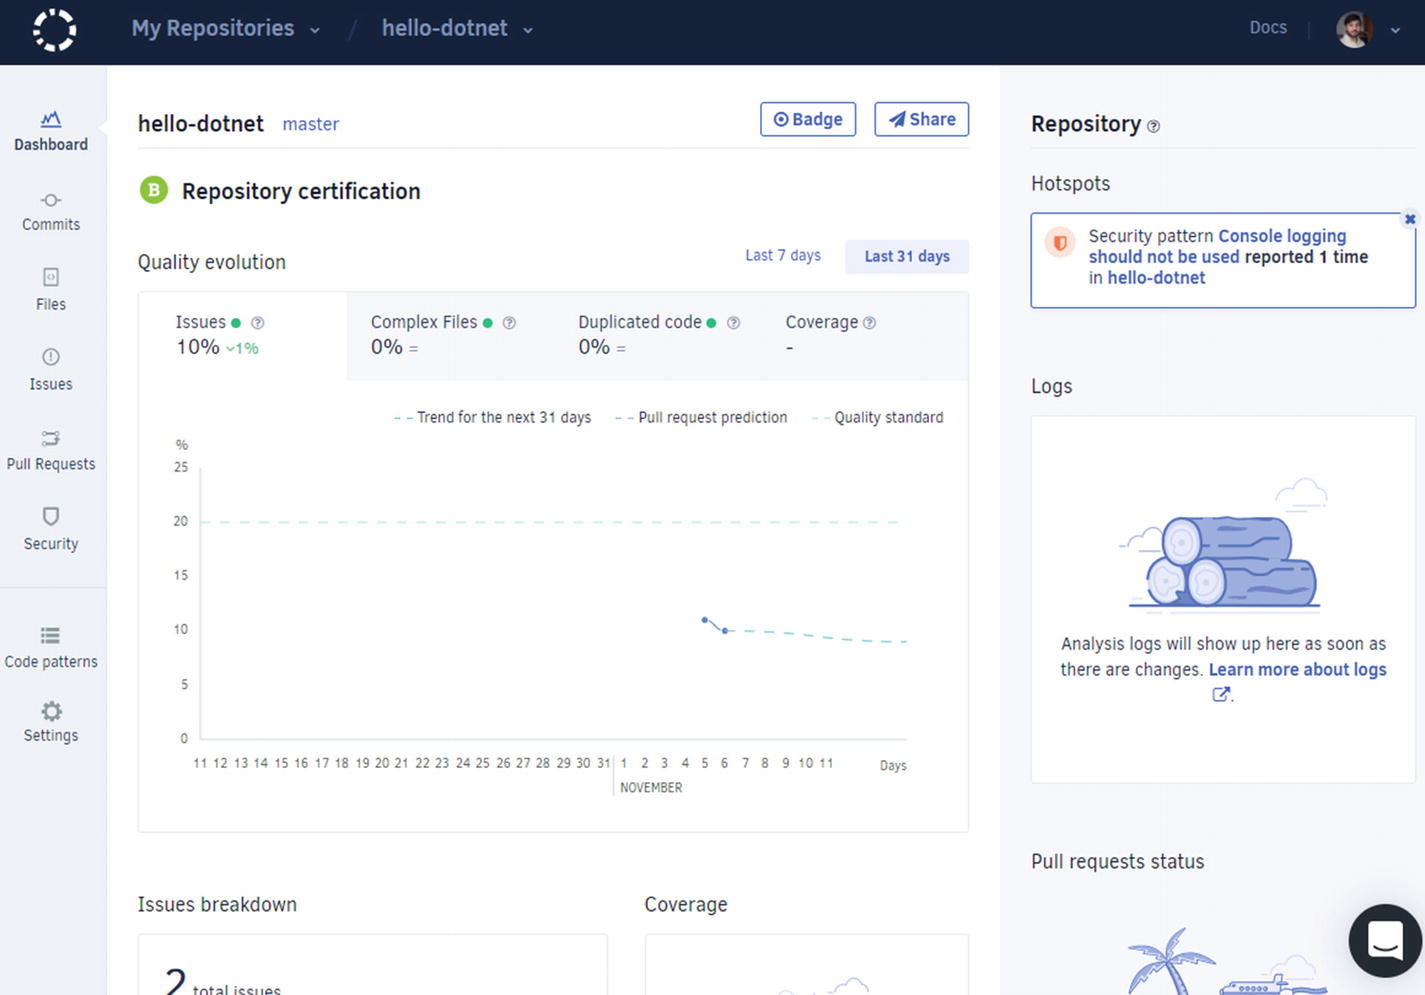
Codacy shows the dashboard for.NET Core based projects and shows the number of issues discovered in the project
This dashboard might be different in your case. But the point is that it shows the details about your project, from the security flaws, code smells, anti-patterns being employed, all the way to code complexity, and the code duplication in your project. This is the benefit of using Codacy over local code-analysis tools and frameworks. You can also configure the way Codacy reviews your code and much more.
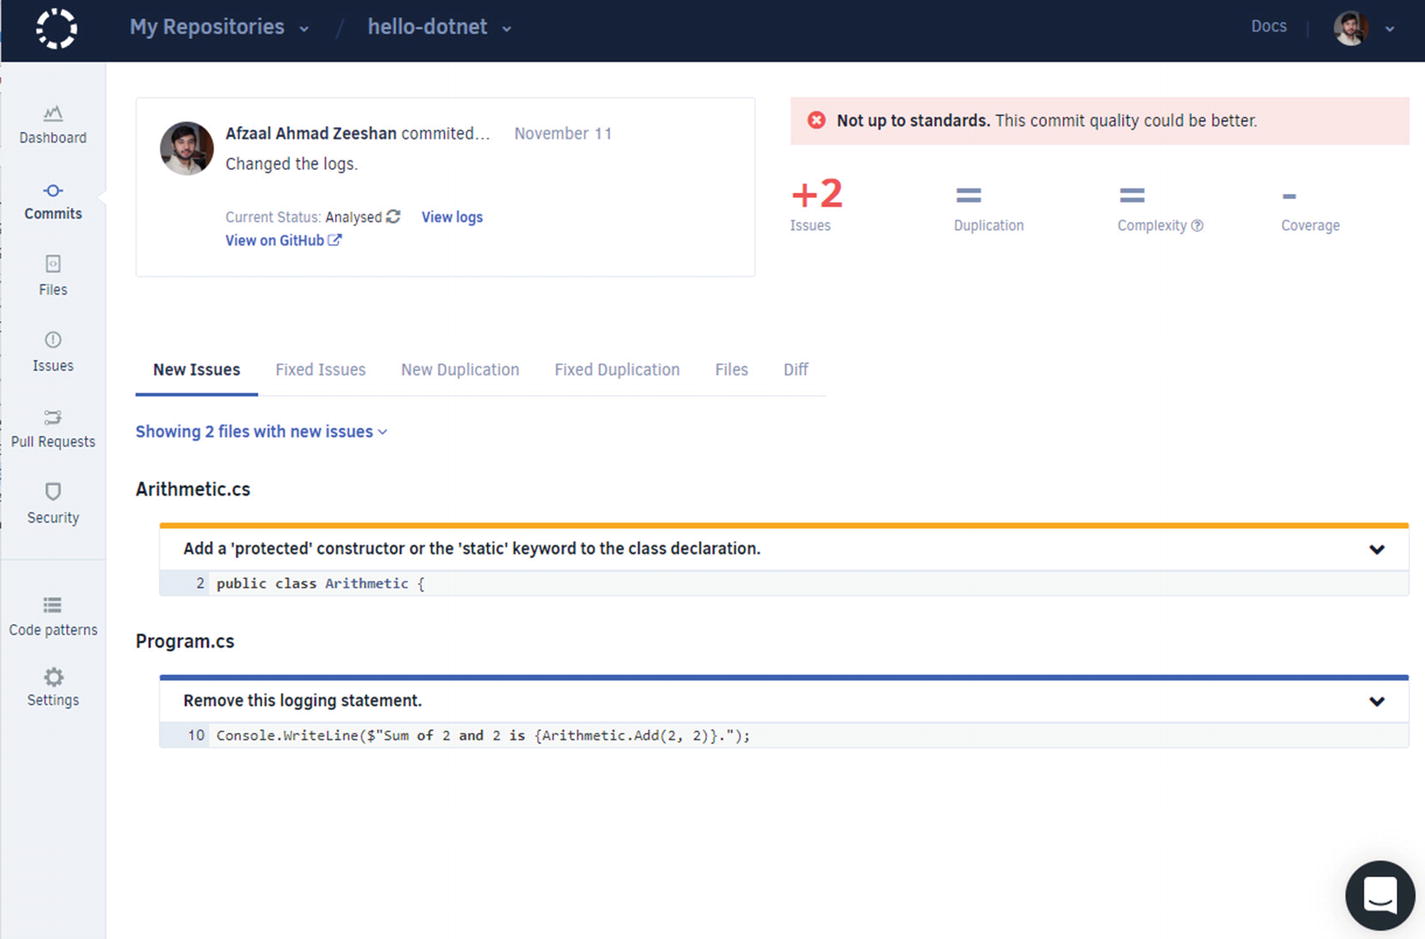
Codacy showing the issues in the project and the line numbers where they are found

Codacy page with an explanation of the code smell and how to solve it
This shows that the code we have needs some rewriting. Our analysis clearly suggests that logging is not friendly in a production environment, especially if you are logging system- or solution-related information, such as bugs and exception details. It is better to use external logging services, such as Azure Application Insights or Google Analytics, to store and preview the logs. We will discuss those points in a later chapter.
You can also ignore these settings if you want to. For example, in this case, we know that we are not logging out potentially sensitive information. Thus, we can ignore the problem. Or a better option is to use the suggestions mentioned in the “Exceptions” heading in Figure 2-16.
ASP.NET Core Sample
The .NET Core framework exposes different templates to be used for web development purposes. You can use MVC, Angular, React, and gRPC to develop web applications. Use the dotnet new --help command to learn more about this topic.
This command creates the project and sets things up for you. We do not need to verify its “hello world” page, as we know it works just fine as a template. If you still want to verify things, just execute docker build .

Codacy showing a dashboard for an ASP.NET Core web application, including a summary of issues and the audit logs for the actions taking place in the account
There are several problems with this boilerplate “hello world” project of ASP.NET Core. Most developers use a boilerplate project and develop their own solutions on top of that, making the bugs even worse to find and solve. A good summary of the to-do points is given in the top-right corner of the web page. You can preview the types of problems that are being faced in the project right now. In teams that use GitHub for collaboration, Codacy extension15 can be set up for a GitHub Action that can extend the CI on GitHub repositories. This can provide you with real-time analysis of the code that is being contributed to your repositories.
We will not go into the ASP.NET Core project right now as that will lead us off-topic from this chapter, where we only need to lay the foundation for security and performance best practices in our projects.
Oh, and maybe you didn’t notice, but Codacy also features an auditing system that logs every action that has taken place in the account. This helps you see if any changes were made to the settings for code analysis and revert any changes if they are not needed.
Every hosted solution provider features an audit service. The audit service is your best friend, and you should visit it often. It lists every action that happens in your account/subscription/service. This helps you track down the root cause of downtime or perform an unbiased post-mortem of solutions and failures.
HTTPS vs. SSH
Open source repositories offer two options to connect and collaborate. Almost every repository that is available online uses HTTPS and SSH as two modes of authentication and authenticity. HTTPS is the secure transport over HTTP that uses public/private SSL certificates to verify the authenticity of the source. SSH, on the other hand, uses the terminal over a secure connection. By “secure,” we mean to say that the communication is encrypted as compared to plain-text communication over the network.
HTTPS is the simplest form of authentication and identity verification. You need to use your username/password combination to authenticate yourself. But since you are using encrypted traffic, your username and password are safe on the network. But it has a poor experience since you might be needed to input the username/password each time you connect to the repository.
SSH, on the other hand, is an advanced topic and might be difficult for beginners. SSH uses public/private certificates and authenticates the identity of the user and the remote servers.
GitHub

GitHub account settings and SSH and GPG key addition page
You can follow the steps provided on the Settings page to create your own SSH and GPG keys.

GitHub settings page to create new personal access tokens

A Jenkins page to connect to GitHub and access repositories. This is a Jenkins Blue Ocean page

GitHub Personal Access Token configuration page showing different permissions to be granted to a token
You can use this authentication approach if your organization uses Jenkins for DevOps. There are fewer benefits to this approach for an individual developer because it takes away the freedom of tool selection for DevOps and the platform. Also, Jenkins needs to be hosted on a platform and that adds to the complexity of your infrastructure.
GitLab
SSH and GPG keys
Personal access tokens
Username/password
This means that GitHub and GitLab provide a similar experience for average users. For advanced users, you can create SSH keys and GPG keys to verify the communication and your commits. The standards for SSH and GPG are the same, so an SSH key created for GitHub can also be used for GitLab.16 The Personal Access Tokens are created with permissions for different services just the way they are created for GitHub.
The primary difference between GitHub and GitLab is that GitLab provides a different concept of (an unlimited number of) private repositories and groups. So, if you are a student, I recommend that you start with GitLab if you want to explore Git version control while keeping your repositories private.
Azure DevOps
Azure DevOps (previously known as Visual Studio Team Services, and before that known as Visual Studio Online) supports Git and TFS version control. Accounts created on Azure DevOps consider these different version controls and decide which to use.
Personal access tokens
SSH keys
Username/password
This list shows the authentication modes in order of how secure they are. Personal Access Tokens are the most secure option for authentication, as they do not contain your account details (username/password). The SSH keys are the same as GitHub/GitLab. They offer the same features to connect to Azure DevOps repositories using a secure session in your terminal and encrypt the communication.
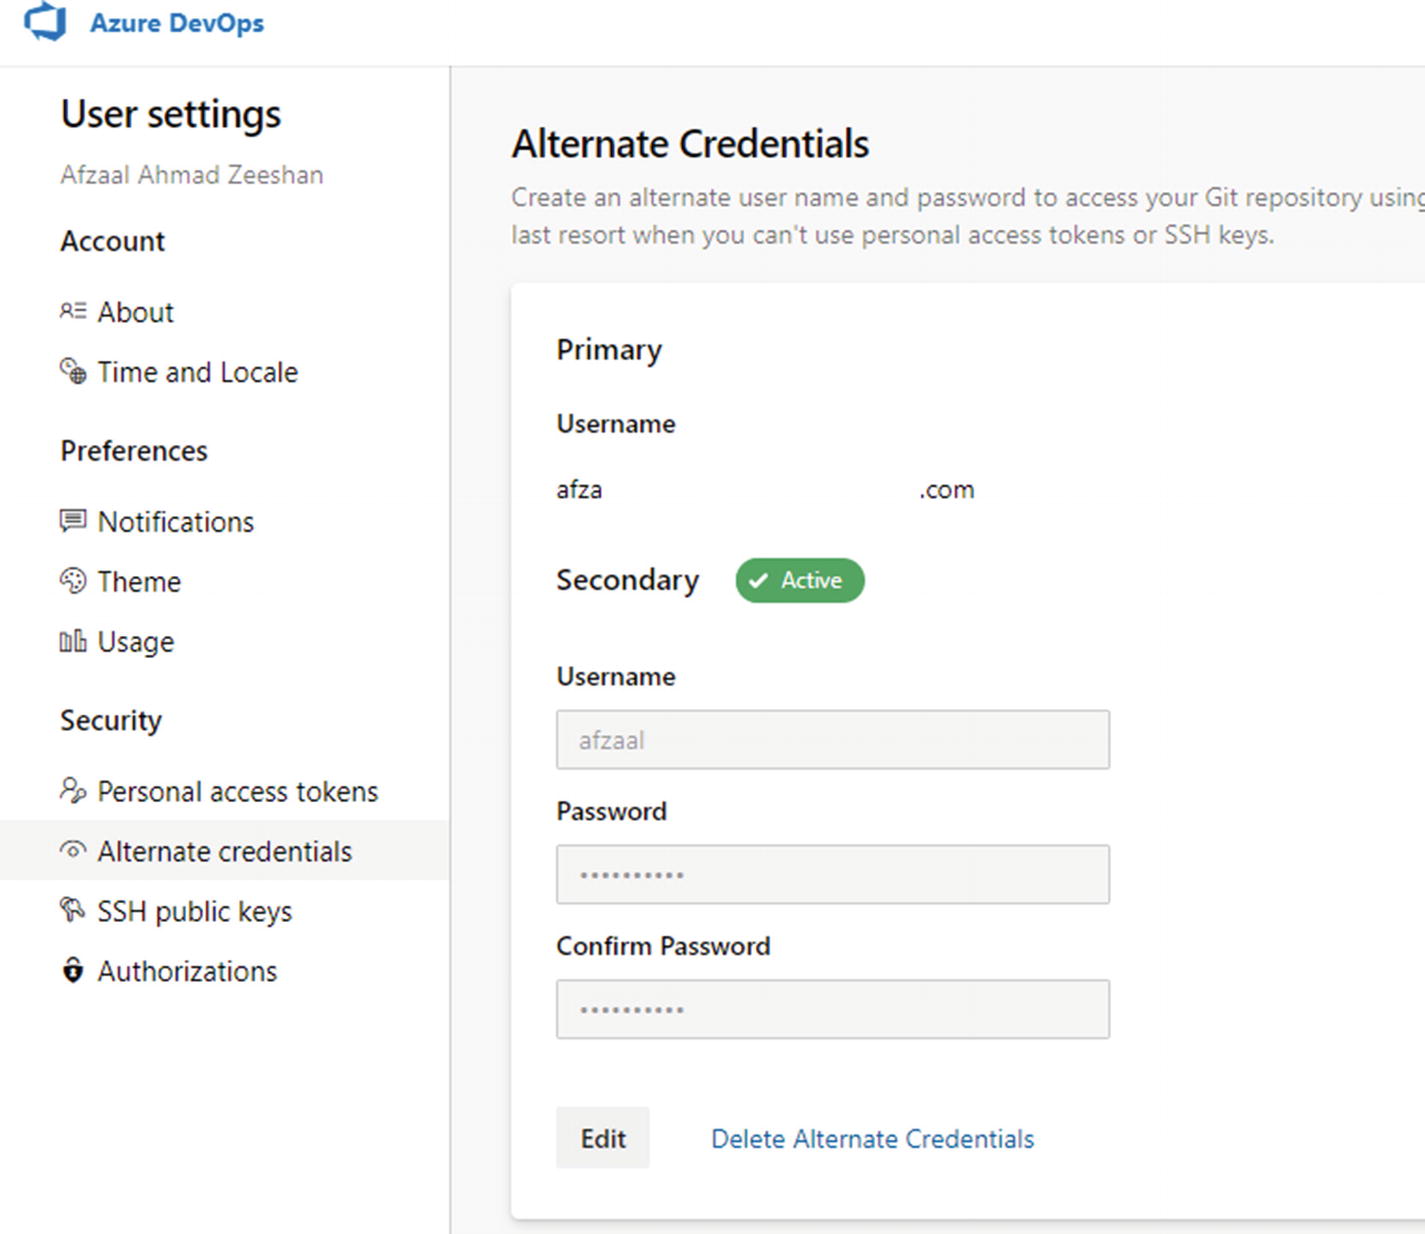
The Azure DevOps Alternate Credentials page, showing the default and secondary usernames. This page also lets you modify the secondary credentials and select the default ones to use with the Git command-line interface
As Figure 2-22 shows, the usernames can be modified according to the organization that you are working in. This means you can use the dynamic username/password for authentication but maintain the same account for work.
These are the primary authentication tips that you need to know while working in Git environments. Since you need to write secure code, it is also necessary to commit it securely. You need to verify the authenticity of the users who are making changes for audit purposes and use git-blame properly.
Summary
In this chapter, we started with the basic introduction of DevOps and how the addition of “Sec” can help organizations maintain the standards and quality of the code in their projects. We discussed a basic “hello world” application using .NET Core and explored how the addition of very simple packages can improve the quality of development and the final package of our projects.
We also studied the static code-analysis packages that are available for .NET Core development from Microsoft and from third-party community packages.
We were able to introduce the primary DevOps tools that we will be using throughout the book. We will focus on supporting GitHub, GitLab, and Azure DevOps as the primary tools of automation for .NET Core. You can follow along with the guides that we provide in the later chapters.