G. Reniers1,2,3, L. Talarico1, and N. Paltrinieri4,51University of Antwerp, Antwerp, Belgium2KU Leuven, Brussels, Belgium3Delft University of Technology, Delft, The Netherlands4Norwegian University of Science and Technology (NTNU), Trondheim, Norway5SINTEF Technology and Society, Trondheim, Norway
Abstract
In this chapter an innovative approach is described to evaluate investments in safety measures under an economics perspective. By accurate risk and safety assessment it is possible to assign costs and benefits to a safety measure. In this way, the foundation of robust and long-sighted risk and safety analysis can be built for operational safety within any organization. Decision-making might be significantly improved by prioritizing and refocusing on safety rather than on short-term organizational objectives. Cost-benefit analysis can be used to evaluate investment decisions by translating safety and risk concepts into monetary values integrating well-known indicators and measures from economic theory such as net present value, internal rate of return, and payback period.
At first look, it seems evident that consideration of both risk management and safety management is essential in any manager's decision. However, Perrow [1] indicates that there are indeed reasons why managers and decision-makers would not put safety first. A very important reason is that harm and consequences are not evenly distributed: The latency period may be longer than any one decision-maker's career. Few managers are punished for not putting safety first, even after an accident, but will quickly be punished for not putting profits, market share, or prestige first. In the long term, this approach would obviously not be the best management solution for an organization.
A central concept is that of cost. On the one hand, there are the costs of improving work conditions to reduce the incidence of injury and disease. On the other hand, there are the costs resulting from not doing these things. Therefore, a discussion of operational safety within an organization always involves a discussion of choices. One should realize that safety has not only costs but also benefits. Benefits are much harder to acknowledge by managers because they have a hypothetical and uncertain nature. At the end of a working day, employees from a company will not ask themselves, “How many times was I not injured at work today?”
Companies may face many risks but do not often possess adequate information for risk assessment. In particular, this chapter focuses on risks occurring when few or extremely few historical data are available. This kind of risk has the potential to result in catastrophes with major consequences and often with multiple fatalities, so-called low-probability, high-impact events. They do occur on a (semi)regular basis from a worldwide perspective, and large fires, large releases, explosions, toxic clouds, and so forth belong to this class of accidents. For this reason, the associated risk has to be reduced to the lowest practicable level, taking into account the costs and the benefits of such risk reduction. To this extent, different economic considerations should be made, and a specific economic analysis should be carried out.
2. The Foundations of Cost-Benefit Analysis
In this section a brief overview of the approach to economic evaluation of safety investment is provided. The approach is based on evaluation of costs, benefits of safety measures, and analysis of safety investment.
2.1. Cost-Benefit Analysis Approach
A cost-benefit analysis is an economic evaluation in which all costs and consequences of a certain decision are expressed in the same units, usually money [2,2a]. Such an analysis may be employed in relation to operational safety, to aid normative decisions about safety investments. One should keep in mind that it cannot be demonstrated whether one safety investment is intrinsically better than another. Nevertheless, a cost-benefit analysis allows decision-makers to improve their decisions by adding appropriate information on costs and benefits to certain investment decisions regarding prevention or mitigation. Because decisions about safety investments involve choices between different possible risk management options, cost-benefit analysis can be very useful. Moreover, decisions may not be straightforward in some cases, especially in the process industries, where there are important risks to be managed and controlled. However, it is worth mentioning that cost-benefit analysis is not a pure science and sometimes needs to employ debatable concepts such as the value of human life, the value of body parts, and the question of who pays the prevention costs and who receives the safety benefits.
Two types of cost-benefit analyses are available. First, there is the “ex ante cost-benefit analysis,” which is carried out before deciding about whether to invest. Second, the “ex post cost-benefit analysis” is conducted at the end of a project [3] to verify the profitability of the project. Although in this chapter we are mainly interested in ex ante cost-benefit analysis, in which safety managers complete an economic exercise to aid in the decision-making process with respect to safety investments, the technique described can also be used to carry out an ex post cost-benefit analysis. In any case, the result of any ex ante cost-benefit analysis, being a recommendation for an investment decision regarding prevention, is meant to merely assist the decision-maker in the decision process by making costs and benefits more transparent and more objective.
The decision-maker is recommended to use this approach with caution because the available information is subject to varying levels of quality, detail, variability, and uncertainty. Nevertheless, the tool is far from unusable and can provide meaningful information for aiding decision-making, especially if it takes the levels of variability and uncertainty into account and thus avoids misleading results.
Cost-benefit analysis is used to determine whether an investment represents an efficient use of resources. An investment project regarding prevention represents an allocation of means (money, time, etc.) in the present that will result in a particular stream of hypothetical benefits in the future. The role of cost-benefit analysis is to provide information to the decision-maker, in this case an employee or a manager who will appraise the safety investment project. The main purpose of the analysis is to obtain relevant information about the level and distribution of benefits and costs of the project. Through this information, an investment decision within the company can be guided and made in a more objective way. The analysis role is to support objective evaluation and not to adopt an advocacy position either in favor of or against the safety investment, because there are also many other aspects that should be taken into account when deciding about safety investments (eg, social acceptability and regulatory affairs).
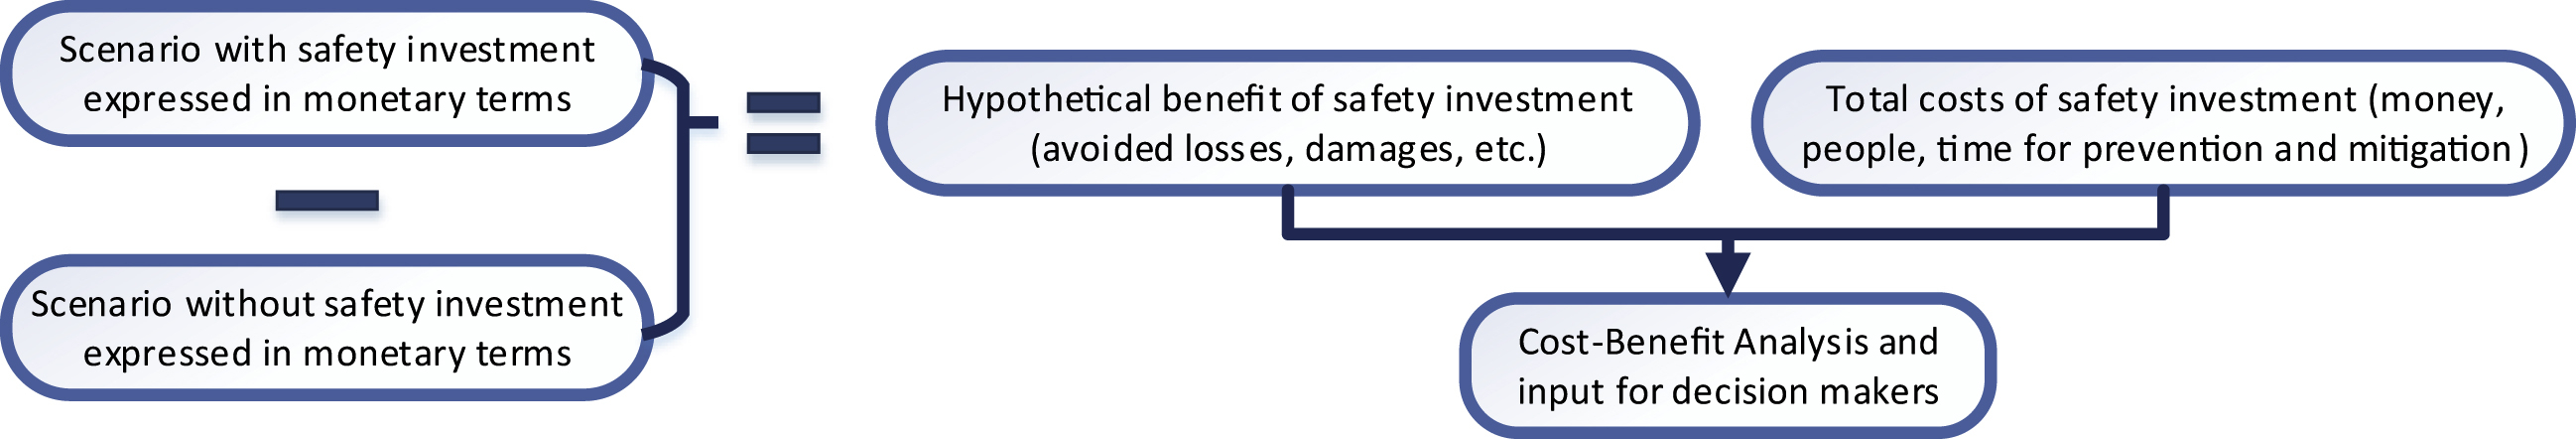
A safety investment project makes a difference, because the future will be different depending on whether the company decides to invest or not, or to invest in an alternative investment option. Thus, in the cost-benefit analysis, two scenarios are envisaged: without and with safety investment. During a cost-benefit analysis, a monetary value is assigned to the difference between the two scenarios. The process is shown in Fig. 16.1.
Because a safety investment project involves costs in the present and both costs and benefits in the future, at the beginning the net benefit stream will be negative; it will become positive at a certain point in time.
2.2. Present Value, Discount Rate, and Annuity
If a company uses a cost-benefit analysis, the recommendation whether to accept or to reject an investment project is based on the following process:
1. identification of costs and benefits
2. calculation of the present values of all costs and benefits
3. comparison of the total present value of costs and total present value of benefits
To compare the total costs and the total benefits (defined by costs and benefits occurring at different points in time), one needs to take a discount rate into account in the calculation to obtain the present values. Thus, during a cost-benefit analysis, all cash flows need to be converted to values in the present. This conversion is carried out by discounting the cash flows by a discount rate. The discount rate may be defined in a multiperiod model, where people value future experiences to a lesser degree than present ones because they are sure about present events and not sure about future events, which are subject to the environment. Thus, the higher the discount rate they choose, the lower the present values of the future cash flows [4].
Figure 16.1 Cost-benefit analysis approach for safety investments.
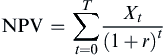
An investment project is recommended when the total net present value (NPV) of all cash flows is positive, and an investment project is usually rejected when the NPV is negative. To calculate the NPV related to project management, all cash flows are determined, and future cash flows are recalculated to today's value of money by discounting them by the discount rate. The formula usually mentioned to calculate the NPV is
NPV=∑Tt=0Xt(1+r)t
where Xt represents the cash flow in year t, T is the time period considered (usually expressed in years), and r is the discount rate.
Applied to operational safety, the NPV of a project expresses the difference between the total discounted present value of the benefits and the total discounted present value of the costs. A positive NPV for a given safety investment indicates that the project benefits are larger than its costs.
NPV=Presentvalue(benefits)–Presentvalue(costs).
If NPV≥0, recommend safety investment.
If NPV<0, recommend to reject safety investment.
It is evident that cash flows, that is, prevention costs and certainly hypothetical benefits, may be uncertain. Different approaches can be used in this regard. Cash flows can, for example, be expressed as expected values, taking the uncertainties in the form of probabilities into consideration and also increasing the discount rate to outweigh the possibilities for unfavorable outcomes.
There can be different categories of costs related to a safety investment, such as initial costs, installation costs, operating costs, maintenance costs, and inspection costs. These costs are evidently represented by negative cash flows. Some costs (eg, initial and installation costs) occur in the present and thus do not have to be discounted, whereas other costs (eg, operating, maintenance, and inspection costs) occur throughout the remaining lifetime of the facility and thus will have to be discounted to the present. There are also different categories of benefits (ie, avoided accident costs) linked to a safety investment, such as supply chain benefits, damage benefits, legal benefits, insurance benefits, human and environmental benefits, intervention benefits, reputation benefits, and other benefits. The benefits represent positive cash flows, which all occur throughout the remaining lifetime of the facility and thus will all have to be discounted to the present.
To clarify the discount rate principle, all cash flows (for both costs and benefits) are assumed to occur on an arbitrarily chosen date, which for example can be chosen to be the last day of the calendar year in which they occur. This assumption converts the continuous cash flows to a discrete range of cash flows, occurring at the end of each year. Then the cash flows at the end of each year have to be discounted to a present value, using a discount factor.
Suppose a safety investment project has a particular cost in year zero and then the same level of costs and benefits at the end of each and every subsequent year for the remaining lifetime of the facility. This means that:
Costi=C;Benefiti=B∀i∈T
This concept is called an annuity [4]. The total present value (TPV) of annuities is given by the following formula, with n the remaining lifetime of the facility
TPV=A[(1+r)n−1][r(1+r)n]=A1−(1+r)−nr
with A the yearly cost or benefit of a cost/benefit category, n the number of years in which the safety investment will be active, and r the discount rate. The term [(1+r)n−1][r(1+r)n](or1−(1+r)−nr) is called the annuity (discount) factor [4].
Using this model, the benefits and costs in the future are assumed to be constant, and inflation is not included in the future costs and benefits, as already mentioned. Inflation is the process that results in a rise of the nominal prices of goods and services over time. Therefore in this (simplified) model, the real rate of interest1 should be used as the discount rate instead of the money rate of interest. Because the money rate of interest m includes two components, the real rate of interest r and the anticipated rate of inflation i (m=r+i), the anticipated rate of inflation is built into the money rate of interest. Inflation is not included in the numerator of the formula for calculating the present value of annuities (because the costs and benefits are constant throughout the remaining lifetime), but it can be added.
2.3. Investment Analysis
Investment analysis allows calculating the internal rate of return (IRR) and the payback period (PBP), which are important determinants of whether to undertake a safety project and invest in safety measures.
2.3.1. Internal Rate of Return
IRR can be defined as the discount rate at which the present value of all future cash flows (or monetized expected hypothetical benefits) is equal to the initial investment, that is, the rate at which an investment breaks even. It can be used to measure and compare the profitability of investments. Generally speaking, the higher an investment's IRR, the more desirable it is to carry on with the investment. As such, the IRR can be used to rank several possible investment options that an organization is considering. Assuming all other factors are equal among the various investments, the safety investment with the highest IRR would be recommended to have priority. IRR is sometimes referred to as economic rate of return.
An organization should, in theory, undertake all safety investments available with IRRs that exceed a minimum acceptable rate of return predetermined by the company. Investments may of course be limited by availability of funds to the company. Because the IRR return is a rate quantity, it is an indicator of the efficiency, quality, or yield of an investment. This is in contrast with the NPV, which is an indicator of the value or magnitude of an investment.
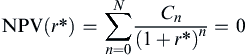
The IRR r∗ is a rate of return for which the NPV is zero. This can be expressed as follows:
NPV(r∗)=∑Nn=0Cn(1+r∗)n=0
In cases when a first safety investment displays a lower IRR but a higher NPV over a second safety investment, the first investment should be accepted over the second one. Furthermore, the IRR should not be used to compare investments of different duration. For example, a NPV of an investment with longer duration but lower IRR could be higher than a NPV of a similar investment (in terms of total net cash flows) with shorter duration and higher IRR.
2.3.2. Payback Period
PBP is defined by calculating the time needed (usually expressed in years) to recover an investment. Thus, a break-even point of investment is determined. The PBP of a certain safety investment is a possible determinant of whether to proceed with the safety project, because longer PBPs are typically not desirable for some companies. It should be noted that PBP ignores any benefits that occur after the determined time period and does not measure profitability. Moreover, neither time value of money nor opportunity costs are taken into account in the concept. PBP may be calculated as the cost of safety investment divided by the annual benefit inflows.
It is worth noting that PBP calculation uses cash flows, not the net income. PBP simply computes how fast a company will recover its cash investment.
3. Prevention Costs
The purpose of implementing operational safety measures is to reduce present and future operational risks. Reducing risk implies both prevention of accidents and mitigation of potential consequences.
3.1. Safety Measures
There are four different classifications in which safety measures can be divided. First, risk reduction measures can be classified into protection and prevention measures, depending on their characteristics. Protection measures (including mitigation measures) lower the consequences, whereas prevention measures decrease the probability of an accident [5]. Second, safety measures can also be classified in active or passive systems according to their needs to be able to perform their function. Third, a classification can be made by their impact on severity and probability of occurrence, because from the many safety measures only some of them will, for example, play a role in the prevention of catastrophic or disastrous events. There may be a need to focus the efforts and to identify priority safety elements. Therefore, the third classification of safety measures is safety measures and safety-critical measures. Fourth, safety measures can be looked at from three dimensions: people, procedures, and technology. The interplay between people, procedures, and technology safety measures defines the observable part of the safety culture in an organization [6].
3.2. Categories of Safety Measure Costs
To be able to implement new safety measures and upgrade existing safety systems, a company has to reserve substantial funding. The various categories of possible costs related to new safety measures that a company has to take into account are are shown in Table 16.1. This table provides a clear overview of the different kinds of costs that may be applicable for safety.
4. Hypothetical Benefits: Categories of Avoided Accident Costs
Table 16.2 illustrates the avoided costs, also known as hypothetical benefits. These costs are grouped into eight categories depending on the type of benefits. Because the consequences of an accident only become reality when the accident actually occurs, the frequency of occurrence should be taken into account in the calculation of the expected events. Therefore, consequences, calculated by either the appropriate formula or a flat-rate amount, should be multiplied by the frequency of occurrence to obtain the “yearly” expected consequences resulting from an accident. Thus, if we consider that the different kinds of hypothetical consequences are to be spread out on a yearly basis and that the yearly cost resulting from these consequences is always the same, Ci=C, ∀ i, the total present value of all hypothetical consequence costs during the remaining lifetime of the facility can be calculated by taking into account both the remaining lifetime and a discount factor.
This calculation should be executed for both cases with and cases without the implementation of the safety measures. The difference between the two present values of consequence costs represents the (hypothetical) benefit resulting from the implementation of the new safety measures.
Table 16.1
Cost Categories of Safety Measures
Categories of Costs
Subcategories of Costs
Initial costs
Investigation
Selection and design
Material
Training
Changing guidelines and informing team
Installation costs
Production loss
Start-up
Equipment
Installation
Operating costs
Utilities
Maintenance costs
Material
Maintenance team
Production loss
Start-up
Inspection costs
Inspection team
Logistics and transport safety costs
Transport of hazmat
Storage of hazmat
Drafting of control lists
Safety documents
Contractor safety costs
Team selection
Training
Other safety costs
Other safety costs
Benefits=Total present value of expected consequence costs (without safety investment)−Total present value of expected consequence costs (with safety investment)
5. Cost-Benefit Analysis
The following equation may be used to determine whether the costs of a safety measure outweigh its benefits [3]:
with Cwithout=cost of accident without safety measure, Cwith=cost of accident with safety measure, Fwithout=statistical frequency of initiating event if the safety measure is not implemented, Fwith=statistical frequency of initiating event if the safety measure is implemented, Faccident=statistical frequency of the accident, and Prcontrol=probability that the safety measure will perform as required.
Table 16.2
Categories of Avoided Costs
Type of Benefits
Subcategory
Supply chain
Production loss
Start-up
Schedule
Damage
Damage to own material/property
Damage to other companies' material/property
Damage to surrounding living areas
Damage to public material property
Legal
Fines
Interim lawyers
Specialized lawyers
Internal research team
Experts at hearings
Legislation
Permits and licenses
Insurance
Insurance premiums
Human and environmental
Compensation victims
Injured employees
Recruiting
Environmental damage
Intervention
Intervention
Reputation
Share price
Other
Manager working time
Cleaning
Accidents may be related to extremely low frequencies and a high level of uncertainty. In this case, these formulas cannot be applied because rough estimations would seriously compromise their reliability. To take this into account, cost-benefit analysis preferably involves a so-called disproportion factor to reflect an intended bias in favor of safety over costs. This safety mechanism is extremely important in the calculation to determine the adequate level of investment in prevention measures; on the one hand, the probability influences the hypothetical benefits substantially through the number of years over which the total accident costs can be spread out, and on the other hand, the uncertainty regarding the consequences is high [7].
Usually cost-benefit analyses state that the investment is not encouraged if the costs are higher than the benefits. However, if a disproportion factor is included, an investment in safety is reasonably practicable unless its costs are grossly disproportionate to the benefits. If the following equation is true, then the safety measure under consideration is not reasonably practicable because the costs of the safety measure are disproportionate to its benefits [8].
To give an idea about the size of the disproportion factor, some guidelines and rules of thumb are available. They state that disproportion factors are rarely greater than 10, and that the higher the risk, the higher the disproportion factor should be to stress the magnitude of those risks in the cost-benefit analysis. This means that in cases when the risk is very high, it might be acceptable to use a disproportion factor greater than 10 [7]. Although a value greater than 10 is allowed, Rushton strongly advises not to use a disproportion factor greater than 30 [9].
6. Conclusions
In this chapter some concepts and methods borrowed from economic theory are used to assess and analyze investments in security. In common organizational practices, owing to the difficulties in quantifying the savings or benefits resulting from investments in security, the managerial focus is mainly on short-term objectives, postponing or delaying safety investment decisions. Moreover, the lack of appropriate methodologies to evaluate the economic impact of operational safety might be misleading, resulting in erroneous management solutions for an organization in the mid to long term.
Based on the information available in a company after an accurate risk assessment, cost-benefit analysis can be used to evaluate a safety measure and/or compare different safety alternative investments. A disproportion factor may be used in the case of high uncertainties in dealing with high-consequence, low-probability scenarios.
A cost-benefit analysis applied to safety measures can be used by decision-makers and/or analysts to provide recommendations for investments in prevention and make the evaluation phase more transparent and straightforward based on quantitative and homogeneous measures.
The concept of NPV and IRR can be used based on the expected yearly cash flow that an investment in safety generates. These concepts can potentially avoid myopic operational safety focused on the short term. Moreover, a disproportion factor is used to increase the risk awareness of the decision-maker and make the benefits comparable with the costs.
To conclude, operational safety can be reprioritized by using cost-benefit analysis described in this chapter, rebalancing the weight that managers give to production over safety and allowing decision-makers to take better management solutions by considering a broader investment horizon. Moreover, safety investments can be easily justified and evaluated using quantitative approaches.