
3.2. Cycle-based, Round-robin
To support continuous display of an object X, it is partitioned into n equisized blocks: Xo, X1, …, Xn–1, where n is a function of the block size (B) and the size of X. A time period (Tp) is defined as the time required to display a block:
Equation 3.1
![]()
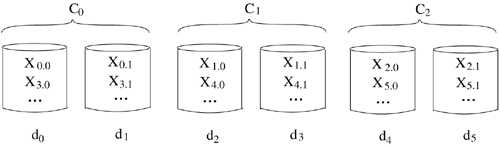
With a multi-disk platform consisting of d disks, the workload of a display should be evenly distributed across the d disks in order to avoid the formation of bottlenecks. Striping [12], [67], [175] is a technique to accomplish this objective. This technique partitions the d disks into C clusters of disks with each cluster consisting of d disks: ![]() . Next, it assigns the blocks of object X to the clusters in a round-robin manner. The first block of X is assigned to an arbitrarily chosen disk cluster. Let A(j, Oi) be the location of the jth block of object Oi.
. Next, it assigns the blocks of object X to the clusters in a round-robin manner. The first block of X is assigned to an arbitrarily chosen disk cluster. Let A(j, Oi) be the location of the jth block of object Oi.
Equation 3.2
![]()
where rand() generates a random number that is uniformly distributed between 0 and 1. For example, in Figure 3.1, a system consisting of six disks is partitioned into three clusters, each consisting of two disk drives. The assignment of the blocks of X starts with cluster 0. This block is declustered [72] into two fragments: X0.0 and X0.l.
Figure 3.1. Round-robin Data Placement.
When a request references object X, the system stages X0 from cluster C0 in memory and initiates its display. Prior to completion of a time period, it initiates the retrieval of Xl from cluster Cl into memory in order to ensure a continuous display. This process is repeated until all blocks of an object have been displayed. To support simultaneous display of several objects (RC < RD), a time period is partitioned into fix-sized slots, with each slot corresponding to the retrieval time of a block from a cluster. The number of slots (N) in a time period defines the maximum number of simultaneous displays supported by a cluster. With C clusters, because a cluster supports N simultaneous displays in a time period and the system accesses C clusters concurrently in the same time period, the system maintains N × C time slots in a time period. (It is trivial to compute N, B, and Tp, see [64] for details.) We conceptualize a set of slots supported by a cluster in a time period as a group. Each group has a unique identifier. To support a continuous display in a multi-cluster system, a request maps onto one group and the individual groups visit the clusters in a round-robin manner (Figure 3.2). If group G5 accesses cluster C2 during a time period, G5 would access C3 during the next time period. During a given time period, the requests occupying the slots of a group retrieve blocks that reside in the cluster that is being visited by that group.
Figure 3.2. Rotating groups.

Assuming a first-come-first-served policy, upon the arrival of a request, the system assigns it to a group that services this request until the end of its display.[2] With a request referencing object X, the system first determines the group (say Gx) which is currently accessing the cluster where the first block of X resides. If Gx has an available time slot, the system assigns this request to Gx to initiate the retrieval on behalf of this request. Otherwise, a failure has occurred and the system checks whether the next coming group has an empty time slot. This is repeated until the system finds an available group. Due to the rotation of groups, there is a fair chance for a request to be assigned to a specific group (regardless of the location of the first block of each object and their access frequency).
[2] With the request migration scheme of Section 3.4.1, a request can be migrated to another group during its display.
Therefore, if there are C clusters (or groups) in the system and each cluster (or group) can support N simultaneous displays then the maximum throughput of the system is m = N × C simultaneous displays. The maximum startup latency is Tp × C because: 1) groups are rotating (i.e., playing musical chairs) with the C clusters using each for a Tp interval of time, and 2) at most C – 1 failures might occur before a request can be activated (when the number of active displays is fewer than N × C). Thus, both the system throughput and the maximum startup latency scale linearly. Note that system parameters such as blocks size, time period, throughput, etc., for a cluster can be computed using display techniques such as REBECA [64] and GSS [182]. These display techniques are local optimizations that are orthogonal to the optimization techniques proposed by this study.
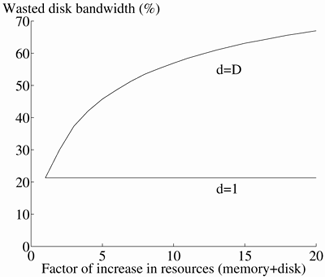
Given a system with a fixed amount of resources (disk and memory), the number of disks that constitute a cluster have a significant impact on the overall performance of a system. To illustrate, assume a system that consists of 20 disks with 320 megabyte of memory. The impact of the number of disks per cluster on the system performance is best explained by considering the extreme choice of values for d, i.e., d = 1 and d = D. For each, we describe the scalability characteristics of the system as a function of additional resources (disk drive and memory) in a system. We assume a system consisting of one disk and 16 megabytes of memory as our base and focus on a media type with a bandwidth requirement of 4 Mb/s because the trends are identical for the other media types. The amount of memory (i.e., 16 megabytes) was chosen such that 20% of the disk bandwidth is wasted when the system is configured to maximize the number of displays (with RC = 4 Mb/s). Next, we quantify the maximum throughput and latency time of the system with each technique when both the number of disk drives and the amount of memory increases by a factor of i, 1 ≤ i ≤ 20. For example, when i = 4, the system consists of four disks and 64 megabyte of memory.
3.2.1. d = 1
When d = 1, the blocks of an object X are assigned to the D disk drives in a round-robin manner. The assignment of X0 starts with an arbitrary disk. Assuming a system with three disk drives, Figure 3.3a demonstrates the assignment of blocks of X with this choice of value. The definition of a time period and its derivation are identical to Equation 3.1. The total number of simultaneous displays supported by the system is: N × D. Hence, throughput of the system (i.e., maximum number of displays) scales linearly as a function of additional resources in the system. However, its maximum latency also scales linearly (see Figure 3.5). To demonstrate this, assume that each disk in Figure 3.3a can support three simultaneous displays. Assume that eight displays are active and that the assignment of object X starts with d0 (X0 resides on d0). If the request referencing object X arrives too late to utilize the idle slot of d0, it must wait three (i.e., D) time periods before the idle slot on d0 becomes available again (see Figure 3.4). Hence, the maximum latency time is Tp × d.


Figure 3.5. d=1 vs. d=D (RC = 4 Mb/s).
a. Throughput.

b. Maximum latency time.

c. Wasted disk bandwidth.

The effective disk bandwidth of the system is a function of B, TW_Seek, and D. It is defined as:
Equation 3.3
![]()
The percentage of wasted disk bandwidth is quantified as:
Equation 3.4
![]()
Thus, the wasted disk bandwidth is a constant as a function of additional resources, see Figure 3.5. This explains why the throughput of the system scales linearly.
3.2.2. d = D
When d = D, each display utilizes the total bandwidth of d disks. Logically, d disk drives are conceptualized as a single disk. Each block of an object is dispersed across the d disk drives. For example, in Figure 3.3b, block X0 is declustered across the 3 disks. Each fragment of this block is denoted as X0,i, 0 ≤ i < D. This approach enables the system to display an object using the design of Section 2.3. The only difference is that d disks are activated during each time slot (instead of one disk). The derivation of a time period, the maximum latency and required amount of memory are identical to those of Section 2.3. The effective bandwidth of the disks in the system is defined as:
Equation 3.5
![]()
The amount of wasted disk bandwidth is computed using Equation 3.4. (This equation is not equivalent to Equation 3.3 because d × RD appears in the denominator of Equation 3.5.)
As compared to d = 1, the system wastes the bandwidth of the disk drives as a function of additional resources, see Figure 3.5. This is because the amount of data transferred per disk drive decreases as a function of additional disks. The amount of memory needed to render the percentage of wasted disk bandwidth a constant far exceeds that of a linear growth. This causes a sub-linear increase in throughput, see Figure 3.5. By supporting fewer users, the duration of a time period remains relatively unchanged, enabling the system to provide a lower latency time. This demonstrates the tradeoff between throughput and latency time of a system. It is important to note that if enough memory was provided to enable the number of users to scale linearly as a function of additional disk drives, its maximum latency would have been identical to that of d = 1.
3.2.3. Expected Startup Latency
It might be pessimistic to consider the maximum latency as the latency that a request experiences before being serviced. This section quantifies the characteristics of latency and develops a probabilistic approach to determine the expected startup latency of a request.
In traditional file servers, a multi-disk platform cannot be modelled as a multi-server queuing system because not all servers are identical: upon the arrival of a request, it should be assigned to the disk that contains the required data (and not an arbitrarily chosen disk). However, due to a random distribution of the first blocks of objects across disks and a round-robin access pattern, a request can be assigned to a time slot of any group in our approach. Assuming d=l, we can conceptualize our striping system as a queuing system with m (m = dN) identical servers where a server corresponds to a time slot (and not a disk). Hence, we can compute the probability, p(k), that there are k busy servers in the system at a given point in time by applying a queuing model. For example, with a Poisson arrival pattern and an exponential service time, the probability of k busy servers in an m server loss system is [99]:
Equation 3.6
![]()
where λ and μ are the arrival rate of requests and the service rate of the server (1/average service time) respectively. Note that Eq. 3.6 could be different for a different queueing model and our approach is independent to it.
When a request for an object X arrives at time t, the system determines the disk that contains the first block of X (say A(0, X)) and the group (say Gt) currently accessing this disk (dA(0,X)). If Gt has at least one available slot and there remains enough time to retrieve a block till the end of the time period, the request is assigned to a slot in Gt and its retrieval is initiated. If the time slots of Gt are exhausted (occupied by other requests), the request cannot be served by this group (failure). Next, the system checks the availability of slots in G(t+1) mod d. (Note that in contrast to how the disks are numbered, the numbering of the groups is descending, see Figure 3.2.) If the time slots of this group are also fully exhausted, the system checks the next group, G(t+2) mod d. This procedure is repeated until a group with an idle slot is found (success). Hence, a request might have several failures before being assigned to a specific group in the system, assuming the first-come-first-serve policy for activating requests. This may result in a longer startup latency for some requests because several time periods might pass before the assigned group reaches the disk where X0 resides. Traditionally, double buffering has been widely used to absorb the variance of block retrieval time [182], [67], [175]. The idea is as follows: while a buffer is being consumed from memory, the system fills up another buffer with data. The system can initiate display after the first buffer is filled and when the next time period begins, i.e., the next block is requested. Assuming a request is issued every time period (as in most round-based techniques [64], [183], [70], [126]), the startup latency is defined as:
Equation 3.7
![]()
where i is the number of failures that a request experiences before a success.
Let pf(i, k) be the probability that a request has i failures before a success when there are k busy servers in the system. For a given k, the probability that a request experiences i failures before a success is:
Equation 3.8

where 0 ≤ k < m and ![]() .
.
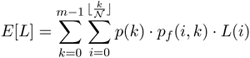
Let a random variable L define the latency for a request with i failures. The probability that a request has a latency of L is the summation of the probability of i failures conditioned by all k values. Hence, the expected latency is:
Equation 3.9
Note that L(i) could be different from Eq. 3.7 when one adopts different buffering and scheduling schemes. That is independent to this equation.