
by Shel Waggener and Steve Zoppi
Underscored by the common adage “If you can't measure it, you can't manage it,” the importance of the three Ms (metrics, monitoring, and measuring) is greater today than ever. Management by gut feeling may still be as prominent as management by exception or management by objective, but the dynamics and complexities of today's fast-paced global environment present a special set of circumstances—circumstances that do not always lend themselves to traditional method.
The days of managing by gut feeling are not completely gone, but today this approach must be supplemented by other methods and real, quantifiable measurements. No CIO will last long if he or she can't quantify what is happening. With greater emphasis on accountability and performance, the three Ms can't be ignored.
In this chapter Shel Waggener and Steve Zoppi outline the history of IT metrics and establish a pattern for the appropriate application of metrics as they might be seen from various constituencies and business partners. They explore:
• A disciplined and managed approach to metrics.
• How to identify appropriate metrics.
• The importance of focusing metrics on business value.
• Development tools and techniques for creating actionable metrics.
• The art of metrics management to improve the business.
After more than 20 years in this industry, I find myself in the (more or less) enjoyable position of watching history repeat itself. I also find myself reflecting on the wisdom of George Santayana: “Those who cannot remember the past are condemned to repeat it.”[1] We all use the expression “hindsight is 20/20,” but I am confounded as to why we have made so little progress as an industry in learning from crossdiscipline successes and failures.
[1] The Columbia Dictionary of Quotations is licensed from Columbia University Press. Copyright © 1993, 1995, 1997, 1998 by Columbia University Press. All rights reserved.
I've been CIO in both hardware and software companies. I've seen phenomenal strides and innovation. I marvel at the ingenuity of the human mind in creating complex and intricate products and conceiving of innovation. But the one feature of the technology industry that never ceases to perplex me is how the success-based disciplines of monitor, measure, and manage, so pervasive in hardware-oriented environments, continue to be scarce as hen's teeth in the sister industry of software.
The evolution of hardware standards has been dutifully tended by industry bodies around the globe, with rigorous requirements for interfacing, fabrication, maintenance, and diagnostics. No such standards have evolved in software—at least, no standards with the intent of seamless integration into a greater whole. Software standards, though gradually (read: glacially) improving, have been largely established and imposed to limit competition—and to make the life of a CIO about as simple as establishing the origins of the universe.
I've worked with hundreds of CIOs and senior managers of technology disciplines throughout my career, and the most expert and successful of those managers have abandoned the hope that unified metrics, monitoring, and measurement will ever come to software, so they divide their focus as follows: Twenty percent effort on hardware monitoring will bring 80 percent of the benefit, while the other 80 percent of their monitoring and measuring efforts is focused on software and people.
Those of us who have followed technology from the early days of paper tape and front-panel data entry have grown weary of hearing from those of us who have followed technology from the early days of paper tape and front-panel data entry. The old war stories of core-memory failures, faulty wire-boards, and soaked punch cards are, for all of today's intents and purposes, irrelevant. The intrinsic complexities of application and service delivery in today's highly heterogeneous, geographically diverse, multitier environments make monitoring and management significantly more difficult.
Despite the change in our war stories' contents, we have learned from our mistakes. The adage “If you can't measure it, you can't manage it,” regarded by some as a cliché, has greater significance today than it ever did. The days of managing by “gut” are not completely gone, but the complexities inherent to today's global business scenarios present circumstances that demand measurement because the answers to our most nagging questions are often counterintuitive to our previous experience.
As was the case with our discussions on marketing IT in the previous chapter, this chapter is a sourcebook of ideas from which you must draw your own plans. Measurement and metrics are cornerstones in producing the raw material for any worthwhile IT marketing plan. Therefore, the same rule applies: There are no silver bullets. This chapter outlines the history of metrics in IT and establishes a pattern for the appropriate application of metrics as they might be seen by various constituencies and business partners.
The role of the CIO is frequently determined by a number of external factors. Executive reporting structures often dictate management styles and strategies for a CIO. For example, during the 1980s and much of the 1990s, with the majority of IT organizations reporting to the CFO, there was a decided shift toward management by number. While emphasizing IT as a bottom-line expense, this also encouraged a metrics-driven decision process. This approach was tailored to communications with CFOs—success or failure based on numbers. Although communication with the CFO was possibly enhanced, management by numbers also fostered the perception of IT as a bottom-line expense, with little focus on the values IT brings to a business.
Successful CIOs quickly adapted to this challenge by developing the nearly automatic response of inundating the CFO with numbers and metrics to justify anything we needed. Soon, every request for budget was accompanied by one of the now ubiquitous three-letter acronym justifications—ROI (return on investment), SLO (service-level objective), SLA (service-level agreement), TCO (total cost of ownership), TQM (total quality management)—as well the all-important external certification and external sources (ISO9000, TK/IT, Gartner Group, Forrester Group, META Group, Giga Information Group) or any other credible source that would validate or certify the intended position or approach.
About the time this “Data War” reached détente, IT spending began its meteoric rise, doubling and in some cases tripling with the urgency of Y2K remediation and the boom in Internet-related costs. With newfound spending power and responsibilities crossing lines of business, many CIOs found themselves promoted—this time reporting directly to CEOs.
Suddenly, a whole new set of success criteria appeared. Now, instead of SLA and MTR (mean time to recovery) information touting IT's effectiveness and operational excellence, CIOs were required to provide data about every aspect of the business. Showing business success or failure was now dependent on the information IT provided regarding subjects as varied as the new supply-chain management cycle times, CRM customer tracking sell-through data, and unique Web site page views per month.
Most CIOs were barely catching up to the extreme requirements and fast pace when the economy slowed down dramatically and the rules governing metrics changed again. IT was once again relegated to being a bottom-line expense, with cost per employee and IT as a percentage of revenue surfacing as the “most important” metrics. And, by the way, none of the new metric requirements had been relaxed; their relative priorities have simply been rearranged.
Through these cycles, one constant has been an ever-increasing torrent of data: massive quantities of data and information to accumulate, store, sort, analyze, report against, and act upon. The noise-to-signal ratio of data-to-information will continue to be unwieldy until the CIO adopts a new strategy for metric management.
So what's a CIO to do? What should be measured by an IT organization, and what should be reported against? How can a CIO avoid drowning in too much data and creating a bureaucracy that does little more than compile numbers? Some have opted to abandon massive metrics entirely, yet the best-managed and most successful companies have been shown to share a few common attributes. One of the most applicable for this discussion is the establishment of a disciplined approach to managing business through appropriate measurement. For the CIO, a keen understanding of how to develop tools and techniques that convert these data into business-critical information, including actionable metrics, is tantamount to success.
In this chapter we discuss the art of metrics management that, once mastered, will help zero in on improvement in those areas that are the true indicators of business success while combing out the noise of extraneous data. In each section, there are specific examples of winning strategies and sample metrics as well as some examples of not so successful metrics and common traps to avoid.
It's the end of the year and time for the annual review. Has it been a good year? How company leaders answer that question varies wildly from company to company and position to position. For the CIO, it is critical to have a clear idea of what success means and, moreover, what it means to each peer executive—specifically to the CEO. Many CIOs have fallen prey to successfully delivering projects and operational gains throughout the year only to find their ideas of success and criticality to the lines of business don't match those of the CEO.
In years past, the classic five-year strategic plan was belabored for months and implemented over years. Executives had the luxury of performing revisions and course corrections throughout the process. This was a world in which business opportunities materialized slowly, and data analysis could take place retroactively each quarter or year to determine what changes to make—and this system worked very well. Today's business climate, however, is led by companies characterized by the ability to acquire data and analyze information in real time with changes in the business. Course corrections are no longer an annual event but, for most well-operated companies, have become a weekly, daily, even hourly (near real-time) adaptation to changing market conditions. It is the era of the “sense and respond” organization.
To accomplish this extreme level of near real-time management, the information pipeline and cycle times need to be substantially shortened. The adage “If you can't measure it, you can't manage it” continues to provide the starting point. In concept, measuring work is a simple task. In application, the expanded evaluation of all technology, business metrics, and pulse points within a business, division, or indeed the entire business, is considerably complex, and the notion of near real-time reporting may not be feasible or practical. Compiled data will be the primary information source guiding the concerted decisions of the CIO and the CEO, and will likely determine the success or failure of your business. While the business sections of bookstores are stocked full of titles purporting to provide the magic formula for measuring the health of a business, few are tailored to the health of the IT organization and fewer still can provide the formula that accurately describes the health of your corporation.
In reality, a strong leadership team runs the business correctly by differentiating it from others and won't approximate a carbon copy of competitors. So in order to run a world-class IT shop (one whose specific solutions truly enable the business's success), CIOs must focus on measuring and managing only those things that achieve this goal. It is a tall order, but one that can be accomplished through appropriately applied IT metrics and management—a methodology providing not just a simple list of the “perfect IT metrics,” but rather an approach that can be used to develop a winning metrics management strategy, customized to your specific business.
Successful IT professionals, when faced with challenges throughout their careers, have achieved that success by taking a measured approach to problem solving. Those problem-solving skills, as applied by line management or some director-level team members, were founded on a more directed and general three-step process for problem resolution.
- Step one: When presented with a series of difficult challenges, evaluate the size and scope of the problem.
- Step two: Develop an action plan designed to solve the specific problem or, optimally, the root cause of the issue at hand.
- Step three: Evaluate the success or effectiveness of the actionable solution.
These steps are adequate and manageable for solving problems faced by first- or second- and even third-level management as long as the final evaluations of effectiveness (step three) are completed. This approach also has favor because it tends to correctly identify the source of the problem—likely by establishing correct measurement or series of measurements to pinpoint the root cause.
The greatest challenge for any business unit owner (CIO included) is in identifying precisely what measurement will correctly highlight the root causes of a proposed issue or problem. Business owners, even those owners of operating elements within IT, have great diversity of issues, which makes establishing a common system of measurement seem rather futile.
Equally difficult questions to be pondered include the following:
• Should application development groups be measured by lines of code implemented? Applications deployed?
• Should systems administrators be measured by the number of servers administered?
• Should help desks or support centers be measured by the number of calls or cases closed?
While each metric is necessary to those organizations, do these numbers give keen insight into whether they are being run effectively? Do these numbers provide some insight into the operational performance of that particular team? Moreover, they are unlikely to answer the key (and often rhetorical) question: How do these measurements help drive my businesses success?
All data sought must bring focus to the key issues. Now for the difficult task of finding that data.
For many organizations, a substantial amount of previously absent data is made available once ISO certification, Baldridge quality, or other TQM systems are implemented. These certifications, processes, and business process reengineering requirements can sometimes be beyond the fiscal capabilities of many companies. The principles underlying the foundations of these specific certifications, however, are well worth adopting as a foundation for successful metrics and management. While the work involved is substantial, the ability to dramatically improve quality can be achieved by understanding—through appropriate measurement—where operational or methodological problems may exist and establishing a vehicle for correcting those problems.
The beneficial byproduct of these efforts is the creation of test points that the business will use to measure performance against significant criteria and identify key business opportunities. Quality and ISO programs can then become the cornerstone of a business owner's objective measurements for operational efficiencies. The most important result of these varied initiatives is that the lines of business (LOBs) develop measures that are specifically designed for their success.
Once in place, these documented processes and measures can lead to dramatic improvements in quality and productivity throughout the business. Requirements for applications from the business have a newfound focus, with requests for technical solutions including all supporting data and specifics. Unfortunately, this new ability to measure every aspect of business operations brings with it a new peril: a myopic focus on minute operation detail. Now, rather than having a few isolated areas clarified by hard data, a “manage everything by the numbers” cult can sweep the business. Suddenly, every presentation is awash in bar graphs, charts, and raw data galore.
Every process can now be measured, and you will be faced with more data than is easily deciphered. As trends begin to show, your business partners will request even more data to analyze, looking for opportunities for cost savings or quality improvements.
So how does one avoid being in the CEO's office at the end of year, only to suffer the fate of many tactically successful but strategically misaligned CIOs? The key is in understanding how to use operational data as a tool rather than an end result. Moreover, using the right data, and in sparing amounts, to derive the desired business indicator is the ultimate goal. Too much of a numerical diet can burden the organization, because the metric must be able to change with the business. If a metric is highly dependent on a complex series of other data points (long-term business initiatives like large system development, CRM, ERP, and so on), and the data path is broken by significant changes in business (the abandonment of any portion of these initiatives), the metric is no longer valid.
Additionally, if a company embarks on a long-term project that is capitalized, the budgetary equation for operation must change accordingly. Extraordinary expenses in the form of capital projects tend to wreak the greatest havoc on year-over-year planning efforts, because the expense rate may be minimized but capitalized projects now fall into the nondiscretionary bucket (along with licenses, maintenance, and so on). We will illustrate this a bit more later on.
Good metrics should be used to guide the development of strategic objectives, narrow investment opportunities to minimize wasted capital, and continually evaluate status to ensure that progress is being made. During cost reduction periods, the typical CFO uses the poorly qualified but always handy “percentage of revenue” as the key financial performance metric. Inevitably, CxO colleagues have heard from peers (or worse, read in an article in an in-flight magazine) that IT should be spending only X percentage of revenue, where X is generally a very low number. While that percentage has the benefit of being simple enough to easily measure, as mentioned previously, it is a completely inappropriate metric for necessary IT spending and usually results in the goal not being achieved. This particular measure also has the undesirable side effect of making it nearly impossible to tie the IT individual contributor's operational objectives to a meaningful performance number.
In using this metric at face value, there are only two possible results: You failed to meet the objective, or you met or exceeded it. Unfortunately, helping your team make the right decisions to achieve that target is much more complex than the binary outcome. If your team is struggling to meet all the operational objectives laid out by ISO and TQM initiatives, how can you help them relate to a generic percentage of revenue number?
Start by customizing the number to your particular business's operational and strategic needs. Instead of just creating a budget for the IT staff to live with, express the spending in terms of need and impact on the business. For example, identify what percentage of the budget is necessary for operational and fixed expenditures:
• Operational and fixed spending: X percent of budget
• Strategic investment/projects: 100 percent – X percent of budget
For operational groups, tie several key operational metrics not to performance but to dollar impact. Instead of listing “number of help desk cases,” measure in terms of revenue. For example,
• Total budget = $10M or 5 percent of revenue
• Operational budget = $8M or 4 percent of revenue
• Help desk = $600,000 or .3 percent of revenue
40,000 cases annually
Percent of revenue per 10,000 cases = .075
A target can then be set for the end-user support organization of reducing the cost per 10,000 cases from .075 percent of revenue to .070 or .065 percent of revenue. While the percentages may be small, the numbers are simple to calculate and can be tied directly to operational measurements for each group throughout your organization. Rather than a high-level generic measure, you now have individual measurements that are meaningful to each operational manager.
For your strategic projects, you can break down spending by investment in each product area and by each project. Instead of telling your services team that the CRM project budget is $900,000, you can show it this way:
• Total budget = $10M or 5 percent of revenue
• Total strategic investment = $2M or 1 percent of revenue
• CRM Project = $950,000 or .475 percent of revenue
At this point, you have something far more productive to talk over with the CEO. Instead of discussing the generic industry-standard target of spending as a percentage of revenue, you can not only demonstrate your ability to achieve expense targets but show where you missed, met, or exceeded them.
Simply stated, manually compiled metrics generate more work than solutions. With mountains of data to sort into customized metrics, the task can quickly become overwhelming. And the metrics requirements are not just for the IT shop itself; it is not uncommon for IT in smaller companies to also serve as the single source of data reporting for groups throughout the company. The tendency, historically, has been to assign the preparation of metrics reports to administration or other support staff, but with change requests and constant adjustments to business priorities, the workload will most certainly require additional people.
Today's levels of technological sophistication and industrial maturity provide ample facilities to automate the collection of nearly any performance metric imaginable. Depending on the specific business indicator, there may be opportunities to empower the lines of business to harvest and interpret their own metrics. These are generally enabled through the prudent use of the data warehouse or other vehicles for information delivery and analysis.
One of the most commonly overlooked tools in the IT arsenal is the “digital dashboard,” a highly versatile and effective means of communicating performance to all portions of the business. Previously, the dashboard concept mandated the assembly of an application development team. Today, with the ubiquity of the Internet and robust Web application tools (for end users and software engineers alike), there is no longer a need to form such a SWAT team, as there is a plethora of commercially available portal-class software products providing sufficient functionality to satisfy this purpose.
Humans tend to optimize their behavior in the direction of the favorable performance metric being sought. Due to this behavioral trait, any solitary metric is generally insufficient and can potentially minimize or even violate the overall spirit of the metric. Therefore, it is imperative that overall performance of any organization be well calibrated by measuring the same data from different vantage points. A useful practice in this checks-and-balances approach to metrics results is a concept called the Balanced Scorecard.
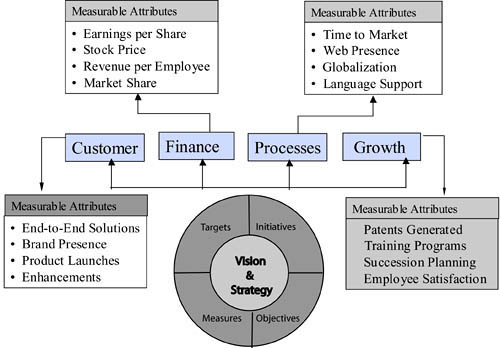
This approach to strategic management and measurement was developed in the early 1990s by Drs. Robert Kaplan (Harvard Business School) and David Norton (Balanced Scorecard Collaborative). Recognizing some of the weaknesses and vagueness of previous management approaches, the Balanced Scorecard approach provides a clear prescription for what companies should measure in order to “balance” the financial perspective.
Figure 15-1 shows an example model of how the Balanced Scorecard approach can be used to measure financial as well as other measurable nonfinancial attributes. This approach will reflect company's performance measured in line with customer, business process efficiency, employees, research, and growth perspectives.
Once the high-level strategic and key operational metrics are identified, the next challenge is presenting the information. While the objective of having consistent measures throughout your organization is important, presenting that information to different groups of people requires customizing the message using the same data. One of the most popular and successful techniques for making the metrics part of the core drivers in your company is via the Balanced Scorecard.
Like any management system developed to date, the Balanced Scorecard, inappropriately applied, can yield undesired effects. Nevertheless, it offers one of the simplest and most effective approaches to keeping measurements central to daily operations and long-term planning. A Balanced Scorecard provides a way to constantly monitor the ability of a company's core businesses processes to deliver against the strategic intent. Simply put, it helps to answer the question, Is my company (and your department) delivering in the areas we need to meet our key objectives? Developing a Balanced Scorecard can help focus on companywide strategic objectives at the executive level, which can then be used as the basis for top-down objective setting.
The best first step in applying this model is to set the vision by evaluating core strategic objectives and putting them in categories. The CIO is in a unique position to have visibility across all areas of the business and should take an active role in providing guidance to groups on operational or process failures as they relate to cross-organizational efficiencies. These are likely to reflect the areas from which they are identified: better ways to support customers in the services organization, improved financial performance in Treasury, time-to-market opportunities in product development; improved retention in HR, and so on.
While each department's needs are critically important to that department, spreading IT or company resources across every group equally to address each challenge is a certain path to failure. The executive team must make decisions as to the relative priority of each strategic objective. To be most effective, these must be companywide, and a stacked ranking should be completed for all areas. Once completed, these rankings will determine the relative weight and resourcing by all groups for each goal. The outcome is a tool to translate and present IT's organizational and individual metrics to the rest of the organization.
Applying this notion to extend the previous example, requiring the CIO to meet a 5 percent of revenue target, we see a change in how the final metric is presented. This constraint maps to a corporate objective of increasing gross margins by XX percent or reducing the cost of G&A by YY percent. Now, instead of measuring the team's performance based on a percentage of revenue, targets can be established in terms of expense on gross margins:
• Total budget = $10M or 5 percent of revenue
• Operational budget = $8M or 4 percent of revenue
• Help desk = $600,000 or .3 percent of revenue
• 40,000 cases annually
This translates to .002 percent gross margin improvement for every 4,000 help desk cases eliminated.
The Balanced Scorecard must be a living document, firmly supported throughout the management team and practiced by leadership throughout the company. It becomes the primary tool for ensuring constant course correction, resource adjustment, priority adjustment, and resource allocation rather than just a quarterly report to be reflected on long after the ability to make a change is past.
To make a system like this work, monthly, weekly, or even daily reports that directly tie to a Balanced Scorecard objective are required.
Table 15-1.
The short description of an SLA is a report of operational metrics. Once the organization has established a first-pass Balanced Scorecard, it is important (and much easier) to tie operational metrics for the IT organization and partner vendors to the company's scorecard.
However, making that translation meaningful to the IT staff isn't easy. The IT Balanced Scorecard example above is financially driven, and ultimately, much of IT's business can be analyzed in a similar way. The hard sell to the IT staff members is in expanding their view of the purpose and spirit of the SLA. As mentioned previously, it is human nature to optimize to the metrics. Operationally oriented people tend to forget the greater purpose, the spirit of the SLA as opposed to its letter. It is critical to tie operational metrics to the traditional SLAs and SLOs so that both are meaningful.
The following are “10 Truths” about good SLAs, whether they are internally or externally focused:
- SLAs are a highly useful communication vehicle.
- SLAs outline services provided, performance levels, and legal ramifications. According to the ASP Industry Consortium's “Buyers Guide to Service Level Agreements,” Information that should be contained in an SLA includes the purpose of the SLA, description of service, duration of service, installation timetable, payment terms, termination conditions, and legal issues such as warranties, indemnities, and limitation of liability.
- Business goals are always detailed in the SLA.
- Performance levels drive pricing.
- SLAs are always customized to the particular purpose.
- Metrics are always outlined for service performance.
- The supplier of the services is not the only (and should not be the only) party responsible for monitoring compliance.
- The consumer and the supplier of a service are jointly responsible for the terms of the SLA.
- An SLA is not a guarantee of service. However, nothing should be agreed upon unless it is determined to be a commercially reasonable and viable objective.
- Remediation, revision, and renegotiation are always options.
As stated early in this chapter, there is a long history of techniques employed in the identification of performance gaps, successes, and failures in IT. This chapter has been limited only by the number of pages in which we could distill some of the more prominent approaches to date, but the treatment here is insufficient in light of the rapid pace of technological, social, and global economic change.
Just as it is always paramount to establish the true value and requirements for the outcome before starting any business initiative, so is the case here:
• Survey the myriad aspects of your organization.
• Derive the greatest benefits of metrics and measurement by analyzing only those elements that:
– Are not being well-managed.
– Are in the critical path of the organization, process, or company.
• Automate whatever will be routinely measured.
Although it may sound trite, in all of our years combined, we have learned to never fear a negative result or discovery. Such a discovery represents the opportunity you were seeking in instituting this discipline by which you will make change for the better.