Contributions from Mike Shapiro
This chapter introduces the Modular Debugger, MDB. The subsequent chapters serve as a guide to learn basic MDB capabilities.
If you were a detective investigating the scene of a crime, you might interview witnesses and ask them to describe what happened and who they saw. However, if there were no witnesses or these descriptions proved insufficient, you might consider collecting fingerprints and forensic evidence that could be examined for DNA to help solve the case. Often, software program failures divide into analogous categories: problems that can be solved with source-level debugging tools; and problems that require low-level debugging facilities, examination of core files, and knowledge of assembly language to diagnose and correct. The MDB environment facilitates analysis of this second class of problems.
It might not be necessary to use MDB in every case, just as a detective doesn’t need a microscope and DNA evidence to solve every crime. However, when programming a complex low-level software system such as an operating system, you might frequently encounter these situations. That’s why MDB is designed as a debugging framework that lets you construct your own custom analysis tools to aid in the diagnosis of these problems. MDB also provides a powerful set of built-in commands with which you can analyze the state of your program at the assembly language level.
MDB provides a completely customizable environment for debugging programs, including a dynamic module facility that programmers can use to implement their own debugging commands to perform program-specific analysis. Each MDB module can examine the program in several different contexts, including live and postmortem. The Solaris Operating System includes a set of MDB modules that assist programmers in debugging the Solaris kernel and related device drivers and kernel modules. Third-party developers might find it useful to develop and deliver their own debugging modules for supervisor or user software.
MDB offers an extensive collection of features for analyzing the Solaris kernel and other target programs. Here’s what you can do:
Perform postmortem analysis of Solaris kernel crash dumps and user process core dumps.
MDB includes a collection of debugger modules that facilitate sophisticated analysis of kernel and process state, in addition to standard data display and formatting capabilities. The debugger modules allow you to formulate complex queries to do the following:
– Locate all the memory allocated by a particular thread
– Print a visual picture of a kernel STREAM
– Determine what type of structure a particular address refers to
– Locate leaked memory blocks in the kernel
– Analyze memory to locate stack traces
Use a first-class programming API to implement your own debugger commands and analysis tools without having to recompile or modify the debugger itself.
In MDB, debugging support is implemented as a set of loadable modules (shared libraries on which the debugger can run
dlopen(3C)), each of which provides a set of commands that extends the capabilities of the debugger itself. The debugger in turn provides an API of core services, such as the ability to read and write memory and access symbol table information. MDB provides a framework for developers to implement debugging support for their own drivers and modules; these modules can then be made available for everyone to use.Learn to use MDB if you are already familiar with the legacy debugging tools
adbandcrash.MDB is backward compatible with these existing debugging solutions. The MDB language itself is designed as a superset of the adb language; all existing adb macros and commands work within MDB, so developers who use adb can immediately use MDB without knowing any MDB-specific commands. MDB also provides commands that surpass the functionality available from the crash utility.
Benefit from enhanced usability features. MDB provides a host of usability features:
– Command-line editing
– Command history
– Built-in output pager
– Syntax error checking and handling
– Online help
– Interactive session logging
The MDB infrastructure was first added in Solaris 8. Many new features have been added throughout Solaris releases, as shown in Table 12.1.
This section discusses the significant aspects of MDB’s design and the benefits derived from this architecture.
MDB has several different types of building blocks which, when combined provide a flexible and extensible architecture. They include:
Targets: the object to be inspected, such as kernel crash dumps and process core files.
Debugger commands or dcmnds.
Walkers: routines to “walk” the examined object’s structures.
Debugger modules or dmods.
Macros: sets of debugger commands.
The following section describes each of these objects in more detail.
The target is the program being inspected by the debugger. MDB currently provides support for the following types of targets:
User processes
User process core files
Live operating system without kernel execution control (through
/dev/kmemand/dev/ksyms)Live operating system with kernel execution control (through
kmdb(1))Operating system crash dumps
User process images recorded inside an operating system crash dump
ELF object files
Raw data files
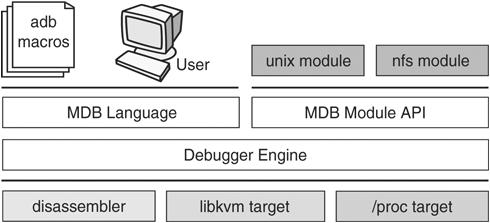
Each target exports a standard set of properties, including one or more address spaces, one or more symbol tables, a set of load objects, and a set of threads. Figure 12.1 shows an overview of the MDB architecture, including two of the built-in targets and a pair of sample modules.
A debugger command, or dcmd (pronounced dee-command) in MDB terminology, is a routine in the debugger that can access any of the properties of the current target. MDB parses commands from standard input, then executes the corresponding dcmds. Each dcmd can also accept a list of string or numerical arguments, as shown in Section 13.2. MDB contains a set of built-in dcmds described in Section 13.2.5, that are always available. The programmer can also extend the capabilities of MDB itself by writing dcmds, using a programming API provided with MDB.
A walker is a set of routines that describe how to walk, or iterate, through the elements of a particular program data structure. A walker encapsulates the data structure’s implementation from dcmds and from MDB itself. You can use walkers interactively or as a primitive to build other dcmds or walkers. As with dcmds, you can extend MDB by implementing additional walkers as part of a debugger module.
A debugger module, or dmod (pronounced dee-mod), is a dynamically loaded library containing a set of dcmds and walkers. During initialization, MDB attempts to load dmods corresponding to the load objects present in the target. You can subsequently load or unload dmods at any time while running MDB. MDB provides a set of standard dmods for debugging the Solaris kernel.
A macro file is a text file containing a set of commands to execute. Macro files typically automate the process of displaying a simple data structure. MDB provides complete backward compatibility for the execution of macro files written for adb. The set of macro files provided with the Solaris installation can therefore be used with either tool.
The benefit of MDB’s modular architecture extends beyond the ability to load a module containing additional debugger commands. The MDB architecture defines clear interface boundaries between each of the layers shown in Figure 12.2. Macro files execute commands written in the MDB or adb language. Dcmds and walkers in debugger modules are written with the MDB Module API, and this forms the basis of an application binary interface that allows the debugger and its modules to evolve independently.
The MDB namespace of walkers and dcmds also defines a second set of layers between debugging code that maximizes code sharing and limits the amount of code that must be modified as the target program itself evolves. For example, imagine you want to determine the processes that were running when a kernel crash dump file was produced. One of the primary data structures in the Solaris kernel is the list of proc_t structures representing active processes in the system. To read this listing we use the ::ps dcmd, which must iterate over this list to produce its output.The procedure to iterate over the list is is encapsulated in the genunix module’s proc walker.
MDB provides both ::ps and ::ptree dcmds, but neither has any knowledge of how proc_t structures are accessed in the kernel. Instead, they invoke the proc walker programmatically and format the set of returned structures appropriately. If the data structure used for proc_t structures ever changed, MDB could provide a new proc walker and none of the dependent dcmds would need to change. You can also access the proc walker interactively with the ::walk dcmd to create novel commands as you work during a debugging session.
In addition to facilitating layering and code sharing, the MDB Module API provides dcmds and walkers with a single stable interface for accessing various properties of the underlying target. The same API functions access information from user process or kernel targets, simplifying the task of developing new debugging facilities.
In addition, a custom MDB module can perform debugging tasks in a variety of contexts. For example, you might want to develop an MDB module for a user program you are developing. Once you have done so, you can use this module when MDB examines a live process executing your program, a core dump of your program, or even a kernel crash dump taken on a system on which your program was executing.
The Module API provides facilities for accessing the following target properties:
Address spaces. The module API provides facilities for reading and writing data from the target’s virtual address space. Functions for reading and writing using physical addresses are also provided for kernel debugging modules.
Symbol table. The module API provides access to the static and dynamic symbol tables of the target’s primary executable file, its runtime link editor, and a set of load objects (shared libraries in a user process or loadable modules in the Solaris kernel).
External data. The module API provides a facility for retrieving a collection of named external data buffers associated with the target. For example, MDB provides programmatic access to the
proc(4) structures associated with a user process or user core file target.
In addition, you can use built-in MDB dcmds to access information about target memory mappings, to load objects, to obtain register values, and to control the execution of user process targets.


