
9. Committing to Project Selection, Prioritization, and Chartering
For any initiative, the greatest challenge is identifying what to work on first. Business success is largely a function of focus and prioritization. From Labovitz and Rosansky’s excellent book, The Power of Alignment, the challenge is, “The main thing is to keep the main thing the main thing!” To make the main thing the main thing comes to play in driving the philosophy of project selection. The dominant strength of any Six Sigma deployment is that it allows you the ability to identify great projects upon which to work.
The old “garbage in, garbage out” adage certainly applies here. Many TQM deployments fell short for the lack of assigning TQM teams something important to work on. Many companies left it up to the teams to figure what projects they would address. The teams didn’t have the big picture and tended to work on what was important to them instead of what was important to the business.
Motorola did a great job in helping organizations prioritize projects. By insisting that everyone track defect rates (metric: defects per unit) on a minute-to-minute basis, every organization had a prioritized list (Pareto) of the most frequently occurring defects. The trend chart portraying a positive or negative trend in defects per unit was carefully reviewed at several levels of leadership. The project selection was fairly easy. Priority projects were those that addressed the most frequently occurring defects or the defects that were most important to customers.
As a production manager in Motorola, and a statistician with a Ph.D., I felt I was not really ready to run a large production line (three-shift operation with over 250 operators). I took the job because, in my heart, I felt I had to show the efficacy of running a manufacturing operation using Six Sigma. Although fellow statisticians thought I was crazy, those two years turned out to be the most interesting and successful of my career. Here’s what I did.
Based on the production line’s Paretos of defects, I assigned my manufacturing engineers and technicians to specific process areas. I had each engineer and technician list the top defects in their process areas, along with potential project ideas to eliminate those defects. We reviewed the proposed projects as a group and drew our line in the sand. We then estimated the expected percentage reduction of each defect. I forecasted what our total defects per unit would be by the end of the year. In a weekly quality meeting, the team (including supervisors) would review the status of each Six Sigma project.
Now, I was nervous. I had never done this before and neither had any other production manager in the plant. Would this really work? Had the right projects been selected? Could I manage this improvement process? Well, the end of the story is positive. We ended up beating the forecast by a significant margin, and we looked pretty good.
Luckily we had a great defect tracking system, so we could determine within about 20 minutes if an experimental process change was working or not. We were in the position to analyze the outcome of planned experiments very quickly. But, in the end, giving my group of engineers and the line operators (they were assigned to high-performance work teams), a sane way to prioritize and go after big issues was the ticket. To create a system centered around one or more metrics will be your challenge.
Your challenge is actually greater than mine was. You’ve got to commit to creating a project selection system that covers almost every aspect of your business. Out of that system will emerge a new list of great projects as the new projects are completed. Along with that system, you will also have to develop an IT system that allows you to track the progress of ongoing projects across your company. Luckily, there are some excellent systems already available, as discussed in Chapter 14, “Defining the Software Infrastructure: Tracking the Program and Projects.”
Six Sigma Leadership Roadmap
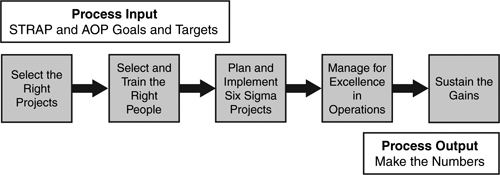
My company has developed a five-step Six Sigma leadership roadmap, as presented in Figure 9.1. The inputs are the strategic and annual operational plan goals and target, and the output is making the numbers at the end of the year. The five steps in the roadmap are as follows:
1. Select the right projects.
2. Select and train the right people.
3. Plan and implement the Six Sigma projects.
4. Manage Six Sigma for excellence.
5. Sustain the gains.
Figure 9.1 The leading Six Sigma leadership roadmap—outputs and inputs.
Selecting the Right Projects
It’s no coincidence that the first step addresses project selection. The final results of each year’s Six Sigma efforts are directly related to the quality of the projects inputted into the leadership roadmap. This roadmap will be discussed in detail in Chapter 15, “Leading Six Sigma for the Long Term,” and each of the preceding steps has its own roadmap. The steps in the roadmap for the first step, selecting the right projects, are as follows:
1. Clarify the big picture.
2. Establish the productivity baseline.
3. Prioritize projects based on customer value, resources required, and necessary timing.
4. Select key projects with leadership buy-in.
5. Check accountability:
a. Business level.
b. Personal level.
With this roadmap in mind, let’s review the importance in the business model of linking internal activities with the external realities. Linking the internal Six Sigma projects with the company’s strategic plan ideally completes this linkage. We’ll review a project example list from Chapter 2, “The True Nature of Six Sigma: The Business Model,” because it relates directly to project selection. Table 9.1, with the nine categories of target operational metrics, includes a list of example project categories. We’ll call these operational metrics Business Critical Ys at this point. Because the operational metrics are outputs from your system, selecting the right outputs provides you with a list of Critical Ys.
Table 9.1 Project Prioritization and Selection Roadmap
As you can see, these project categories cover a wide number of functions within the organization, and all cover a pretty wide scope. For example, the project category titled improve product flow can easily consist of many projects focusing on numerous process steps or multiple product lines.
Project Clusters. I will refer to these project categories as project clusters correlated to a set of projects. Each project cluster will have several projects that are identified and prioritized. The challenge is to prioritize these nine operational metrics (Critical Ys) into, say, three or four, then prioritize each of the project clusters within each operational metric, and then prioritize the projects within each of the top priority clusters. The operational metrics (Critical Ys) with associated project clusters are as follows:
1. Gross Sales
1. Reduce sales price errors.
2. Improve capacity productivity.
3. Optimize mix of products sold.
4. Increase price through good product design.
2. Discounts
1. Reduce special sales allowances.
2. Reduce contract discounts.
3. Cost of Sales (Material, Labor, Overhead)
1. Improve product flow.
2. Lower supplier costs.
3. Improve quality in production.
4. Improve quality in suppliers.
5. Improve payables terms.
6. Reduce inventory owned.
7. Redeploy assets.
8. Improve equipment uptime.
4. Warranty
1. Improve manufacturing processes.
2. Improve source of components.
3. Reduce testing.
4. Streamline warranty process.
5. Improve warranty forecasting.
6. Eliminate abuses of warranty system.
7. Improve design process to improve process and product quality.
8. Fix issues quickly to satisfy customers.
5. Engineering Expenses
1. Reduce time to develop a product or service.
2. Reduce required product testing.
3. Improve cycle time of engineering change notices without impacting quality.
4. Better utilize partners and suppliers for better designs.
5. Improve technology development.
6. Marketing Expenses
1. Reduce discounts.
2. Eliminate low or no margin businesses.
3. Improve capacity productivity.
4. Improve processes for communicating product or service volumes.
5. Improve forecasting process.
6. Improve voice of the customer data collection.
7. Administrative Expenses
1. Improve administrative flows.
2. Reduce defects in administrative processes.
3. Reduce depreciation, taxes, and insurance.
4. Eliminate central inventory holdings.
5. Reduce the number of suppliers.
8. Interest
1. Improve management of cash.
2. Reduce inventory levels.
3. Improve receivable process.
5. Minimize fixed-asset investments.
9. Taxes
1. Optimize tax process to obtain tax advantages.
2. Prevent overpayment of taxes.
3. Optimize inventory levels.
An example of Critical Ys and project clusters are lifted from Chapter 2. Let’s say the Critical Ys for a company have been determined to be operating margins, cash flow, return on capital, revenue, and return on investment. Going back to the Y = Function (Xs) formula, our Ys will be the Critical Ys and the Xs will function as project clusters:
• Y(operating margins) = f (revenue, product costs, business costs)
• Y(cash flow) = f (profits, working capital)
• Y(return on capital) = f (volume, average selling price, discounts)
• Y(revenue) = f (volume, average selling price, discounts)
• Y(return on investment) = f (profit, investments, net assets, asset turnover)
So the project clusters for the Critical Y of operating margins will be revenue, product costs, and business cost. The company will now look for potential projects that address those three areas. Projects addressing product costs may include projects in yield improvement, reduction of scrap, and improvements reducing cost-of-poor-quality. So, at the end of the year, your company should be able to link projects to project clusters and to the Critical Ys, respectively. A summary statement for improving operating margins, at the beginning of the year, follows.
Improvments in operating margin will include bottom-line impact of capacity expansion (growth) or cost reduction (productivity) versus prior year. So, a bunch of projects addressing the two project clusters (capacity expansion and productivity) should be identified and chartered early in the year. Other examples of Critical Ys linked to the strategic goals of improving growth, productivity, and working capital are the following:
• Growth
• Revenue due to mergers and acquisitions.
• Revenue due to new products.
• Sales volume.
• Capacity/productivity.
• Cost of poor quality.
• Rolled throughput yield.
• Working capital
• Inventory turns.
• Days sales outstanding.
• Finished goods inventory.
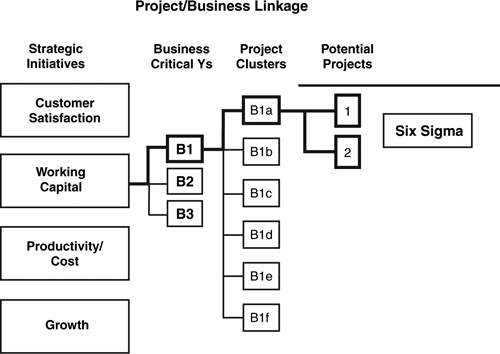
Figure 9.2 illustrates the linkage among strategic initiatives, Business Critical Ys, project clusters, and projects. Using this methodology allows each project to be linearly mapped directly to a specific strategic initiative. Figure 9.2 follows one line from the strategic initiative of working capital to the Critical Y, projects cluster, and a set of projects for one project cluster.
Figure 9.2 Strategic initiatives linked to Business Critical Ys, project clusters, and projects. Each of the four strategic initiatives would have a similar tree alignment.
Taking the highlighted line in Figure 9.2, Figure 9.3 shows what one project line would look like for the strategic initiative of working capital. This figure shows that working capital might have a Critical Y of reducing working capital to $10.7 million, a project cluster addressing the customer order process, and a project with the goal to minimize order adjustments. Each project cluster would have a set of identified potential projects tied to it.
Figure 9.3 Strategic initiatives linked to Business Critical Ys, project clusters, and projects. Each project has a line of sight to a strategic initiative.
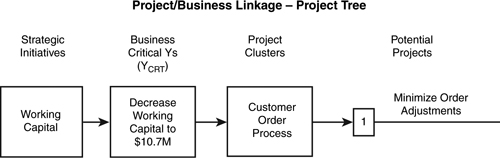
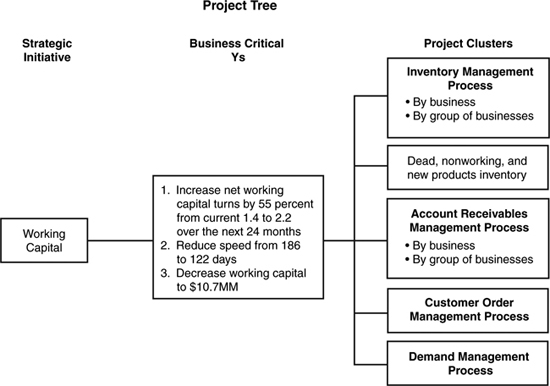
Figure 9.4 shows a more detailed example. Suppose we look again at this company’s strategic initiative of working capital level. They have defined three Business Critical Ys (sometimes known as goals): net working capital turns, cycle time, and decreased working capital. The business teams have identified some projects clusters. The next step would have the different functions define projects that address the project clusters. All those projects would directly impact cash and working capital levels. There could easily be 40 or more projects addressing this proposed package.
Figure 9.4 The linkage between the strategic initiative, Business Critical Ys, and project clusters. The next step is to identify projects for each project cluster.
So, now we review the project selection and prioritization roadmap that includes some steps from all five steps of the project selection roadmap. This is a high-level overview of the actions that must be accomplished several times a year to ensure that all Six Sigma projects are the right projects for the company. Each of these steps will be covered in detail with examples.
Project Prioritization and Selection Roadmap
You will be using the roadmap shown in Table 9.1 to develop your project selection system that will be used throughout your company. There might even be a standard operating procedure to describe project selection. The final project selection system will consist of steps in this chapter and steps that have worked in your company before. Because project selection is so important to Six Sigma, or any initiative, creating a process and a system will result in consistency across your organization and improve the probability of each function successfully identifying projects that will line up with your strategy and your external realities.
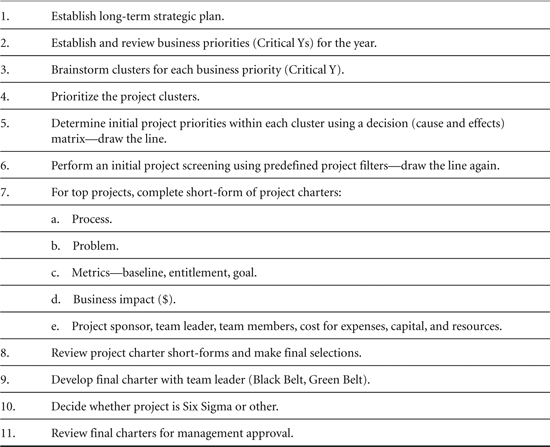
Because project selection is so important during the first 90 days of your Six Sigma launch, project selection makes up a significant amount of launch activity and time. Table 9.2 presents the short-form of the timetable provided in Chapter 7, “Defining the Six Sigma Project Scope.” This timetable for the first 90 days highlights the milestones related to project selection. Of the 11 milestones, the five boldfaced milestones are directly related to project selection. Although good project selection relates to all 11 milestones, over 50 percent of the milestones are focused on project selection.
Table 9.2 Key Actions for the First 90 Days of Your Six Sigma Launch*
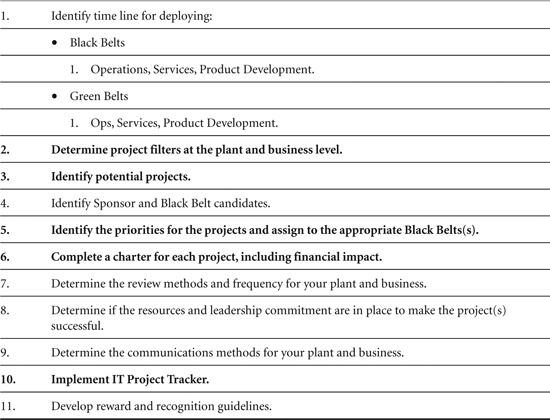
* Bold-faced milestones are directly related to project selection.
We will now go through the roadmap for the leadership step, select the right projects. The first step is: Clarify the big picture.
Clarify the Big Picture. Clarifying the big picture is the process of establishing linkages. Going to the business model, we must link the issues associated with our external reality to clearly stated financial target and coordinated internal activities.
The two actions for this step are (1) to identify the business strategic initiatives and (2) to translate these into primary operational objectives for all levels and divisions of your organization. Along with these, financial and performance targets (Critical Ys) will be disseminated. So if productivity improvement, cash flow improvement, and cost improvement are the important things (Critical Ys), these must be made clear to the company.
Any projects that don’t address these three strategic areas are immediately called into question. Clarifying the big picture can be simple. Paul Norris, CEO of WR Grace, simply put one slide on the overhead projector: $56 Million. That’s the level of pretax profit he was looking for at the end of the year from Six Sigma actions. Everyone in the room was aligned with Paul. The level of urgency noticeably increased. Figure 15.5 shows a summary diagram of Step 1 of the leadership.
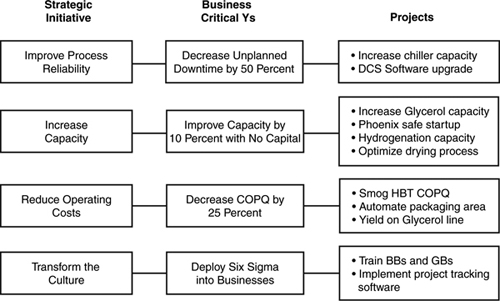
Let’s suppose we have a manufacturing company whose main strategy centers around establishing operational excellence. Its primary strategic goals are as follows:
• Improve process reliability.
• Increase capacity.
• Reduce operating costs.
• Transform the culture.
Figure 9.5 illustrates going from strategies to Business Critical Ys to a list of projects for each Critical Y. I have omitted the set of project clusters for each Critical Y. You’ll notice that all projects are not necessarily Six Sigma projects. For example, the project, training Black Belts and Green Belts, is more of an action than a process improvement project. This list of projects, if successful, will move this company forward in its challenge to attain the strategy.
Figure 9.5 The linkage between the strategic initiative, business Critical Ys, and projects. The projects are aligned with project clusters for each Critical Y.
Types of Projects: Top-Down and Bottom-Up
Six Sigma projects usually fall into two primary categories: Top-Down and Bottom-Up. The Top-Down projects are projects that are discovered by starting with the strategic initiatives and the annual operating plan. These are the projects that will move the company forward strategically. Bottom-Up projects are focused tactically on problems that need to be solved immediately. Bottom-Up projects address the areas in which the company is feeling pain. For example, for a sold-out product (you can sell everything you make) not meeting customer demand, any increase in manufacturing capacity will be immediately welcome.
Top-Down Projects. In the ideal world, all Six Sigma projects would be top-down. All projects would be driven by the strategic plan and the annual operating goals around that plan. Every successfully completed project would place the company that much closer to executing the strategic plan. Because there is a history of CEOs getting fired largely due to their inability to execute strategy, this core capability is crucial to the success of the company and its CEO and senior leaders.
To select Top-Down projects is to identify the relevant business processes that, if improved, will move the company forward strategically. To initiate the Top-Down project selection process, two steps are completed for each of the selected business processes: (1) Calculate the baseline process performance; and (2) Estimate the performance entitlements.
The process baseline represents the current process performance on a set of the Critical Y’s and the process entitlement is the theoretical performance on the same metrics if everything ran perfectly. Six Sigma projects reflect the actions necessary to close the gap between baseline and entitlement. For example, the day’s sales outstanding (DSO) might currently be 52.2 days.
Entitlement is defined as the best conceivable performance of a process on any number of variables. For example, the entitlement of yield is 100 percent, of cost of poor quality is zero, and of capacity might be the nameplate or scientifically theoretical performance of a process according to the equipment manufacturer.
By moving from the baseline of 52.2 days to the entitlement of 25 days, we would put about an additional $32 million to the bottom line every year. That would convince us that reducing DSO from 52.2 days to a target of 38.6 days (closing the gap between baseline and entitlement by 50 percent) is a great Six Sigma project. Figure 9.6 gives examples of entitlement estimates for a manufacturing process. We are moving toward perfection, and entitlements help us understand the business worth of that effort. Figure 9.7 shows how baseline and entitlement can yield process performance goals.
Figure 9.6 An example of manufacturing process baseline (BSL) performances, process entitlements, and setting goals to close the gap between baseline and entitlement.
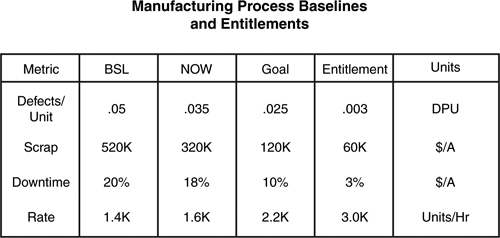
Figure 9.7 Comparing baseline performance (left column) to process entitlement (right column) and setting goals to close the gap between baseline and entitlement by 50 percent.
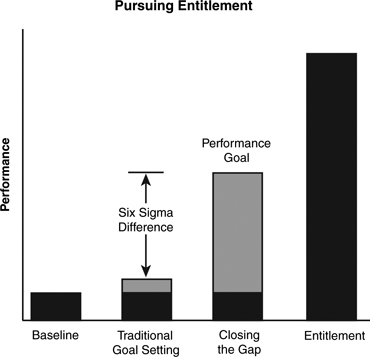
Figure 9.7 shows that, by knowing process baseline performance and estimating entitlement, goals can be aggressively set. A good rule is to close the gap between baseline and entitlement by 50 percent, which is a tough but doable goal.
Bottom-Up Projects. Significant known problems and opportunities can often be identified immediately. Every business confronts chronic problems with their business processes everyday. I was in a rehabilitation hospital and I repeatedly heard, “If we could just fix the scheduling system, my job as a therapist would be much easier.”
Defects in the scheduling system either had patients showing up at the wrong place and the wrong time, or therapists were missing. These mistakes had a huge impact on the operation of this hospital. Here are some other examples of chronic problems:
• Excessive yield loss or product downgrades.
• Customer dissatisfaction from chronic late shipments.
• Inability to penetrate new market segments due to poor process capability.
• Order backlog due to suboptimal capacity utilization.
Each of these issues can be formulated into projects by determining the underlying business/operating process that is performing poorly, and the financial opportunity that would result from improved process capability. To get a good start on identifying the ubiquitous Bottom-Up projects, establishing the baseline process performance will help identify those black holes of process performance. Suppose we have a process that has three steps, and we baseline first-pass yield, cost of poor quality (COPQ), and capacity.
Perfect first pass yield is 100 percent. Anything less than 100 percent means we’re generating scrap or time penalties. COPQ represents the costs of any work in the manufacturing process that is not directly related to adding value to the product. Scrap, rework, inventory, defects, and testing are all examples of COPQ. Every dollar of COPQ we save goes directly to the bottom line. And, finally, the process step that has the least capacity in units per day is the bottleneck. Improvements in capacity will raise the productivity of the entire line.
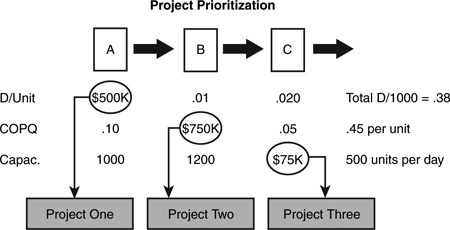
We can see from Figure 9.8 that process step 1 has the worst yield (DPU = .35), process step 2 has the worst COPQ ($0.30 per unit) and, finally, process step 3 has the worst capacity (500 units per day). These are three potential projects. The next step is to set goals and quantify the financial impact of hitting those goals. Figure 9.9 shows each of the three projects analyzed financially. We see that the three projects have a potential to bring about $2 million to the bottom line. Not a bad set of projects.
Figure 9.8 Using the baselines for defects per unit, cost of poor quality, and capacity to identify Bottom-Up projects.
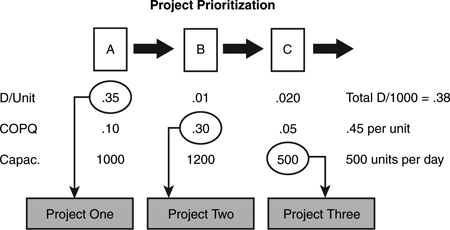
Figure 9.9 Assessing the projects identified from baseline performance for financial impacts.
Project Selection Trends. Initially in a Six Sigma deployment, most of the projects selected tend to be Bottom-Up projects because we know our current situation better than our future situation. But as the Six Sigma deployment progresses, Figure 9.10 shows the evolution of Top-Down and Bottom-Up projects. You can see that the percentage of projects that are Top-Down tends to increase year over year. This is when the real bang for the Six Sigma buck comes.
Figure 9.10 As the Six Sigma initiative matures, the proportion of Top-Down strategic projects increases.
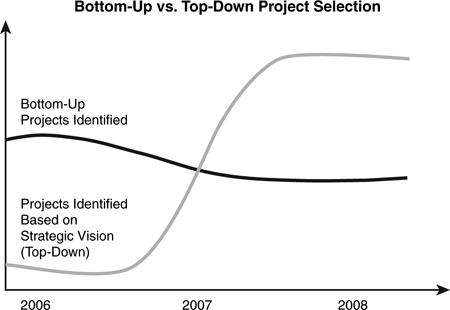
Your company will become more forward looking because it is operating smoothly day-to-day due to many of the Bottom-Up projects that have been completed. AlliedSignal, in 1995, brought over $350 million to the bottom line largely from Bottom-Up projects. Design for Six Sigma was initiated in early 1996, which resulted in a large number of the Six Sigma projects being Top-Down.
Prioritizing Projects
Here’s the situation. A specialty chemical company (I’ll call Chemex) is having an improvement planning meeting to identify improvement projects for next year. This $100 million business identified over 125 projects. Everyone was a little nervous. Most thought, including me, “We don’t have the resources or time to do 125 projects.”
Chemex made the decision to allow my consulting group to meet with the team and go through a prioritization exercise. The effort worked great. They went from a shotgun approach of 125 projects to a precise set of 25 projects. Every project was linked directly toward their strategic plan, and they determined ahead of time that they had the resources to commit to this set of projects.
The toughest part in launching your first wave of Six Sigma Black Belts is sending each student to training with an important project that is doable in less than six months. Each project also has the necessary resources (people and capital) and is tracked by the functional leadership. Any organization can brainstorm 10 flip charts worth of potential projects. But the prioritization is the tough part.
If you use the rule of 80/20 (only 20 percent of the project ideas are really important), developing and committing to a system of prioritization is essential. There’s a big difference in committing to complete 25 projects when compared to 125 projects. Giving your organization the feeling that their time and energy are being dedicated toward accomplishing something important is what excellent leadership is about.
Moving from Strategy to Projects. Chemex, our fictitious chemical company, has decided that its primary strategic initiatives are the following:
• Customer satisfaction (On-time delivery)
• Cash/working capital
• Productivity/cost
• Revenue growth
The leadership team then defined the Business Critical Ys with some potential project clusters for each of the four strategic initiatives. Figure 9.4 shows an example of the Critical Ys and project clusters for the cash/working capital strategy.
Project Prioritization Matrices—The Top-Down Matrix. Each business division or function would brainstorm projects for each project cluster or strategic initiative. The Chemex organization created a preliminary list of 125 projects. Each project group (division or function) then evaluated the projects via a decision matrix similar to a QFD matrix. Figure 9.11 shows the working matrix.
Figure 9.11 Top-Down prioritization matrix scoring potential projects on how well they impact the strategic initiatives. The total score for this example is the sum of the products of importance rating and project impact.
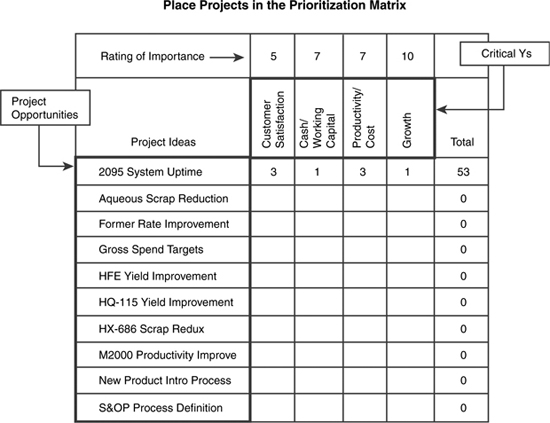
The four strategic initiatives are displayed horizontally across the top of the matrix. The potential project opportunities are displayed down the left column. The purpose of this matrix is first to prioritize (or rank) the potential projects by their total potential impact of the four strategic initiatives. Some projects will impact more than one initiative. For example, an increase in manufacturing capacity can impact growth, customer satisfaction, cash, and productivity.
The first step is to rank each strategic initiative on a 1–10 scale, with 1 being not very important and 10 being extremely important. Figure 9.11 indicates that Chemex looks at Growth as the most important initiative (Score = 10) and Customer Satisfaction as the least important (Score = 5).
The next step is to rate each project’s impact on the four strategic initiatives. A simple scoring system will yield numbers of 0, 1, 3, or 9. The scoring criteria are
• 0 = Not at all related to this initiative.
• 1 = Weak impact on this initiative.
• 3 = Moderate impact on this initiative.
• 9 = Strong impact on this initiative.
Then, each project score is multiplied by the score for the initiative and summed over those products. Figure 9.11 shows one project as it’s scored and the total. The project, 2095 System Uptime, has a total score of 5 × 3 + 1 × 7 + 3 × 7 + 1 × 10 = 53. That way, the projects that impact more than one strategic initiative are favored with higher scores. Figure 9.12 shows the first part of the project list and the scores of each project.
Figure 9.12 A sample of potential projects rated on total impact of the strategic initiatives. Projects are ranked by total score.
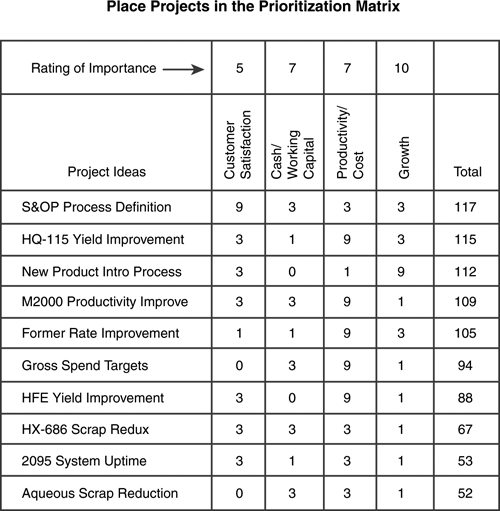
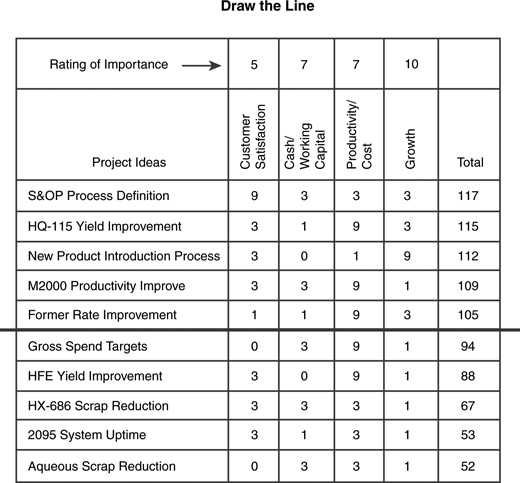
You can see very quickly that the top five potential projects have the highest score because each scores a 9 on at least one initiative, and each scores a 3 on several others. The next step ranks the projects by their total scores, and a line is drawn that separates the best projects from the ones that aren’t so good. See Figure 9.13 for the final results. Notice the line delineating the top projects versus other projects that may be considered in the future.
Figure 9.13 A line is drawn based on the break in final scores. We have identified the top five projects.
The final step of the Top-Down prioritization technique is to do an initial screening, a short evaluation of the top projects. Figure 9.14 displays an example of an initial screening for the top five projects ordered by the total score, the priority score in this table. This initial screening generates the following information about each project in the form of what we might call “Mini-Charters”:
• Priority Score (Total Score from the Matrix)
• Business Impact—Financial
• Business Impact—Non-financial
• Project Metric
• Personnel Resources—Full-Time Equivalent
• Capital Resources
• Estimated Completion Date
Figure 9.14 An initial screening of the top five projects based on impact criteria.
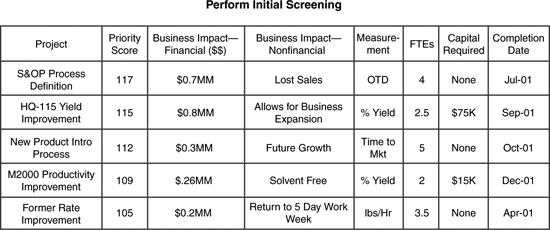
You perform this initial analysis to determine if the division or function has the resources to do the project. The analysis also reaffirms the strategic and business importance of each project. The organization can estimate the total financial and strategic impact of each project. Now we are ready to assign each project to a Black Belt, train the Black Belts, and complete the projects.
Project Prioritization Matrices—The Bottom-Up Matrix. That’s one way to prioritize—the Top-Down way—starting with strategic initiatives. Next is the Bottom-Up prioritization method. These projects are driven by an immediate tactical need. The prioritization process is the same as the Top-Down method with the different items across the top of the matrix.
Looking at the Chemex example in Figure 9.15, you can see the selection scoring criteria represent a combination of strategic initiative and tactical requirements. For example, Chemex considered improving product throughput and avoiding new capital expenditures by optimizing current processes to be very important to accomplish this year. The project scoring criteria with the criteria scores for the matrix are as follows:
• Operational Dollar Impact (6)
• Process Throughput Improvement (9)
• Time to Complete the Project (7)
• Customer Satisfaction (7)
• Capital Avoidance (10)
Figure 9.15 Example of project prioritization based on using Bottom-Up criteria.
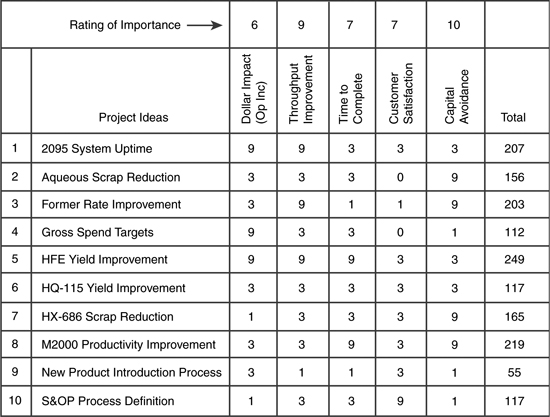
So, when we score and rank the projects with the new criteria, we end up with a different set of projects that better meet the immediate business performance gaps. Figure 9.15 shows the list of the selected projects.
Project Filters. To obtain a set of reasonably objective scoring criteria, the concept of project filters enters into the prioritization process. Project filters represent a set of project selection rules that almost anyone in the organization can use to evaluate potential projects. Let’s look at project filters that Chemex used. These project filters include a list of six scoring criteria along with some number anchors, including the scores 1, 3, and 9.
1. Dollar impact of operating income:
a. 9 = > $1MM
b. 3 = > $250K
c. 1 = < $250K
2. Throughput improvement:
a. 9 = > $1MM
b. 3 = > $250K
c. 1 = < $250K
3. Time to complete:
a. 9 = < 6 months
b. 3 = 6–9 months
c. 1 = > 9 months
4. On-time delivery improvement:
a. 9 = >50 percent
b. 3 = 25–50 percent
c. 1 = <25 percent
5. Capital avoidance:
a. 9 = > $5MM
b. 3 = $1–5MM
c. 1 = < $1MM
6. Other (must specify/define):
a. 9 = High Impact
b. 3 = Medium Impact
c. 1 = Low Impact
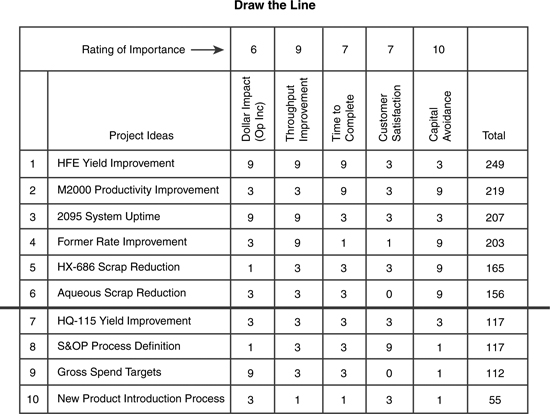
The projects are scored using the scoring scheme derived from the project filters and then ranked and the selection line drawn (see Figure 9.16). The list of selected projects from the Bottom-Up prioritization differs from the Top-Down analysis.
Figure 9.16 Drawing the line to identify the top-rated potential projects.
As Jack Welch has stated in the past, “You have to eat short term while you grow long term.” If a company has serious operating or market issues that are preventing them from performing now, it is best to focus on those issues in their Six Sigma launch. Dynamic leadership supports the organization in understanding what is important now and to act on those priorities.
Here are some other examples of project filters. They’re all different because different companies have different priorities.
• Significant financial impact to the business:
• $500K+ Profit Before Tax (PBT) impact within 12 months of project inception.
• Significantly improves Rolled Throughput Yield, DPU, COPQ, Downtime, Capacity:
• 50 percent increase in Rolled Throughput Yield.
• 50 percent reduction in DPU.
• 50 percent reduction in COPQ.
• 50 percent reduction in Downtime.
• 50 percent increase in Capacity.
• Focuses on high-volume/high-risk products.
• Significantly reduces field inquiries.
• Improves customer service.
Project Filter List #2
• Project significantly improves defects/unit, scrap, downtime, capacity:
• 50 percent increase in First Pass Yield.
• 50 percent reduction in Scrap.
• 50 percent reduction in Downtime.
• 50 percent increase in Capacity.
• Project focuses on high-volume/high-risk products.
• Project significantly reduces field inquiries.
• Project improves customer service.
• Project delivers $250K to the bottom line.
• Project can be completed in (four to six months).
• Project is focused on a process that has variation.
• A clear measurement (or metric) is defined for the project.
Project Filter List #3
1. Is the project focused on a real problem?
2. Will there be a short-term (six-month) real dollar drop to the bottom line?
3. What is the “probability of success” for the project?
4. Is a Black Belt or Green Belt available to lead the project?
5. Will a majority of the Six Sigma tools be applicable to the project?
6. What resources, financial and human, are required to support the project?
7. Will the project require 12 months or less to complete?
8. Does the project address some part of the “hidden factory?”
9. Will the completion of the project provide process improvement?
10. Was the project identified by the manufacturing staff?
11. Does the project have intangible benefits, customer satisfaction, and so on?
12. What level of customer impact is forecast for this project?
Project Filter List #4
1. Reduce waste by 50 percent.
2. Increase capacity—when > 85 percent sold.
3. Increase service level to > 98 percent on time in full.
4. Reduce customer complaints by 50 percent.
5. Bottom-line impact > $100K.
6. Complete project within six months.
Project Filter List #5
• General
1. Focus on “Quick Hit” projects that will allow for early success.
2. Projects that lead company to move to “Best in Class” reputation.
• Customer Growth
1. Improve on time performance by 50 percent.
2. Improve capacity performance by > 20 percent.
• Technology/R & D
1. Dollars/unit time savings of > $100K/yr.
2. Profitability of > 20 percent.
• Operations
1. RTY/DPU improvement of 75 percent or more.
2. PPM returns of above 10,000 ppm reduced by 90 percent.
Checking and Establishing Accountability: Chartering Projects
Project Chartering. The hard part is over. You’ve now got a list of excellent projects that, if completed, leaves the company performing better than it was before. But the devil’s in the details. Your organization has to select Black Belts, train them, and provide the resources necessary for project success.
The step that sets all these actions in motion is chartering the projects. The project charter is a contract among the Six Sigma team, the leader holding the accountability for the project (Project Champion), and the company leadership. By doing a good job with the charter, the important questions are answered before the project is initiated. Expectations are clear, and everyone is locked and loaded. An example of a project charter is displayed in Table 9.3. An example of a Six Sigma project status report is listed in Table 9.4.
Table 9.3 Six Sigma Project Charter
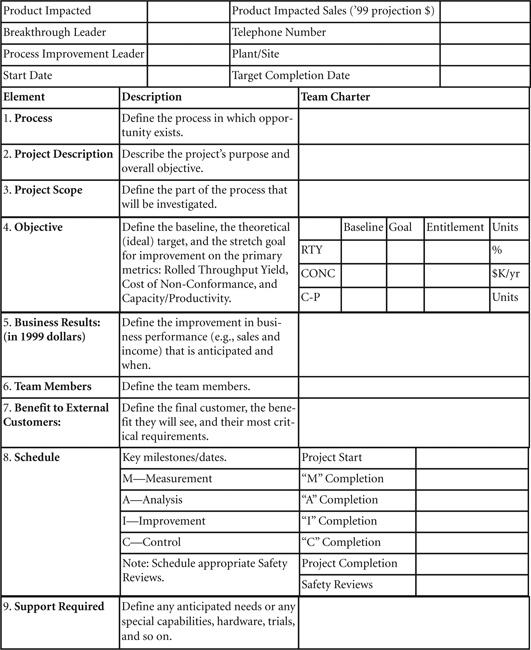
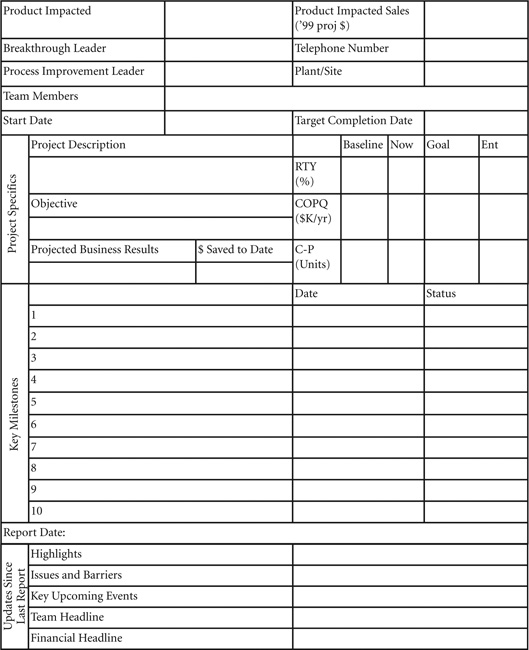
Table 9.4 Six Sigma Project Status
Besides the usual boilerplate, there are some sections that are very important. The section titled “objectives” consists of a set of metrics upon which process performance will be based. Section 5—business results in $—is probably the most important section. Understanding the financial potential of the projects takes active participation by the finance function in a company. Each Six Sigma project must have a complete charter.
The Project Champion develops the preliminary charters based on the project list. The Plant, Division, or Function Leadership Team reviews the charters to select the key projects. Key projects have their charter further developed by the Project Champion and the Black Belt. The final charter review is completed with the Champion, Black Belt, and Plant (or functional) Leadership Team. The charter Summary reports are useful in business quarterly reviews.
Here is a list of questions the charter should answer:
1. In measurable terms, what is the project trying to accomplish?
2. Is this project worth doing?
3. What happens if this project fails?
4. Does it fit within the business objectives?
5. Is this a customer-oriented project?
6. How’s the scope? Boiling the Ocean or Right Size?
7. What are the specific goals? Stretch targets?
8. Who owns the process? Will they be involved?
9. What’s the probability of success?
10. Can we get benchmark information? If so, where?
11. What resources are available to the team?
Check for Accountability. After business leadership teams have agreed to the final Six Sigma project list, project accountability is then assigned to the owning manager. The owning manager (sometimes called the Project Champion) reviews the projects with his or her business segment team to validate alignment with the needs, strategy, and financial targets of the business.
Based on approval by the business segment team, the owning manager develops a project charter for each selected project with clearly defined objectives, timing, and linkage to the business. The output of this step is a complete project list, complete with project charters.
At the business level, each chartered project must have a Champion who is held accountable for the success of the Black Belt, and the project Business Management (Leadership Team) must also be held accountable for the success of key projects to ensure they are resourced correctly and given the priority for completion. A senior executive with one of our clients stated, “There are no unsuccessful Black Belts, only unsuccessful Champions.”
At the personal level, each team member, Black Belt or Green Belt, Project Champion, and Leadership Team member must be held personally accountable for the success of the project. Typically, this is reflected in performance management planning. When considering the myriad of actions necessary to deploy Six Sigma, establishing and tracking accountability for the Six Sigma projects is the requirement of long-term success and preventing Six Sigma from turning into the program of the month. Someone needs to know they might be in some trouble if their project fails.
Review Six Sigma Projects. To ingrain Six Sigma into your culture, set the expectation that the Six Sigma program and projects will each be reviewed systematically and at the project owner level and a higher level. The projects reviews should rigorously address these issues:
• Clearly connected to business priorities:
• Strategic and annual operating plans.
• Reasonable scope—doable in four to six months:
• Project support often decreases after six months.
• Scope too large is a common problem.
• Importance to the organization is clear:
• People will support a project when they understand the importance.
• Has support and approval of management:
• Needed to get the resources and remove barriers.
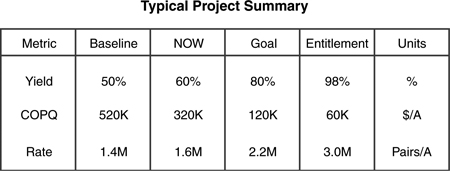
Figure 9.17 shows a typical project summary report that relates project progress to closing the gap between process baseline and process entitlement. It is easy to follow and easy to check project status. This chart is directly derived from the metrics chart in the project charter.
Figure 9.17 The short form of a project review status report. This report includes current performance on three metrics, the goal, and the entitlement.
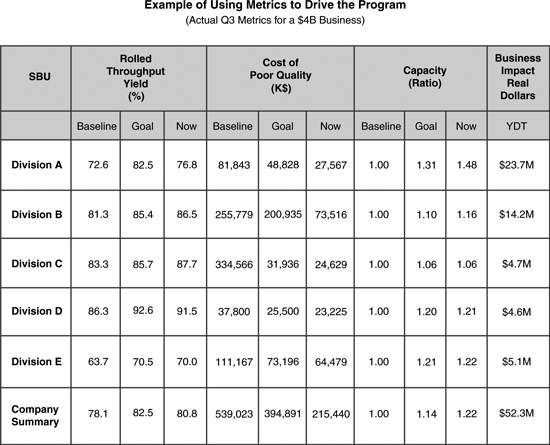
At a larger scale, Figure 9.18 shows summaries of Six Sigma metrics and how their projects are working by division. The right column, Business Impact, is the most important column for driving culture change. If the projects are effective, so is the program. This column indicates that this $4 billion business has achieved over $50 million in financial results in three quarters. That’s $50 million that wasn’t in the original annual operating plan.
Figure 9.18 This is a quarterly report—division by division—of the comprehensive impact that Six Sigma projects have on overall performance. The actual financial benefits are listed in the last column.
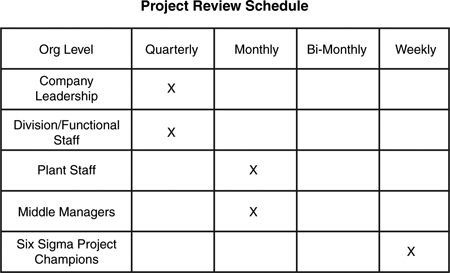
Finally, Figure 9.19 shows a project review schedule for different leadership levels of a company. At the highest level, project and program ought to be reviewed at least quarterly. At the Project Champion level, projects should be reviewed at least once per week to keep the project on track.
Figure 9.19 A recommended project or Six Sigma program review at different levels of leadership in a company.
Summary of Six Sigma Project Selection
Why Projects Matter. Why does selecting great projects for your initial Six Sigma training really matter? High project success rates give you faster acceptance of Six Sigma as a program. Companies successful in deploying Six Sigma develop a pay-as-you-go benefit stream. Benefits start immediately with each training session.
Also, by achieving early results, you will optimize your overall return on training investment. You provide momentum for Six Sigma and you take the wind out of the sails of the naysayers. For example, within the first six months, the engineered materials sector of AlliedSignal chalked up some $50+ million in real financial benefits. There was no problem moving the Six Sigma program forward for a long time.
Why Projects Are Unsuccessful. There are at least four reasons for unsuccessful projects. First, the business need for the project has not been clearly established. This was okay in the TQM days, but not with Six Sigma. When Six Sigma teams know they are working on an important problem for the business, motivation is not an issue.
Second, the Six Sigma team, especially the Black Belt, has not been allocated adequate time to work on the problem. This problem ties into the business need. If an organization knows there is a $1 million project benefit in six months, providing adequate time is not a problem.
Third, the leadership accountability for the project is not clear. No one is personally on the hook for results. By clarifying accountability, you may be able to run, but you can’t hide.
And fourth, the scope of the projects is either too narrow or too wide. The project is either small, not strategically important, or not big enough to demand the need for multiple teams to succeed. Projects need to be scoped properly and scoped in such a way that it can be completed in 6 to 12 months. To improve our success rates, we want to cover the following issues:
1. Clear Business Need—Direct link to critical top-line or bottom-line business issue. Clear business benefits.
2. Clear Support—Highly motivated Champions and Black Belts. Good visibility.
3. Clear Accountability—Personal incentives and potential jeopardy to operating plan.
4. Clear Project Scope—Significant impact within an explicit, limited time frame.
5. Clear Applicability—Good fit with Six Sigma tools and methodology.
How Good Is Your Project Selection Process? Like any process, there should be some metrics to measure to ensure the process is working right. In Chapter 14, I talk about software that allows a company to track projects and obtain some of the following metrics:
• Percent of projects completed in four to six months.
• Average $$ savings per project.
• Average percent benefits actually realized.
• Percent of projects tackling operating plan barriers.
• Percent of projects generating top-line growth.
• Retention rate in Black Belts and Green Belts.
• Percent of Black Belts and Green Belts certified.
• Project completion rate.
• Percent of projects included in the annual operating plan.
Accountability is the key word in project selection. Developing a system by which projects are prioritized, selected, and resourced is an important step in your Six Sigma deployment. Good luck and happy hunting!