16. Packet Monkey Heaven
A packet monkey is an analyst who loves to examine packet headers, typically those for layers 3 (mainly IP) and 4 (TCP and UDP, predominantly) of the OSI model. As far as the packet monkey is concerned, the world ends at layer 4. I dedicate this set of cases to the packet monkeys of the world whose only joy is found in separating the normal and suspicious traffic from malicious traffic.
Truncated TCP Options
Let's start by looking at odd headers with an alert generated by the Snort decoder: Truncated Tcp Options. See the alert highlighted in Figure 16.1, a Sguil screenshot. (See Chapter 10 for information on Sguil.)
Figure 16.1. Truncated Tcp Options alert in Sguil
There's no Snort rule to display because this Truncated Tcp Options alert was generated by Snort's packet decoder. There's not much to see in the packet data window in the lower-right portion of the screen, although make note of the TCP sequence numbers. They'll help us identify the proper packet if we've collected full content data. Our best bet is to examine Ethereal's interpretation of this event (see Figure 16.2).
Figure 16.2. Ethereal's view of full content data
We know the packet that triggered the Snort decoder had source port 20 TCP and destination port 32849 TCP. The ACK flag was set. Packets 3, 6, 7, and 10 in the Ethereal trace meet this description. Which one is exactly the packet that Snort didn't like? The Sguil Seq # field says 284068085. Only one packet in the Ethereal trace contains this sequence number. Packet 10, the last in the trace, shows that sequence number in the top and middle Ethereal panes.
Ethereal gives us an improved view of the offending packet. The highlighted portion of the middle pane in Figure 16.2 states an Unknown option, because the option length of 117 bytes cannot be correct. The decimal 117 is the equivalent of hexadecimal 75. Looking at the highlighted packet contents, we see they begin with 0xde75. According to RFC 793 (http://www.faqs.org/rfcs/rfc793.html), the first byte (here, 0xde) is the option kind, and the second byte (0x75) is the option length. The option length counts the two bytes used to specify the option kind and option length, plus any bytes used for option data.
Using this formula, the option data starts with 0x08 and should continue for another 114 bytes. However, only 10 bytes of option data are shown (ending in 0x53). These few bytes are certainly not 117 as the option length of 0x75 indicates.
Is this evidence of an intrusion? Of course not! Reconstruction of the application layer shows this is simply the result of a directory listing on an FTP server. We can't know why the option length field was specified incorrectly, but it's neither suspicious nor malicious. We see that the source port for this packet was 20 TCP. Port 20 TCP is used in active FTP data channel sessions, so it's reasonable to guess we've found part of an FTP data transfer. Figure 16.3 shows how the application data contained in this TCP session appears when reconstructed with Ethereal's Follow TCP Stream option.
Figure 16.3. Rebuilding the application layer
While layer 4 (TCP) indicated something odd, at layer 7 (FTP), there's nothing to worry about. This is an example of normal traffic, albeit with a weird TCP option enabled.1 We can query in Sguil for sessions involving 66.193.208.66 to find the FTP control channel on port 21 TCP, as shown in Figure 16.4.
Figure 16.4. Sessions involving 66.193.208.66
The highlighted session is the FTP control channel. The third session down from that highlighted session, involving source port 20 and destination port 32849 TCP, corresponds to the session that prompted our investigation. Here is the transcript of the FTP control session. It has been edited to remove text that doesn't contribute to our analysis.
Sensor Name:bourque
Timestamp: 2003-12-18 16:41:20
Connection ID: .bourque_1071765873915830
Src IP: 68.84.6.72 (pcp02347462pcs.manass01.va.comcast.net)
Dst IP: 66.193.208.66 (66-193-208-66.gen.twtelecom.net)
Src Port: 32845
Dst Port: 21
================================================================
DST: 220 ftp.sunfreeware.com FTP server ready.
SRC: USER ftp
DST: 331 Guest login ok, send your complete e-mail
address as password.
SRC: PASS
DST: 230-==============================================
DST: 230-This is the ftp.sunfreeware.com ftp server
DST: 230-==============================================
DST: 230 Guest login ok, access restrictions apply.
SRC: PORT 68,84,6,72,128,78
DST: 200 PORT command successful.
SRC: NLST
DST: 550 No files found.
SRC: CWD pub
DST: 250 CWD command successful.
SRC: PORT 68,84,6,72,128,79
DST: 200 PORT command successful.
SRC: NLST -al
DST: 150 Opening ASCII mode data connection for /bin/ls.
DST: 226 Transfer complete.
SRC: CWD freeware
DST: 250 CWD command successful.
SRC: CWD sparc
DST: 250 CWD command successful.
SRC: CWD 8
DST: 250 CWD command successful.
SRC: PORT 68,84,6,72,128,80
DST: 200 PORT command successful.
SRC: NLST
DST: 150 Opening ASCII mode data connection for file list.
DST: 226 Transfer complete.
SRC: PORT 68,84,6,72,128,81 <-- This is our session of interest!
DST: 200 PORT command successful.
SRC: NLST gcc*
DST: 150 Opening ASCII mode data connection for file list.
DST: 226 Transfer complete.
SRC: PORT 68,84,6,72,128,82
DST: 200 PORT command successful.
SRC: RETR gcc-3.3.2-sol8-sparc-local.gz
DST: 150 Opening ASCII mode data connection for
gcc-3.3.2-sol8-sparc-local.gz (94086730 bytes).
SRC: ..
SRC: .
SRC: .ABOR
DST: 426 Transfer aborted. Data connection closed.
DST: 226 Abort successful
SRC: TYPE I
DST: 200 Type set to I.
SRC: PORT 68,84,6,72,128,83
DST: 200 PORT command successful.
SRC: TYPE A
DST: 200 Type set to A.
SRC: NLST gcc-3.3.2*
DST: 150 Opening ASCII mode data connection for file list.
DST: 226 Transfer complete.
SRC: TYPE I
DST: 200 Type set to I.
SRC: PORT 68,84,6,72,128,84
DST: 200 PORT command successful.
SRC: RETR gcc-3.3.2-sol8-sparc-local.gz
DST: 150 Opening BINARY mode data connection for
gcc-3.3.2-sol8-sparc-local.gz (94086730 bytes).
SRC: ..
SRC: .
SRC: .ABOR
DST: 426 Transfer aborted. Data connection closed.
DST: 226 Abort successful
SRC: PORT 68,84,6,72,128,85
DST: 200 PORT command successful.
SRC: TYPE A
DST: 200 Type set to A.
SRC: NLST gcc_small*
DST: 150 Opening ASCII mode data connection for file list.
DST: 226 Transfer complete.
SRC: TYPE I
DST: 200 Type set to I.
SRC: PORT 68,84,6,72,128,86
DST: 200 PORT command successful.
SRC: RETR gcc_small-3.3.2-sol8-sparc-local.gz
DST: 150 Opening BINARY mode data connection for
gcc_small-3.3.2-sol8-sparc-local.gz (20127494 bytes).
DST: 226 Transfer complete.
SRC: QUIT
DST: 221-You have transferred 20807430 bytes in 1 files.
DST: 221-Total traffic for this session was 20830947
bytes in 6 transfers.
DST: 221-Thank you for using the FTP service on
ftp.sunfreeware.com.
DST: 221 Goodbye.
The bold entry corresponds to the FTP data transfer. We know this because the PORT 68,84,6,72,128,81 instruction from SRC, or the FTP client, tells the FTP server the port from which the client will accept a data connection. The first four numbers are the client's IP address: 68.84.6.72. The second two numbers are a representation of a certain TCP port. To translate 128,81 into a recognizable TCP port, multiply the first number by 256 and add it to the second. Therefore, (128 × 256) + 81 = 32849. Port 32849 TCP was the destination port on the FTP client 68.84.6.72, which accepted a connection from source port 20 TCP on 66.193.208.66.
If we take a close look at the session data shown in Figure 16.4, we see traffic from 68.84.6.72 to port 80 TCP (HTTP) on 66.193.208.66. As shown in the FTP control transcript, 66.193.208.66 is ftp.sunfreeware.com, but it's also www.sunfreeware.com. Apparently our user browsed to www.sunfreeware.com, found the desired Solaris software, and then downloaded it from ftp.sunfreeware.com.
Notice it took the user three times to get what he or she wanted. The first time the FTP client defaulted to using ASCII mode, which will not properly retrieve a binary archive. (ASCII is the default mode for Windows and Solaris FTP clients.) When the user realized what was happening, he or she aborted the file transfer, as shown in this excerpt from the earlier FTP control transcript.
SRC: RETR gcc-3.3.2-sol8-sparc-local.gz
DST: 150 Opening ASCII mode data connection for
gcc-3.3.2-sol8-sparc-local.gz (94086730 bytes).
SRC: ..
SRC: .
SRC: .ABOR
Next, the user changed to binary mode but aborted the transfer after realizing he or she didn't need all of the functionality in the selected GCC compiler archive.
SRC: RETR gcc-3.3.2-sol8-sparc-local.gz
DST: 150 Opening BINARY mode data connection for
gcc-3.3.2-sol8-sparc-local.gz (94086730 bytes).
SRC: ..
SRC: .
SRC: .ABOR
The final transcript excerpt shows a binary transfer for the gcc_small package, which offers a subset of the full package. It's 74MB smaller and therefore a quicker download.
SRC: RETR gcc_small-3.3.2-sol8-sparc-local.gz
DST: 150 Opening BINARY mode data connection for
gcc_small-3.3.2-sol8-sparc-local.gz (20127494 bytes).
DST: 226 Transfer complete.
This case started with a “Truncated Tcp Options” alert and ended with a look at FTP command and data transfer sessions. Let's move now to a more suspicious traffic trace.
SCAN FIN
One day while monitoring Sguil, we notice a slew of “SCAN FIN” alerts. Highlighting one at random, we find that the host name resolves to a machine in the wanadoo.fr domain (see Figure 16.5). This domain has often been associated with odd traffic.
Figure 16.5. SCAN FIN alerts in Sguil
The packet itself is simple. The source IP is 81.53.107.33. It contains a single FIN and no other TCP flags. Richard Stevens of TCP/IP Illustrated 2 fame wouldn't like that at all; there's supposed to be an ACK with any FIN. To get more information on this sort of alert, we press the www.snort.org button to get the Snort team's documentation for this rule, shown in Figure 16.6.
Figure 16.6. Snort.org documentation for the SCAN FIN alert
This sounds pretty scary. The rule documentation talks of bypassing firewalls, and the impact involves releasing information on “firewall rulesets, open/closed ports, ACLs, and possibly even OS type.” We remember reading that one of Nmap's “stealth” modes offers FIN scans.
To see all related events, we perform a Sguil event query for SCAN FIN and get shocking results (see Figure 16.7).
Figure 16.7. Sguil event query results for SCAN FIN
Sguil reports 38 rows; we must be under a “stealth coordinated attack!” Is it time to write a paper and call CNN? Hold on—let's take a closer look at this issue. Notice that the alert directly above the very first SCAN FIN alert entry in Figure 16.5 says P2P Outbound GNUTella client request. Sguil counted over 1,900 of these alerts, with the first one occurring slightly more than two minutes before the first SCAN FIN alert. Gnutella is a peer-to-peer file-sharing protocol.3 Could a user operating a Gnutella client have prompted the inbound FIN packets?
The first SCAN FIN alert appeared at 18:34:35 Universal Coordinated Time (UTC) and the last at 19:02:43. A query for all P2P Outbound GNUTella client request alerts shows the first was generated at 18:32:14 and the last at 20:10:29. This indicates that someone operated a Gnutella client for over an hour longer than the last SCAN FIN alert appeared.
Closer examination of all traffic to and from the source IP 81.53.107.33 on the highlighted SCAN FIN alert in Figure 16.5 yields a slightly bigger picture. We run Tcpdump using the –S flag to show absolute TCP sequence numbers for each packet. The timestamps are in Eastern Standard Time (EST), which at the time of capture was five hours earlier than UTC. Sguil generates alerts in UTC, which is why the SCAN FIN alert from 81.53.107.33 has a timestamp of 18:38.
1. 13:38:27.687088 81.53.107.33.63706 > 68.84.6.72.23346:
S 3490649715:3490649715(0) win 32768
<mss 1452,nop,wscale 0,nop,nop,timestamp 5291453 0> (DF)
2. 13:38:27.688686 68.84.6.72.1116 > 81.53.107.33.63706:
R 0:0(0) ack 3490649716 win 0
3. 13:38:29.397638 81.53.107.33.63706 > 68.84.6.72.23346:
S 3490649715:3490649715(0) win 32768
<mss 1452,nop,wscale 0,nop,nop,timestamp 5291458 0> (DF)
4. 13:38:29.399045 68.84.6.72.1116 > 81.53.107.33.63706:
R 0:0(0) ack 3490649716 win 0
5. 13:38:32.249534 81.53.107.33.63706 > 68.84.6.72.23346:
S 3490649715:3490649715(0) win 32768
<mss 1452,nop,wscale 0,nop,nop,timestamp 5291464 0> (DF)
6. 13:38:32.251222 68.84.6.72.1116 > 81.53.107.33.63706:
R 0:0(0) ack 3490649716 win 0
7. 13:38:32.261937 81.53.107.33.63706 > 68.84.6.72.23346:
F 3490649716:3490649716(0) win 32768
<nop,nop,timestamp 5291465 0> (DF)
8. 13:38:32.262821 68.84.6.72.1116 > 81.53.107.33.63706:
R 0:0(0) ack 3490649716 win 0
9. 13:38:32.270762 81.53.107.33.63706 > 68.84.6.72.23346:
F 3490649715:3490649715(0) win 32768
<nop,nop,timestamp 5291465 0> (DF)
10. 13:38:32.271700 68.84.6.72.1116 > 81.53.107.33.63706:
R 0:0(0) ack 3490649715 win 0
The two highlighted packets, numbers 7 and 9, caused the original SCAN FIN alerts. They were preceded by SYN packets (numbers 1, 3, and 5) from 81.53.107.33 to port 23346 TCP. Checking out the RST ACK responses in packets 2, 4, and 6, we notice that they come from port 1116 TCP, not 23346 TCP. They respond with an acceptable ACK value, however, indicating they are associated with the original SYN packets. This is weird but doesn't get us any closer to understanding this traffic.
We have a theory that a user operating a Gnutella client prompted other Gnutella users to try to connect to his or her system. Thus far our traffic analysis hasn't definitively linked the P2P Outbound GNUTella client request alerts with the SCAN FIN alerts. At this point an experiment seems justified. We visit http://www.gnucleus.com and download the latest Gnucleus peer-to-peer client. As we fire it up on a test system (see Figure 16.8), we carefully monitor for new Sguil alerts.
Figure 16.8. Starting Gnucleus

First we see a slew of P2P Outbound GNUTella client request alerts, but no SCAN FIN alerts. We decide to start searching for music; perhaps that might prompt the activity we expect. Since we like music in the public domain, we look for something by Pachelbel (see Figure 16.9).
Figure 16.9. Searching for Pachelbel in Gnucleus
After several minutes, new SCAN FIN alerts appear, as shown in Figure 16.10.
Figure 16.10. SCAN FIN alerts seen after starting Gnucleus
As you monitor connections inside Gnucleus, you see it trying to establish peering relationships with hundreds of systems per minute. The program is trying to fill its cache file of IP addresses and ports of systems sharing files with the Gnutella protocol (see Figure 16.11). We can see the cache file on a Windows system at C:Program FilesGnucleusDataGnuCache.net.
Figure 16.11. Gnutella filling its peer cache
The longer we run Gnucleus, the more SCAN FIN alerts appear. We've established the relationship between the alert and the program. When you participate in a peer-to-peer network, you should expect remote systems to try connecting to your workstation. That's how peer-to-peer protocols operate. Snort's P2P Outbound GNUTella client request alert is specifically designed to see local systems attempt outbound Gnutella connections. Its SCAN FIN alert sees the inbound FIN packets because they are outside of specifications. If they were FIN ACK packets, Snort wouldn't care. Because some users operate Gnutella clients that send FIN packets, Snort detects them and reports SCAN FIN alerts. There's no real “scanning” going on, unless you consider remote requests in a peer-to-peer network to be a form of reconnaissance. Searches at the Snort-Users mailing list show that others have seen similar activity.4
Chained Covert Channels
For our final scenario, we go straight to the traffic traces. Let's return to the network diagram we used in the previous chapter, displayed in Figure 15.1, but this time with a twist: the intruder now resides within the human resources department. We'll examine packet headers, content, and session data to unravel this new mystery. The theme of this chapter has been odd packet traces. This case is no exception. Put yourself in the shoes of a network-based detective. We received a tip that odd activity was afoot, and now we're looking for clues of malicious activity in network packet captures. The first trace comes from full content data collected on the VLAN0 interface of the firewall/gateway.
1. 02:30:39.265311 192.168.60.3 > 10.10.10.3:
icmp: echo request
2. 02:30:39.265543 10.10.10.3 > 192.168.60.3:
icmp: echo reply
3. 02:30:39.395221 192.168.60.3 > 10.10.10.3:
icmp: echo reply
4. 02:30:39.604236 10.10.10.3.2107 > 172.27.20.4.65457:
S 1110863494:1110863494(0)
win 16384 <mss 1460,nop,nop,sackOK> (DF)
5. 02:30:39.604501 172.27.20.4.65457 > 10.10.10.3.2107:
S 551928075:551928075(0) ack 1110863495
win 16384 <mss 1460>
6. 02:30:39.604684 10.10.10.3.2107 > 172.27.20.4.65457:
. ack 1 win 17520 (DF)
7. 02:30:39.604872 172.27.20.4.65457 > 10.10.10.3.2107:
. ack 1 win 17520
8. 02:30:39.605355 10.10.10.3.2107 > 172.27.20.4.65457:
P 1:82(81) ack 1 win 17520(DF)
Do you see something wrong with packets 1 through 3? If we assume packet 2 is the reply for packet 1, where is the echo request that corresponds to the reply in packet 3? Surely we're looking at a case of lost packets. Within milliseconds of packet 3, we see 10.10.10.3 initiate a connection to port 65457 TCP on 172.27.20.4. If we had the ability to check for open ports on 172.27.20.4 just prior to this event, we would not have found that port listening for new connections. Something weird is indeed happening.
Before we look at the three ICMP packets, it's important to know how normal ICMP traffic looks. Examine the following sample traces. For each of these I've set the ICMP portions in bold. Prior to the bold text are the Ethernet and IP headers.
=+=+=+=+=+=+=+=+=+=+=+=+=+=+=+=+=+=+=+=+=+=+=+=+=+=+=+=+=+=+=+=+
12/25-03:17:52.579402 0:0:0:0:0:0 -> 0:3:FE:E3:8:54 type:0x800
len:0x4A
68.84.6.72 -> 216.239.37.99 ICMP TTL:125 TOS:0x0 ID:37210
IpLen:20 DgmLen:60
Type:8 Code:0 ID:582 Seq:0 ECHO
00 03 FE E3 08 54 00 00 00 00 00 00 08 00 45 00 .....T........E.
00 3C 91 5A 00 00 7D 01 63 78 44 54 06 48 D8 EF .<.Z..}.cxDT.H..
25 63 08 00 4B 16 02 46 00 00 61 62 63 64 65 66 %c..K..F..abcdef
67 68 69 6A 6B 6C 6D 6E 6F 70 71 72 73 74 75 76 ghijklmnopqrstuv
77 61 62 63 64 65 66 67 68 69 wabcdefghi
=+=+=+=+=+=+=+=+=+=+=+=+=+=+=+=+=+=+=+=+=+=+=+=+=+=+=+=+=+=+=+=+
12/25-03:17:52.594655 0:0:0:0:0:0 -> 0:C:CE:4E:53:A0 type:0x800
len:0x4A
216.239.37.99 -> 68.84.6.72 ICMP TTL:48 TOS:0x0 ID:53161
IpLen:20 DgmLen:60
Type:0 Code:0 ID:582 Seq:0 ECHO REPLY
00 0C CE 4E 53 A0 00 00 00 00 00 00 08 00 45 00 ...NS.........E.
00 3C CF A9 00 00 30 01 72 29 D8 EF 25 63 44 54 .<....0.r)..%cDT
06 48 00 00 53 16 02 46 00 00 61 62 63 64 65 66 .H..S..F..abcdef
67 68 69 6A 6B 6C 6D 6E 6F 70 71 72 73 74 75 76 ghijklmnopqrstuv
77 61 62 63 64 65 66 67 68 69 wabcdefghi
=+=+=+=+=+=+=+=+=+=+=+=+=+=+=+=+=+=+=+=+=+=+=+=+=+=+=+=+=+=+=+=+
Notice how the client, 68.84.6.72, sends an ICMP echo with data resembling the alphabet. The server, 216.239.37.99, responds with the same data. This ICMP echo packet was created by a Windows XP system. The ICMP header begins in bold with 0x00. The 32 bytes of ICMP payload begin with 0x61, or ASCII letter a, and continue to the end of the packet. If you're curious what a UNIX system sends, review these two packets.
=+=+=+=+=+=+=+=+=+=+=+=+=+=+=+=+=+=+=+=+=+=+=+=+=+=+=+=+=+=+=+=+
12/25-03:29:14.349401 0:0:0:0:0:0 -> 0:3:FE:E3:8:54 type:0x800
len:0x62
68.84.6.71 -> 216.239.37.99 ICMP TTL:62 TOS:0x0 ID:56903
IpLen:20 DgmLen:84
Type:8 Code:0 ID:54078 Seq:0 ECHO
00 03 FE E3 08 54 00 00 00 00 00 00 08 00 45 00 .....T........E.
00 54 DE 47 00 00 3E 01 55 73 44 54 06 47 D8 EF .T.G..>.UsDT.H..
25 63 08 00 D3 8E D3 3E 00 00 DA 9F EA 3F 9C 4F %c.....>.....?.O
05 00 08 09 0A 0B 0C 0D 0E 0F 10 11 12 13 14 15 ................
16 17 18 19 1A 1B 1C 1D 1E 1F 20 21 22 23 24 25 .......... !"#$%
26 27 28 29 2A 2B 2C 2D 2E 2F 30 31 32 33 34 35 &'()*+,-./012345
36 37 67
=+=+=+=+=+=+=+=+=+=+=+=+=+=+=+=+=+=+=+=+=+=+=+=+=+=+=+=+=+=+=+=+
12/25-03:29:14.363044 0:0:0:0:0:0 -> 0:C:CE:4E:53:A0 type:0x800
len:0x62
216.239.37.99 -> 68.84.6.71 ICMP TTL:48 TOS:0x0 ID:64818
IpLen:20 DgmLen:84
Type:0 Code:0 ID:54078 Seq:0 ECHO REPLY
00 0C CE 4E 53 A0 00 00 00 00 00 00 08 00 45 00 ...NS.........E.
00 54 FD 32 00 00 30 01 44 88 D8 EF 25 63 44 54 .T.2..0.D...%cDT
06 47 00 00 DB 8E D3 3E 00 00 DA 9F EA 3F 9C 4F .H.....>.....?.O
05 00 08 09 0A 0B 0C 0D 0E 0F 10 11 12 13 14 15 ................
16 17 18 19 1A 1B 1C 1D 1E 1F 20 21 22 23 24 25 .......... !"#$%
26 27 28 29 2A 2B 2C 2D 2E 2F 30 31 32 33 34 35 &'()*+,-./012345
36 37 67
=+=+=+=+=+=+=+=+=+=+=+=+=+=+=+=+=+=+=+=+=+=+=+=+=+=+=+=+=+=+=+=+
It appears the UNIX system, 68.84.6.71, sent a different progression of characters, beginning with byte 0xDA and continuing through 0x37. The server at 216.239.37.99 faithfully replied with exactly the same ICMP payload data. Even ICMP caused by a worm system gets the same treatment, as shown next.
=+=+=+=+=+=+=+=+=+=+=+=+=+=+=+=+=+=+=+=+=+=+=+=+=+=+=+=+=+=+=+=+
12/25-03:17:34.819130 0:0:0:0:0:0 -> 0:C:CE:4E:53:A0 type:0x800
len:0x6A
68.85.173.215 -> 68.84.6.72 ICMP TTL:111 TOS:0x0 ID:63966
IpLen:20 DgmLen:92
Type:8 Code:0 ID:512 Seq:36124 ECHO
00 0C CE 4E 53 A0 00 00 00 00 00 00 08 00 45 00 ...NS.........E.
00 5C F9 DE 00 00 6F 01 14 FA 44 55 AD D7 44 54 .....o...DU..DT
06 48 08 00 13 8E 02 00 8D 1C AA AA AA AA AA AA .H..............
AA AA AA AA AA AA AA AA AA AA AA AA AA AA AA AA ................
AA AA AA AA AA AA AA AA AA AA AA AA AA AA AA AA ................
AA AA AA AA AA AA AA AA AA AA AA AA AA AA AA AA ................
AA AA AA AA AA AA AA AA AA AA ..........
=+=+=+=+=+=+=+=+=+=+=+=+=+=+=+=+=+=+=+=+=+=+=+=+=+=+=+=+=+=+=+=+
12/25-03:17:34.820426 0:0:0:0:0:0 -> 0:3:FE:E3:8:54 type:0x800
len:0x6A
68.84.6.72 -> 68.85.173.215 ICMP TTL:255 TOS:0x0 ID:63966
IpLen:20 DgmLen:92
Type:0 Code:0 ID:512 Seq:36124 ECHO REPLY
00 03 FE E3 08 54 00 00 00 00 00 00 08 00 45 00 .....T........E.
00 5C F9 DE 00 00 FF 01 84 F9 44 54 06 48 44 55 .........DT.HDU
AD D7 00 00 1B 8E 02 00 8D 1C AA AA AA AA AA AA ................
AA AA AA AA AA AA AA AA AA AA AA AA AA AA AA AA ................
AA AA AA AA AA AA AA AA AA AA AA AA AA AA AA AA ................
AA AA AA AA AA AA AA AA AA AA AA AA AA AA AA AA ................
AA AA AA AA AA AA AA AA AA AA ..........
=+=+=+=+=+=+=+=+=+=+=+=+=+=+=+=+=+=+=+=+=+=+=+=+=+=+=+=+=+=+=+=+
I don't need to bold all of the 0xAA bytes for you to recognize this as the work of Welchia or Nachi, the worm built to “fix” problems in Microsoft systems.5 With these patterns in mind, let's use Snort to take a closer look at the three malicious ICMP packets.
Remember that when we had only the headers to deal with, nothing seemed out of the ordinary—except the lack of an ICMP echo request to match the reply in packet 3. In each of the following traces, I've set in bold the ICMP portion of the packet.
=+=+=+=+=+=+=+=+=+=+=+=+=+=+=+=+=+=+=+=+=+=+=+=+=+=+=+=+=+=+=+=+
12/25-02:30:39.265311 0:2:B3:A:CD:5B -> 0:C0:4F:1C:10:2B
type:0x800 len:0x2A
192.168.60.3 -> 10.10.10.3 ICMP TTL:63 TOS:0x0 ID:7429
IpLen:20 DgmLen:28
Type:8 Code:0 ID:31272 Seq:0 ECHO
00 C0 4F 1C 10 2B 00 02 B3 0A CD 5B 08 00 45 00 ..O..+.....[..E.
00 1C 1D 05 00 00 3F 01 4E 24 C0 A8 3C 03 0A 0A ......?.N$..<...
0A 03 08 00 7D D7 7A 28 00 00 ....}.z(..
=+=+=+=+=+=+=+=+=+=+=+=+=+=+=+=+=+=+=+=+=+=+=+=+=+=+=+=+=+=+=+=+
12/25-02:30:39.265543 0:C0:4F:1C:10:2B -> 0:2:B3:A:CD:5B
type:0x800 len:0x3C
10.10.10.3 -> 192.168.60.3 ICMP TTL:128 TOS:0x0 ID:9424
IpLen:20 DgmLen:28
Type:0 Code:0 ID:31272 Seq:0 ECHO REPLY
00 02 B3 0A CD 5B 00 C0 4F 1C 10 2B 08 00 45 00 .....[..O..+..E.
00 1C 24 D0 00 00 80 01 05 59 0A 0A 0A 03 C0 A8 ..$......Y......
3C 03 00 00 85 D7 7A 28 00 00 00 00 00 00 00 00 <.....z(........
00 00 00 00 00 00 00 00 00 00 00 00 ............
=+=+=+=+=+=+=+=+=+=+=+=+=+=+=+=+=+=+=+=+=+=+=+=+=+=+=+=+=+=+=+=+
12/25-02:30:39.395221 0:2:B3:A:CD:5B -> 0:C0:4F:1C:10:2B
type:0x800 len:0x3E
192.168.60.3 -> 10.10.10.3 ICMP TTL:63 TOS:0x0 ID:8266
IpLen:20 DgmLen:48
Type:0 Code:0 ID:13341 Seq:0 ECHO REPLY
00 C0 4F 1C 10 2B 00 02 B3 0A CD 5B 08 00 45 00 ..O..+.....[..E.
00 30 20 4A 00 00 3F 01 4A CB C0 A8 3C 03 0A 0A .0 J..?.J...<...
0A 03 00 00 30 C5 34 1D 00 00 3F EA 91 CC 00 07 ....0.4...?.....
5A 5D E9 78 DB 3C 30 1D 09 FB 3E 5C 31 D8 Z].x.<0...>1.
=+=+=+=+=+=+=+=+=+=+=+=+=+=+=+=+=+=+=+=+=+=+=+=+=+=+=+=+=+=+=+=+
This does not look like normal ICMP traffic. The first packet has no ICMP payload whatsoever. It does have ICMP headers, but those end right before the ICMP payload should appear. The second packet has 18 bytes of ICMP data, all of which are 0x00 bytes. This is probably the result of 10.10.10.3 trying to compensate for the problems in the first packet. The final packet has 20 bytes of ICMP payload starting with 0x3F, but they follow no logical pattern whatsoever.
Whenever you see malformed traffic like this, it's important to consider the possibility of a covert channel. A covert channel is any form of communication that turns our understanding of protocols upside down. Using the Internet, you can theoretically pass any form of data you like above layer 3 (IP). As long as both sides of the conversation can transmit and receive data in an acceptable format for their own purposes, and no intermediary manipulates the session, anything can be passed over IP. Once you fundamentally break IP, you can't use the Internet. While it's possible to assign hidden meaning to various values in the IP header, like the IP identification field or IP options, you can't arbitrarily replace version 4 with version 8 and expect positive results across the WAN. (The LAN is another story, as long as both parties see the necessary traffic.)
The ICMP traffic we're examining was generated by a tool called Sadoor written by Claes M. Nyberg (CMN) of DarkLab.org. He was inspired by the Cd00r project by FX of Phenoelit.6 Sadoor allows you to define a set of packets that cause a server to react in a specified manner. In this case, the configuration file looked like the following lines.
# Echo request
keypkt {
ip {
daddr = 10.10.10.3;
saddr = 192.168.60.3;
icmp {
type = 8;
}
}
}
# Command packet
cmdpkt {
ip {
daddr = 10.10.10.3;
saddr = 192.168.60.3;
icmp {
type = 0;
}
}
}
Admittedly, this is a fairly lame configuration file. It uses an ICMP echo request (type 8) from 192.168.60.3 to 10.10.10.3 to signal the Sadoor server, and an ICMP echo reply (type 0) from 192.168.60.3 to 10.10.10.3 to signal a command session. This explains packets 1 and 3, which were generated by the Sadoor client. Packet 2 was a legitimate response from 10.10.10.3 to the echo request of packet 1.
What's fascinating about this tool is that 192.168.60.3 had nothing to do with this conversation. In fact, a completely separate machine sent the packets. If you guessed 172.27.20.4, you're correct. The TCP segments that followed the three ICMP packets begin with a SYN from 10.10.10.3 to 172.27.20.4. Essentially, Sadoor knew to send back a command shell to 172.27.20.4 when it received the proper sequence of ICMP traffic. The TCP session to port 65457 TCP on 172.27.20.4 is this command shell. Furthermore, everyone using Sadoor is free to be as creative as they like in designing the proper activation sequence. I chose a simple one to conserve ink. Figure 16.12 shows the Sadoor server running on Windows.
Figure 16.12. Sadoor server configuration
Now that we know what the ICMP session means, we can examine the contents of the TCP session from 10.10.10.3 to 172.27.20.4. We can reconstruct it by using Tcpflow. For readability, only the source address and port are shown here.
010.010.010.003.02107: ..V3.....Kr`...,...l........+......
172.027.020.004.65457: 9.T.Yy......-
010.010.010.003.02107: ......."H...v...o3..>.
010.010.010.003.02107: P.........U..S.4.xv..
172.027.020.004.65457: O
172.027.020.004.65457: .Czn
010.010.010.003.02107: .8...k
172.027.020.004.65457: *
172.027.020.004.65457: ..T..D.
010.010.010.003.02107: ;.C2....
There's not a lot to see. Apparently it is encrypted by default, so we can know only that a conversation took place between these two parties. Rather than poring through the details of packets we can't read, it's a good time to review any relevant session data captured on VLAN0.
1. 02:30:39 icmp 192.168.60.3 -> 10.10.10.3 ECR
2. 02:30:39 icmp 192.168.60.3 <-> 10.10.10.3 ECO
3. 02:30:39 tcp 10.10.10.3.2107 -> 172.27.20.4.65457 EST
4. 02:31:08 tcp 10.10.10.3.2108 -> 192.168.60.3.10029 EST
5. 02:31:40 tcp 10.10.10.3.2107 -> 172.27.20.4.65457 EST
“Sessions” 1 and 2 were caused by the three ICMP packets just discussed. Sessions 3 and 5 are the encrypted Sadoor conversation between 10.10.10.3 and 172.27.20.4. Session 4 is the next candidate for analysis. It looks like the intruder jumped from 10.10.10.3 to 192.168.60.3, a host in the DMZ. The Tcpflow data for this session is extremely valuable. The most useful portions are set in bold here.
010.010.010.003.02108: A1e404b404349f11801f90a06fe09c1//
192.168.060.003.10029: sh: no job control in this shell
sh-2.05b$
010.010.010.003.02108: w
010.010.010.003.02108: hoami
192.168.060.003.10029: richard
192.168.060.003.10029: sh-2.05b$
010.010.010.003.02108: n
010.010.010.003.02108: c -v 192.168.60.5 2003
192.168.060.003.10029: oates.taosecurity.com [192.168.60.5]
2003 (cfinger) open
010.010.010.003.02108: w
010.010.010.003.02108: hoami
192.168.060.003.10029: root
010.010.010.003.02108: p
010.010.010.003.02108: wd
192.168.060.003.10029: /usr/local/src
010.010.010.003.02108: c
010.010.010.003.02108: d /root
010.010.010.003.02108: l
010.010.010.003.02108: s
192.168.060.003.10029: synk4
010.010.010.003.02108: .
010.010.010.003.02108: /synk4
192.168.060.003.10029: Usage: ./synk4 srcaddr dstaddr low high
If srcaddr is 0, random addresses will be used
010.010.010.003.02108: .
010.010.010.003.02108: /synk4 0 192.168.40.1 1 65535
Because some packets contain only single characters, like the bolded n, we have to be creative and match them with packets that follow, like the packet beginning with c -v. The first bolded characters are nc –v 192.168.60.5 2003. These indicate the intruder connected from 192.168.60.3 to 192.168.60.5, another host in the DMZ. The command nc shows that the intruder used Netcat.7 Because of our vantage point, however, we see this activity from the perspective of 10.10.10.3 and 192.168.60.3. So, once the intruder successfully connects to 192.168.60.5, the session will still appear as if the intruder is on 192.168.60.3. The next set of traces, captured from a different vantage point, will clarify this point.
We don't know from this traffic how the intruder connected from 10.10.10.3 to 192.168.60.3. As the person who created the traffic, I can say I used the Covert Channel Tunneling Tool (CCTT), written by Simon Castro.8 I selected this tool because it allowed me to jump from a Windows platform (10.10.10.3) to a UNIX system (192.168.60.3). It offers an incredible amount of customization, and my use of it barely scratched the surface of its capabilities.
Before discussing what the last boldface line of the session means, let's switch monitoring perspectives. In addition to sniffing on the VLAN0 interface, we also collected traffic on the firewall/gateway's DMZ interface. Argus is a good way to get a quick summary of the traffic.
1. 02:30:18 icmp 10.10.10.3 -> 192.168.60.3 ECR
2. 02:30:47 tcp 10.10.10.3.2108 -> 192.168.60.3.10029 EST
3. 02:31:35 tcp 184.85.191.144.1379 -> 192.168.40.1.12 TIM
4. 02:31:35 tcp 121.186.122.245.1379 -> 192.168.40.1.13 TIM
5. 02:31:35 tcp 36.194.41.21.1379 -> 192.168.40.1.1 TIM
6. 02:31:35 tcp 50.63.14.13.1379 -> 192.168.40.1.2 TIM
7. 02:31:35 tcp 61.84.95.87.1379 -> 192.168.40.1.3 TIM
8. 02:31:35 tcp 39.86.220.14.1379 -> 192.168.40.1.15 TIM
9. 02:31:35 tcp 89.22.230.82.1379 -> 192.168.40.1.16 TIM
10. 02:31:35 tcp 132.35.232.193.1379 -> 192.168.40.1.17 TIM
11. 02:31:35 tcp 222.122.239.158.1379 -> 192.168.40.1.18 TIM
12. 02:31:35 tcp 68.23.197.191.1379 -> 192.168.40.1.19 TIM
13. 02:31:35 tcp 211.116.218.103.1379 -> 192.168.40.1.20 TIM
14. 02:31:06 tcp 192.168.60.3.32871 -> 192.168.60.5.2003 EST
15. 02:31:36 tcp 145.142.249.109.1379 -> 192.168.40.1.21 TIM
...truncated...
“Session” 1 is the second ICMP packet seen earlier; it's a legitimate echo reply to the forged ICMP echo request sent from 172.27.20.4 using spoofed source address 192.168.60.3. Server 10.10.10.3 can't tell that the source address was spoofed, so it replies to the system it thinks sent the ICMP echo request: 192.168.60.3. When 196.168.60.3 receives it, it quietly accepts and sends no reply. ICMP messages should not generate ICMP errors unless in certain circumstances, and this is not one of them.
Record 2 is the session we just investigated from 10.10.10.3 to 192.168.60.3. Record 14, which due to Argus's timeout values appears later than the earlier records, confirms the intruder's jump from 192.168.60.3 to 192.168.60.5.9 By sniffing on the DMZ interface, we can see that the conversation between the two servers has the same content but reflects the true systems involved. Here I again show only the source IP and port.
192.168.060.003.32871: w
192.168.060.003.32871: hoami
192.168.060.005.02003: root
192.168.060.003.32871: p
192.168.060.003.32871: wd
192.168.060.005.02003: /usr/local/src
192.168.060.003.32871: c
192.168.060.003.32871: d /root
192.168.060.003.32871: l
192.168.060.003.32871: s
192.168.060.005.02003: synk4
192.168.060.003.32871: .
192.168.060.003.32871: /synk4
192.168.060.005.02003: Usage: ./synk4 srcaddr dstaddr low high
If srcaddr is 0, random addresses will be used
192.168.060.003.32871: .
192.168.060.003.32871: /synk4 0 192.168.40.1 1 65535
Now we can discuss the ./synk4 command, which is the cause of session records 3 to 13 and from 15 onward. Synk4 is a SYN flooding program that runs on UNIX systems. It became famous for causing a certain community of intrusion detection researchers to blame the “fallout” from its use for “coordinated attacks and probes.” By “fallout” I mean the responses systems have to being attacked by Synk4. Because we collected traffic while the SYN flooding tool was fired at 192.168.40.1, we can analyze how it works.
From the usage statement helpfully displayed during the captured session, we read that using a 0 as the first argument tells Synk4 to choose random source IP addresses for its SYN flood. The various addresses in records 3 to 13 and 15 on confirm this fact. A closer look at the individual packets is illuminating.
02:31:35.618603 36.194.41.21.1379 > 192.168.40.1.1:
S 674719801:674719801(0) win 65535
02:31:35.635211 50.63.14.13.1379 > 192.168.40.1.2:
S 674719801:674719801(0) win 65535
02:31:35.655193 61.84.95.87.1379 > 192.168.40.1.3:
S 674719801:674719801(0) win 65535
02:31:35.675198 131.124.207.148.1379 > 192.168.40.1.4:
S 674719801:674719801(0) win 65535
02:31:35.695205 36.160.166.251.1379 > 192.168.40.1.5:
S 674719801:674719801(0) win 65535
02:31:35.715204 222.201.216.0.1379 > 192.168.40.1.6:
S 674719801:674719801(0) win 65535
The value set in bold is the TCP initial sequence number, or ISN. It's set to a constant by this statement in the synk4.c source code:
#define SEQ 0x28376839
By using a calculator we can convert this to its decimal value of 674,719,801, which is what appears in every TCP segment created by a stock version of Synk4.10
It appears that various ports on 192.168.40.1 are being hit by these SYN packets. Because the intruder choose 1 65535 as his or her range, every TCP port on 192.168.40.1 will be SYN flooded. This is not the most effective use of the intruder's firepower, but how is the victim system responding? For that we need to look at the interface that faces the Internet. As far as 192.168.40.1 is concerned, it needs to respond to the legitimate owners of each IP address. They are all found on the Internet, so that's where the responses to the SYN ACK packets are found.
02:31:56.783146 192.168.40.1.1 > 36.194.41.21.1379:
R 0:0(0) ack 674719802 win 0
02:31:56.784238 192.168.40.2 > 192.168.40.1:
icmp: host 36.194.41.21 unreachable
02:31:56.799725 192.168.40.1.2 > 50.63.14.13.1379:
R 0:0(0) ack 674719802 win 0
02:31:56.819712 192.168.40.1.3 > 61.84.95.87.1379:
R 0:0(0) ack 674719802 win 0
02:31:56.839713 192.168.40.1.4 > 131.124.207.148.1379:
R 0:0(0) ack 674719802 win 0
02:31:56.859727 192.168.40.1.5 > 36.160.166.251.1379:
R 0:0(0) ack 674719802 win 0
02:31:56.879724 192.168.40.1.6 > 222.201.216.0.1379:
R 0:0(0) ack 674719802 win 0
Each of the RST ACK packets is 192.168.40.1's reply to the SYN flood. Each one is sent out to the Internet, where it will be received by the legitimate owners of the various destination IPs. If one or more of their IPs is spoofed as a source IP address by Synk4, they will see multiple RST ACK packets from 192.168.40.1. They might in fact think 192.168.40.1 is conducting some sort of “stealth attack” against their network. If multiple victims are being SYN flooded by numerous perpetrators, and Synk4 chooses to spoof certain IP addresses more than others, then the owners of those spoofed IP addresses will think they are under a “coordinated stealth attack.”11
We've only talked about RST ACK segments so far. Our very short trace showed SYN segments to ports 1 through 6 TCP. If port 13 TCP is listening, for example, it will reply with a SYN ACK; only closed ports respond to a SYN with a RST ACK. These SYN ACKs are the basis for so-called SYN ACK scans, just as RST ACKs prompted some to (mis)name them “reset scans.”
Keep in mind that this is not a “first contact” intrusion scenario. All of the various back doors that implemented the covert channels had to already by set up by the intruder. If this is the first sign of any malicious traffic, the monitoring operation has a serious problem. Analyzing these traces showed four systems to be compromised.
- 172.27.20.4, the original source of the activity, operated the Sadoor client.
- 10.10.10.3 is running the Sadoor server and has a CCTT client available.
- 192.168.60.3 is running the CCTT server and has a Netcat client available.
- 192.168.60.5 is running a Netcat listener offering a root shell, plus Synk4 for denial-of-service attacks.
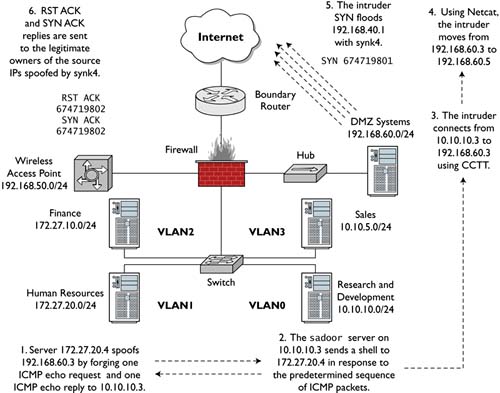
Figure 16.13 summarizes our findings. It all started with noticing an extra ICMP echo reply!
Figure 16.13. Covert channel scenario summary
Conclusion
This chapter revolved around odd packets. We started with an investigation of Truncated Tcp Options alerts generated by Snort and found them to be caused by normal file transfer traffic. We then scrutinized SCAN FIN alerts and realized a user playing with a Gnutella client brought about these suspicious packets. We concluded the chapter by investigating malicious ICMP traffic, which led us on another wild goose chase around our small demonstration network.
With the conclusion of Part IV, our discussion of ways to help people who do NSM has come to a close. In Part V we concentrate on some of the tools and tactics intruders wield against us. The next chapter discusses sample tools intruders may use to attack NSM operations. The tools are presented as examples of the sorts of capabilities some intruders possess. By seeing these applications in action, analysts will be better prepared to recognize them when interpreting network traffic.