15. Harnessing the Power of Session Data
Of all the sources of NSM information, session data is the most useful. Session data quickly reduces millions of packets to summaries of conversations or flows. These conversations show who talked to whom, when, using what ports and protocols, for how long, and how much data was passed during the session. The content of the session is not captured unless full content monitoring is performed on one or more packets of the session.
Session data is the incident responder's best friend because it answers three out of the four most pressing questions a decision maker faces. Can you guess which one session data cannot answer?
- Are one or more servers definitely compromised?
- If one or more servers are compromised, what did we lose?
- Where else did the intruder go?
- Is the intruder back today?
If you realized that session data, due to its content-neutral methodology, couldn't help answer question 2, you're getting the hang of NSM. Session data could potentially reveal how much data was passed during a conversation by monitoring packet and byte counts, but only full content collection of unencrypted traffic definitively reveals what an intruder accessed. Session data can help answer the other three questions. It's not an exact science, but by playing the odds and making logical assumptions, you can make plenty of investigative progress.
The Session Scenario
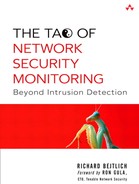
Let's put session data to work in the following scenario. Imagine we are working on the security team of a small company. We realize that an unauthorized system has successfully connected to our wireless access point. All we know at the outset is the IP address of the wireless system. Figure 15.1 shows the network diagram.
Figure 15.1. Wireless intrusion network diagram

Thankfully, we run Argus to collect session data on all interfaces of the FreeBSD-based firewall/gateway. We actually operate seven separate instances of Argus.
• The first watches traffic seen on the firewall interface connected to the wireless segment.
• The second watches the interface connected to the DMZ segment.
• The third, fourth, fifth, and sixth instances of Argus each watch one of the VLANs, numbered VLAN0 through VLAN3.
• The seventh watches traffic to and from the Internet.
By examining each set of Argus data, we can hopefully track any intruder's movement. Using session data is an example of performing traffic analysis. While the content of the conversations is not visible, the fact that a communication took place should be. Keep in mind that deployment choices (i.e., sniffing on the firewall) may affect the traffic available for examination.
Session Data from the Wireless Segment
We first look at the session data from the interface facing the wireless network. The first time a new IP address appears in the output shown here, it is set in bold.
Time Proto SrcAddr.Sport Dir DstAddr.Dport
SrcPkt Dstpkt SrcBytes DstBytes State
1. 18:22:43 tcp 192.168.50.2.10634 ?> 172.27.20.3.22
15 14 1418 1208 FIN
2. 18:22:56 tcp 192.168.50.2.10637 -> 172.27.20.3.22
29 22 3842 4064 FIN
3. 18:23:22 tcp 192.168.50.2.10639 -> 192.168.60.3.22
3039 2719 369110 1047369 EST
4. 18:24:22 tcp 192.168.50.2.10639 -> 192.168.60.3.22
8440 4981 838844 2742726 EST
5. 18:25:23 tcp 192.168.50.2.10639 -> 192.168.60.3.22
7494 3656 763472 1948248 EST
6. 18:26:23 tcp 192.168.50.2.10639 -> 192.168.60.3.22
379 576 39966 65308 EST
7. 18:27:23 tcp 192.168.50.2.10639 -> 192.168.60.3.22
205 307 21678 22754 EST
8. 18:28:26 tcp 192.168.50.2.10639 -> 192.168.60.3.22
8384 3712 825652 3006732 EST
9. 18:29:32 tcp 192.168.50.2.10639 -> 192.168.60.3.22
98 123 10268 9850 FIN
This set of session data shows three unique IP addresses:
- 192.168.50.2, the intruder's source IP
- 172.27.20.3, a system in VLAN1, the Human Resources segment
- 192.168.60.3, a system in the DMZ
Looking at session records 1 and 2, it appears the intruder connected to port 22 TCP on 172.27.20.3 but didn't spend much time on that system. In fact, due to the low packet counts (15 sent by the source, 14 by the destination in record 1; 29 sent by the source, 22 by the destination in record 2), it's possible the intruder wasn't able to successfully log in. Notice the source port on record 1 is 10634 TCP and 10637 TCP on record 2. These are two separate connections. All of the interactive connections you'll see in this case use port 22 TCP, indicating use of Secure Shell (SSH). Because SSH encrypts packet contents, full content data collection would be of no use. However, because session data is content neutral, encryption doesn't matter. The only way to foil session-based monitoring is to pass packets that would confuse the session data collection mechanism such that it misreads or ignores the intruder's traffic.
Session records 3 through 9 all describe the same conversation. We see the same socket used for all seven session records. The State column for 3 through 8 says EST, meaning “established.” Argus reports session status via these records and reports its final entry when it believes the session has closed. Record 9 shows FIN in the State column, meaning the conversation ended via a graceful close. Both sides presumably exchanged FIN ACK packets. Notice the large packet and byte counts for each record. The intruder either spent a lot of time on 192.168.60.3 or jumped from the system to others outside the eye of the Argus instance monitoring the DMZ interface. Figure 15.2 summarizes our findings in a picture.
Figure 15.2. Results of wireless session data investigation

Session Data from the DMZ Segment
Next we turn to the session data collected on the DMZ interface. If the intruder used 192.168.60.3 as a stepping-stone to other systems, it should be evident in these conversations.
Time Proto SrcAddr.Sport Dir DstAddr.Dport
SrcPkt Dstpkt SrcBytes DstBytes State
1. 18:23:22 tcp 192.168.50.2.10639 -> 192.168.60.3.22
3039 2719 369110 1047369 EST
2. 18:23:53 icmp 192.168.60.3 <-> 192.168.60.5
1 1 98 98 ECO
3. 18:23:54 icmp 192.168.60.3 <-> 192.168.60.5
1 1 98 98 ECO
4. 18:24:04 tcp 192.168.60.3.32785 -> 192.168.60.5.22
2351 2675 158372 934469 FIN
5. 18:24:22 tcp 192.168.50.2.10639 -> 192.168.60.3.22
8440 4981 838844 2742726 EST
6. 18:24:43 tcp 192.168.60.3.32786 -> 10.10.10.2.22
3629 19471 250224 4306763 EST
7. 18:25:23 tcp 192.168.50.2.10639 -> 192.168.60.3.22
7494 3656 763472 1948248 EST
8. 18:25:43 tcp 192.168.60.3.32786 -> 10.10.10.2.22
1102 2212 80700 1211560 EST
9. 18:26:23 tcp 192.168.50.2.10639 -> 192.168.60.3.22
379 576 39966 65308 EST
10. 18:26:43 tcp 192.168.60.3.32786 -> 10.10.10.2.22
332 209 28920 40466 EST
11. 18:27:23 tcp 192.168.50.2.10639 -> 192.168.60.3.22
205 307 21678 22754 EST
12. 18:27:50 tcp 192.168.60.3.32786 -> 10.10.10.2.22
552 828 42672 691864 EST
13. 18:28:26 tcp 192.168.50.2.10639 -> 192.168.60.3.22
8384 3712 825652 3006732 EST
14. 18:28:50 tcp 192.168.60.3.32786 -> 10.10.10.2.22
1003 1581 73382 1986458 FIN
15. 18:29:32 tcp 192.168.50.2.10639 -> 192.168.60.3.22
98 123 10268 9850 FIN
Immediately we notice two new IP addresses:
- 192.168.60.5, another system in the DMZ
- 10.10.10.2, a server in VLAN0, the Research and Development segment
Session record 1 shows the intruder's connection from his or her wireless system, 192.168.50.2, to the first stepping-stone in the DMZ, 192.168.60.3. Records 5, 7, 9, 11, 13, and 15 all show the same connection. The socket never changes, but it does close in record 15. Records 2 and 3 show the intruder sending ICMP echo packets to a new system, 192.168.60.5, also in the DMZ. Record 4 looks like a successful connection to 192.168.60.5, with a high packet and byte count indicating interactive access. Record 6 also appears to be a successful connection, this time to 10.10.10.2. Records 8, 10, 12, and 14 represent the same session, with record 14 showing it closing via exchange of FIN ACK packets.
Our list of probable compromised systems has expanded from two to four. How long has this analysis taken? It depends on the amount of traffic to analyze, but it can take anywhere from several minutes to several hours. Regardless, all of the work has been done in a centralized location, and none of the potential victims have yet been touched. There could be dozens or hundreds of systems in the DMZ and VLAN0. Using session data, we've identified at least four servers that deserve additional attention. Figure 15.3 shows our updated diagram.
Figure 15.3. Results of DMZ session data investigation

Session Data from the VLANs
Now we move to examine session data collected on the VLAN0 firewall interface. Luckily our firewall is a FreeBSD gateway that participates in the 802.1q protocol, passing traffic between the various VLANs.1
Time Proto SrcAddr.Sport Dir DstAddr.Dport
SrcPkt Dstpkt SrcBytes DstBytes State
1. 18:24:43 tcp 192.168.60.3.32786 -> 10.10.10.2.22
3629 19471 250224 4306763 EST
2. 18:25:43 tcp 192.168.60.3.32786 -> 10.10.10.2.22
1102 2212 80700 1211560 EST
3. 18:25:43 tcp 10.10.10.5.32782 -> 172.27.20.4.22
7503 14627 414274 2366192 EST
4. 18:26:43 tcp 192.168.60.3.32786 -> 10.10.10.2.22
332 209 28920 40466 EST
5. 18:26:43 tcp 10.10.10.5.32782 -> 172.27.20.4.22
397 407 28446 57274 EST
6. 18:28:16 tcp 172.27.20.4.41751 -> 10.10.10.3.22
1 1 54 54 RST
7. 18:28:16 tcp 172.27.20.4.41751 -> 10.10.10.3.1000
1 1 54 54 RST
8. 18:28:16 tcp 172.27.20.4.41751 -> 10.10.10.3.111
1 1 54 54 RST
9. 18:28:16 tcp 172.27.20.4.41762 -> 10.10.10.3.22
1 1 74 54 RST
10. 18:28:16 icmp 172.27.20.4 -> 10.10.10.3
1 0 42 0 ECO
11. 18:28:16 tcp 172.27.20.4.41771 ?> 10.10.10.3.80
1 1 54 54 RST
12. 18:28:16 tcp 172.27.20.4.41751 -> 10.10.10.3.139
2 1 108 58 RST
13. 18:28:16 tcp 172.27.20.4.41751 -> 10.10.10.3.445
2 1 108 58 RST
14. 18:28:16 tcp 172.27.20.4.41758 -> 10.10.10.3.139
2 1 128 74 RST
15. 18:28:16 tcp 172.27.20.4.41759 ?> 10.10.10.3.139
1 1 74 54 RST
16. 18:28:16 tcp 172.27.20.4.41760 ?> 10.10.10.3.139
2 1 128 74 RST
17. 18:28:16 tcp 172.27.20.4.41761 ?> 10.10.10.3.139
1 1 74 54 RST
18. 18:28:16 tcp 172.27.20.4.41763 ?> 10.10.10.3.22
1 1 74 54 RST
19. 18:28:16 tcp 172.27.20.4.41764 ?> 10.10.10.3.22
1 1 74 54 RST
20. 18:28:16 udp 172.27.20.4.41751 -> 10.10.10.3.22
1 0 342 0 TIM
21. 18:28:16 icmp 10.10.10.3 -> 172.27.20.4
1 0 70 0 URP
22. 18:28:17 tcp 172.27.20.4.41752 -> 10.10.10.3.139
2 1 128 74 RST
23. 18:28:17 tcp 172.27.20.4.41753 -> 10.10.10.3.139
2 1 128 74 RST
24. 18:28:18 tcp 172.27.20.4.41754 -> 10.10.10.3.139
2 1 128 74 RST
25. 18:28:18 tcp 172.27.20.4.41755 -> 10.10.10.3.139
2 1 128 74 RST
26. 18:28:18 tcp 172.27.20.4.41756 -> 10.10.10.3.139
2 1 128 74 RST
27. 18:28:18 tcp 172.27.20.4.41757 -> 10.10.10.3.139
2 1 128 74 RST
28. 18:27:50 tcp 10.10.10.5.32782 -> 172.27.20.4.22
1613 2868 93630 1026744 EST
29. 18:27:50 tcp 192.168.60.3.32786 -> 10.10.10.2.22
552 828 42672 691864 EST
30. 18:28:50 tcp 192.168.60.3.32786 -> 10.10.10.2.22
1003 1581 73382 1986458 FIN
31. 18:28:50 tcp 10.10.10.5.32782 -> 172.27.20.4.22
2939 5530 165650 2107500 FIN
We've found three new IP addresses:
- 10.10.10.5, another server in VLAN0, the Research and Development segment
- 172.27.20.4, another system in VLAN1, the Human Resources segment
- 10.10.10.3, a third server in VLAN0
There are several more session entries here than we saw on the wireless and DMZ interfaces, but not a lot is happening. Records 1, 2, 4, 29, and 30 all indicate the intruder's connection from the DMZ stepping-stone 192.168.60.3 to 10.10.10.2. Record 3 is a potentially worrisome entry. It shows a connection involving two new IPs; 10.10.10.5 connects to 172.27.20.4. Is this the intruder? If yes, how did he or she get from 10.10.10.2 to 10.10.10.5?
Remember that the sniffing is taking place on the firewall interface that sees VLAN0. The session data is not being collected on the switch that maintains VLAN0. If two hosts in VLAN0, say, 10.10.10.2 and 10.10.10.5, speak directly to each other through the switch, the traffic will never reach the firewall interface that listens on VLAN0. This is why the record of the intruder's connection from 10.10.10.2 to 10.10.10.5 is missing.
Is there an alternative sniffing method that could have caught this traffic? The answer is to deploy a dedicated sensor that watches a SPAN session for VLANs 0, 1, 2, and 3. This would see all traffic within each VLAN. Unfortunately, most SPAN sessions of this nature watch traffic into and out of switch ports. This is not a problem for traffic on the same VLAN. When systems speak to others outside their VLAN, say, from VLAN0 to VLAN1, then packets sniffed on the SPAN session are seen twice. For example, packets 1 and 2 below are the unique ICMP echo request and reply seen between two systems on the same VLAN. Each of packets 4, 6, 8, 10, and 12 is a duplicate of the packet directly preceding it. They weren't really duplicated on the LAN; they were seen twice only because of the nature of the SPAN session.
1. 20:03:29.965634 10.10.10.2 > 10.10.10.1:
icmp: echo request (DF)
2. 20:03:29.965756 10.10.10.1 > 10.10.10.2:
icmp: echo reply (DF)
3. 20:03:56.167998 10.10.10.2.57166 > 172.27.20.5.21:
S 3293706002:3293706002(0) win 32768
<mss 1460,wscale 0,nop> (DF)
4. 20:03:56.168005 10.10.10.2.57166 > 172.27.20.5.21:
S 3293706002:3293706002(0) win 32768
<mss 1460,wscale 0,nop> (DF)
5. 20:03:56.168247 172.27.20.5.21 > 10.10.10.2.57166:
S 3459716946:3459716946(0) ack 3293706003
win 57344 <mss 1460,nop,wscale 0> (DF)
6. 20:03:56.168253 172.27.20.5.21 > 10.10.10.2.57166:
S 3459716946:3459716946(0) ack 3293706003
win 57344 <mss 1460,nop,wscale 0> (DF)
7. :03:56.184736 10.10.10.2.57166 > 172.27.20.5.21:
. ack 1 win 32768 (DF)
8. 20:03:56.184741 10.10.10.2.57166 > 172.27.20.5.21:
. ack 1 win 32768 (DF)
9. 20:03:56.209969 172.27.20.5.21 > 10.10.10.2.57166:
P 1:64(63) ack 1 win 58400 (DF) [tos 0x10]
10. 20:03:56.209975 172.27.20.5.21 > 10.10.10.2.57166:
P 1:64(63) ack 1 win 58400 (DF) [tos 0x10]
11. 20:03:56.274678 10.10.10.2.57166 > 172.27.20.5.21:
. ack 64 win 32768 (DF)
12. 20:03:56.274800 10.10.10.2.57166 > 172.27.20.5.21:
. ack 64 win 32768 (DF)
Is there a way to solve this problem of duplicates? Yes, although it can limit the amount of traffic seen in other cases. Suffice it to say that for the scenario at hand, we are limited by the deployment choices made by the security analysts who set up Argus on the firewall. As in all NSM-based incident responses, something is better than nothing. Nearly all of the commercial incident response cases I've worked had nothing remotely close to this sort of capability until I installed it, so we're thankful our security administrator took these steps at least!
When we last reviewed our session data from the VLAN0 interface, we saw a connection from 10.10.10.5 to 172.27.20.4. Records 5, 28, and 31 are continuations of that same session. We can guess the intruder jumped from 10.10.10.3 to 10.10.10.5, but we didn't see it. What happens next confirms our suspicion that record 3 was indeed caused by the intruder.
Records 6 through 27 indicate reconnaissance from 172.27.20.4 to 10.10.10.3. It appears the intruder scanned ports 22, 111, 139, 445, and 1000 TCP. Sessions 10 and 11 are probably an Nmap ICMP ping and TCP “ping” (really a single ACK packet to port 80 TCP). Don't be confused by the State column in session 11 and think that 172.27.20.4 sent a RST packet. On the contrary, whatever the intruder sent (probably an ACK packet) was met by a RST packet from 10.10.10.3. The State column indicates the status of the session at the time Argus makes its record. If it's an ongoing TCP session, the State column says EST. If the session closed gracefully, Argus records FIN. If the session was reset, Argus records RST.
Our updated network trace looks like Figure 15.4.
Figure 15.4. Results of VLAN0 session data investigation

We're in the home stretch now. Let's see what the VLAN1 Argus data can tell us. VLAN1 is where 172.27.20.4 resides.
Time Proto SrcAddr.Sport Dir DstAddr.Dport
SrcPkt Dstpkt SrcBytes DstBytes State
1. 18:22:43 tcp 192.168.50.2.10634 ?> 172.27.20.3.22
15 14 1418 1208 FIN
2. 18:22:56 tcp 192.168.50.2.10637 -> 172.27.20.3.22
29 22 3842 4064 FIN
3. 18:25:43 tcp 10.10.10.5.32782 -> 172.27.20.4.22
7503 14627 414274 2366192 EST
4. 18:26:06 tcp 172.27.20.4.65530 -> 204.152.184.75.21
72 51 5034 8582 EST
5. 18:26:18 tcp 172.27.20.4.65529 -> 204.152.184.75.55558
4 4 272 891 FIN
6. 18:26:23 tcp 172.27.20.4.65528 -> 204.152.184.75.55547
4 4 272 708 FIN
7. 18:26:30 tcp 172.27.20.4.65527 -> 204.152.184.75.55528
5 4 338 1681 FIN
8. 18:26:38 tcp 172.27.20.4.65526 -> 204.152.184.75.55505
4 4 272 1128 FIN
9. 18:26:41 tcp 172.27.20.4.65525 -> 204.152.184.75.55494
5 4 338 1941 FIN
10. 18:26:43 tcp 10.10.10.5.32782 -> 172.27.20.4.22
397 407 28446 57274 EST
11. 18:26:46 tcp 172.27.20.4.65524 -> 204.152.184.75.55480
7 5 470 3682 FIN
12. 18:26:49 tcp 172.27.20.4.65523 -> 204.152.184.75.55472
16 11 1064 13248 FIN
13. 18:26:53 tcp 172.27.20.4.65522 -> 204.152.184.75.55459
4 4 272 305 FIN
14. 18:26:58 tcp 172.27.20.4.65521 -> 204.152.184.75.55444
4 4 272 305 FIN
15. 18:27:07 tcp 172.27.20.4.65530 -> 204.152.184.75.21
15 12 1088 1321 FIN
16. 18:27:07 tcp 172.27.20.4.65520 -> 204.152.184.75.55418
4 4 272 305 FIN
17. 18:27:09 tcp 172.27.20.4.65519 -> 204.152.184.75.55412
178 177 11756 264229 FIN
18. 18:28:16 tcp 172.27.20.4.41751 -> 10.10.10.3.22
1 1 54 54 RST
19. 18:28:16 tcp 172.27.20.4.41751 -> 10.10.10.3.1000
1 1 54 54 RST
20. 18:28:16 tcp 172.27.20.4.41751 -> 10.10.10.3.111
1 1 54 54 RST
21. 18:28:16 tcp 172.27.20.4.41762 -> 10.10.10.3.22
1 1 74 54 RST
22. 18:28:16 icmp 172.27.20.4 -> 10.10.10.3
1 0 42 0 ECO
23. 18:28:16 tcp 172.27.20.4.41771 ?> 10.10.10.3.80
1 1 54 54 RST
24. 18:28:16 tcp 172.27.20.4.41751 -> 10.10.10.3.139
2 1 108 58 RST
25. 18:28:16 tcp 172.27.20.4.41751 -> 10.10.10.3.445
2 1 108 58 RST
26. 18:28:16 tcp 172.27.20.4.41758 -> 10.10.10.3.139
2 1 128 74 RST
27. 18:28:16 tcp 172.27.20.4.41759 ?> 10.10.10.3.139
1 1 74 54 RST
28. 18:28:16 tcp 172.27.20.4.41760 ?> 10.10.10.3.139
2 1 128 74 RST
29. 18:28:16 tcp 172.27.20.4.41761 ?> 10.10.10.3.139
1 1 74 54 RST
30. 18:28:16 tcp 172.27.20.4.41763 ?> 10.10.10.3.22
1 1 74 54 RST
31. 18:28:16 tcp 172.27.20.4.41764 ?> 10.10.10.3.22
1 1 74 54 RST
32. 18:28:16 udp 172.27.20.4.41751 -> 10.10.10.3.22
1 0 342 0 TIM
33. 18:28:16 icmp 10.10.10.3 -> 172.27.20.4
1 0 70 0 URP
34. 18:28:17 tcp 172.27.20.4.41752 -> 10.10.10.3.139
2 1 128 74 RST
35. 18:28:17 tcp 172.27.20.4.41753 -> 10.10.10.3.139
2 1 128 74 RST
36. 18:28:18 tcp 172.27.20.4.41754 -> 10.10.10.3.139
2 1 128 74 RST
37. 18:28:18 tcp 172.27.20.4.41755 -> 10.10.10.3.139
2 1 128 74 RST
38. 18:28:18 tcp 172.27.20.4.41756 -> 10.10.10.3.139
2 1 128 74 RST
39. 18:28:18 tcp 172.27.20.4.41757 -> 10.10.10.3.139
2 1 128 74 RST
40. 18:27:50 tcp 10.10.10.5.32782 -> 172.27.20.4.22
1613 2868 93630 1026744 EST
41. 18:28:50 tcp 10.10.10.5.32782 -> 172.27.20.4.22
2939 5530 165650 2107500 FIN
We find one new IP in this listing: 204.152.184.75, which resolves to ftp.netbsd.org.
You might recognize entries 1 and 2. Those are the same sessions we saw in the session data collected from the wireless interface. Records 3, 10, 40, and 41 all represent the intruder's connection from 10.10.10.5 to 172.27.20.4. We just saw these earlier in the VLAN0 data, and they are reproduced here because the intruder's activity stretched across VLAN0 where 10.10.10.5 lives to VLAN1 where 172.27.20.4 resides.
Records 4 through 9 and 11 through 17 are much more interesting. They show FTP traffic from to 172.27.20.4 to 204.152.184.75 (ftp.netbsd.org). Host, 172.27.20.4, is a NetBSD system, so perhaps the intruder is downloading a NetBSD application? Note that records 4 and 15 indicate FTP command channel to port 21 TCP. Records 5 through 9 and 11 through 17 are individual FTP passive data transfers. (If active FTP data transfer had occurred, we would have seen port 20 TCP in use.) If the intruder truly downloaded a NetBSD application, it's no surprise that in session record 18, about one minute after the close of the FTP data transfer in record 17, we see the beginning of the reconnaissance against 10.10.10.3 explained earlier.
The only new aspect of our intrusion diagram is the addition of the FTP transfer prior to the reconnaissance (see Figure 15.5). Inspecting session data from VLAN2 and VLAN3 yielded no activity to those segments. We know the intruder did not access the Finance or Sales systems.
Figure 15.5. Results of VLAN1 session data investigation
Session Data from the External Segment
All that's left to investigate is session data captured on the external interface. This is the interface that connects the LAN to the wired Internet.
Time Proto SrcAddr.Sport Dir DstAddr.Dport
SrcPkt Dstpkt SrcBytes DstBytes State
1. 18:26:06 tcp 172.27.20.4.65530 -> 204.152.184.75.21
72 51 5034 8582 EST
2. 18:26:18 tcp 172.27.20.4.65529 -> 204.152.184.75.55558
4 4 272 891 FIN
3. 18:26:23 tcp 172.27.20.4.65528 -> 204.152.184.75.55547
4 4 272 708 FIN
4. 18:26:30 tcp 172.27.20.4.65527 -> 204.152.184.75.55528
5 4 338 1681 FIN
5. 18:26:38 tcp 172.27.20.4.65526 -> 204.152.184.75.55505
4 4 272 1128 FIN
6. 18:26:41 tcp 172.27.20.4.65525 -> 204.152.184.75.55494
5 4 338 1941 FIN
7. 18:26:46 tcp 172.27.20.4.65524 -> 204.152.184.75.55480
7 5 470 3682 FIN
8. 18:26:49 tcp 172.27.20.4.65523 -> 204.152.184.75.55472
16 11 1064 13248 FIN
9. 18:26:53 tcp 172.27.20.4.65522 -> 204.152.184.75.55459
4 4 272 305 FIN
10. 18:26:58 tcp 172.27.20.4.65521 -> 204.152.184.75.55444
4 4 272 305 FIN
11. 18:27:07 tcp 172.27.20.4.65530 -> 204.152.184.75.21
15 12 1088 1321 FIN
12. 18:27:07 tcp 172.27.20.4.65520 -> 204.152.184.75.55418
4 4 272 305 FIN
13. 18:27:09 tcp 172.27.20.4.65519 -> 204.152.184.75.55412
178 177 11756 264229 FIN
All of these records are associated with the FTP transfer described earlier. This set of session data does not add anything to our investigation.
What do we know at this point? We can assume that the following systems are compromised:
• 192.168.60.3
• 192.168.60.5
• 10.10.10.2
• 10.10.10.5
• 172.27.20.4
By compromised we mean the intruder had the means to connect to port 22 TCP and interact with the operating system. We also know the following systems were targets:
• 172.27.20.3, because the intruder tried to connect to it initially from his or her own platform
• 10.10.10.3, because the intruder scanned it from 172.27.20.4
In a few hours (or in some cases, minutes) of work, we've scoped the extent of this intrusion. We never had to touch a single potential victim. Armed with this information, we can take one or more of the short-term incident containment steps mentioned in Chapter 11 and then proceed with full incident response.
Conclusion
In this case study we tracked an intruder's movements throughout a small network. Even though the intruder used SSH to make every connection, we tracked him or her throughout the enterprise. Simply knowing where the intruder had been was of immense value in our incident response scenario. We also recognized that deployment choices, such as where to sniff, play a role in network visibility.
Session data is incredibly powerful. Open source tools for collecting session data exist in many forms, and the necessary information can be collected from multiple platforms. As we saw in Chapter 7, analysts can collect flows from routers, dedicated sensors, or even new appliances. When asked what single form of data I would be most interested in collecting, I always pick session data. In fact, I run an instance of Argus on my firewall, even though I have a dedicated sensor collecting all sorts of NSM data. The Argus session data is my backup plan, should the sensor fail or be compromised. The next chapter drops down to the packet header level to dwell in the jungle of the packet monkey.