A. C++ Tools
In Chapter 1, “Creating a Basic Program,” we show you how to use tools like g++, Dev-C++, and Xcode to develop C++ applications. In this appendix we’ll cover a little bit more about these, as well as introduce other utilities and programs you may want to familiarize yourself with.
Dev-C++ for Windows
Dev-C++ is an open-source application available from Bloodshed Software (www.bloodshed.net). Not only is Dev-C++ free, but it runs nicely on any version of Windows since Windows 95 and requires a mere 32 MB of RAM.
Dev-C++ has a syntax-highlighting text editor and includes the required C++ compiler, letting you run the compiled applications directly from within Dev-C++. In short, if you’re developing C++ applications on Windows, you can’t go wrong with Dev-C++. The examples in this book were tested using Dev-C++ (on Windows XP).
The following sequences constitute a mini-“quickstart” guide to installing and customizing Dev-C++. Also be sure to check out the debugging section, later in this appendix, since the full version of Dev-C++ comes with the popular Gnu Debugger (GDB) installed.
Installing Dev-C++
- Download the latest version of Dev-C++ from www.bloodshed.net.
Be certain to download the full package that includes the compiler (Dev-C++ also comes in an executable-only version without a compiler).
- Double-click the downloaded installer in order to begin the installation process.
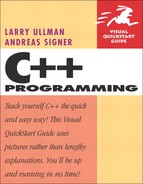
- Select the installer language and click OK (Figure A.1).
Figure A.1. Choose your default language.
- Read and agree to the terms of the license agreement.
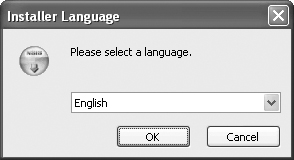
- Determine which components you want to install (Figure A.2) and then click Next.
Figure A.2. You can customize how much is installed to fit your needs (although we recommend you err on the side of installing too much).
Dev-C++ comes with a number of useful additions. If you have the space on your hard drive, you should go ahead and install them all. If you’d rather not (the full package takes up around 60 MB), then be certain to install the Mingw compiler system. If you’re not sure as to what a particular item is, put your mouse cursor over the item to view its description (see the figure).
- Choose a destination for the application.
You can accept the default—
C:Dev-Cpp—or go with the Windows norm and install it within theC:Program Filesdirectory. - Click Install to begin the process.
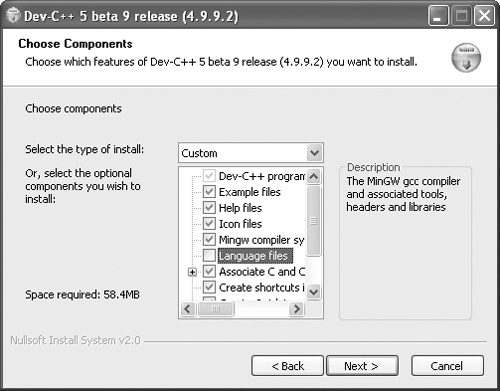
- If given the option (Figure A.3), determine whether the application should be installed for all of the computer’s users or not.
Figure A.3. Dev-C++ can be kept to yourself or shared with other users on your computer.
- Decide whether or not you want to start Dev-C++ now and click Finish.
Running Dev-C++ for the First Time
The first time you run the Dev-C++ application you’ll be given the chance to configure how it runs. Here’s what we recommend.
To configure Dev-C++:
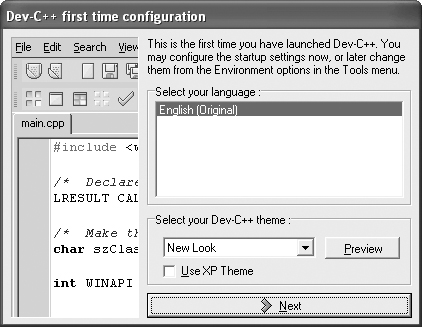
- Select your language and appearance (Figure A.4) and then click Next.
Figure A.4. Begin configuring Dev-C++ the first time you run it.
- Opt to use the information retrieval feature on the next page.
Dev-C++ can look at the available C++ header files to determine what functions, classes, and so on have been defined. By doing so, the program offers better code completion.
- Opt to create a cache for the code completion feature (Figure A.5) and click Next.
Figure A.5. If using code completion, the cache will speed up the feature’s responsiveness.
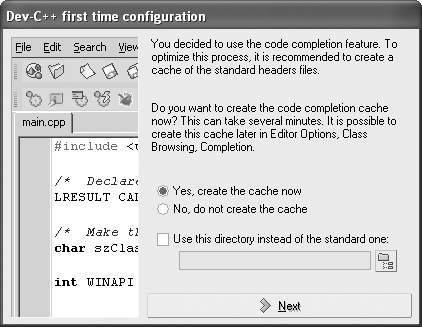
Dev-C++ has a great feature that will help you automatically complete blocks of code, like class or function calls. To enable this, Dev-C++ needs to build a cache of this information.
- On the next page, click OK to run Dev-C++.
Customizing Dev-C++
Once you have Dev-C++ up and running on your computer, you’ll want to set the preferences before using it too much. Specifically, we recommend the following instructions.
To customize Dev-C++:
- Create a directory for your C++ files.
The best option is to create a simply titled directory in the root of the hard drive, like
C:cpp. - Open Dev-C++, if it is not already.
- Select Tools > Compiler Options.
This will bring up the Compiler Options dialog.
- Click the Settings tab, and then click Linker.
- Select Yes for the Generate debugging information option (Figure A.6).
Figure A.6. In order to use the built-in debugger, you must have Dev-C++ generate debugging information.
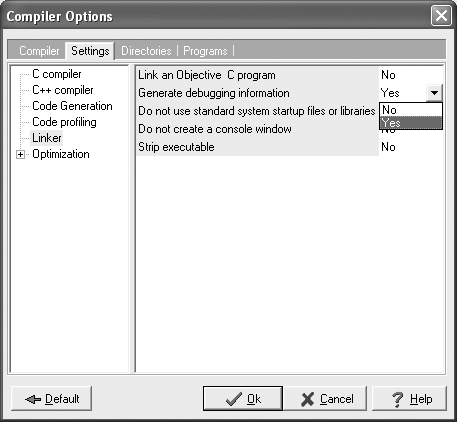
By doing this, you can use the debugging tools built into Dev-C++. It will make the size of the generated executable larger, though.
- Click Ok to exit the window.
- Select Tools > Environment Options.
Now we’ll tell the program where the default code directory should be.
- Click the Files & Directories tab.
- Set the User’s Default Directory (Figure A.7).
Figure A.7. Set your preferred directory (or directories) in the Environment Options dialog.

This should be the same directory you created in Step 1.
- Click the Ok button to exit.
 Tips
Tips
• Through the Dev-C++ Resource Site (http://bloodshed.net/dev/), you can download other packages, like GUI toolkits for creating graphical interfaces for your applications.
• In the Tools > Editor Options panel you can customize more aesthetic ways in which the program looks and behaves.
Xcode on Mac OS X
Not to go overboard, but we couldn’t be more pleased with Xcode. If you’re developing software on the Mac, it’s the only program to use (and no, we don’t work for Apple).
Xcode is part of a series of Developer Tools Apple releases with the operating system. If you have a set of Mac OS X discs, you should check for the Developer Tools CD to save yourself a large download. If you don’t already have a copy or if you want the latest version, Xcode is freely available from Apple’s Developer Connection (ADC) Web site (http://developer.apple.com/tools/download/). You’ll need to be an ADC member, but membership is free.
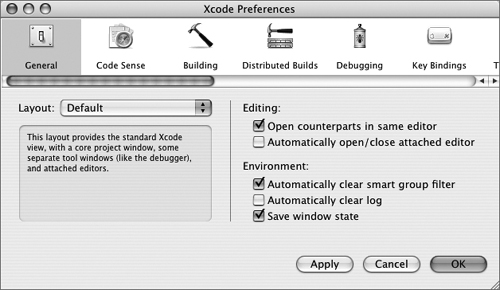
Installing the Developer Tools is a no-brainer—just double-click the installer and follow through the prompts. Once you’ve installed Xcode, you can customize it using the Preferences (select Xcode > Preferences; Figure A.8).
Figure A.8. Run through Xcode’s preferences to adjust how it behaves.
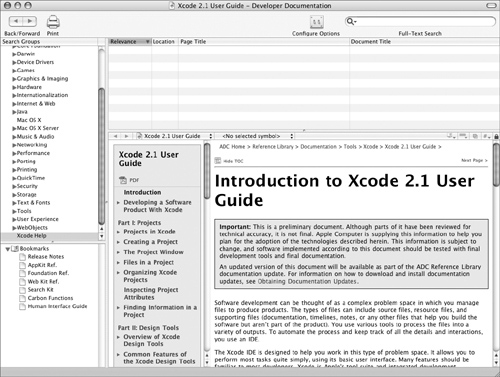
For help with using Xcode, check out the excellent documentation (Help > Xcode Help; Figure A.9). There is also plenty of documentation that can be installed along with the other Developer Tools and even more to be found on Apple’s Web site.
Figure A.9. Xcode comes with an impressive amount of documentation and help files.
Unix Tools
If your primary operating system is Unix (or a Unix derivative such as Linux), then learning C++ makes perfect sense. Large portions of Unix itself were written in C and C++, and it’s still a popular language for building Unix tools.
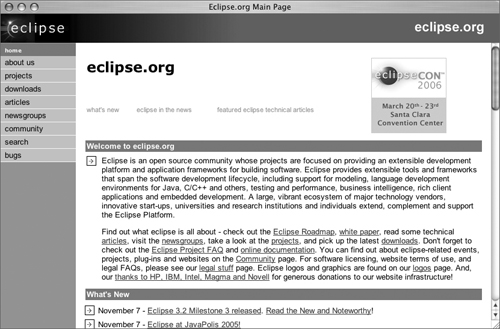
Unix people tend to be fanatical about their text editors (post a message to any newsgroup about emacs versus vi and watch the bullets fly), but there are worthy IDEs available too. Naturally, most of these are open source, such as Eclipse (www.eclipse.org, Figure A.10), KDevelop (www.kdevelop.org), and Anjuta DevStudio (http://anjuta.sourceforge.net).
Figure A.10. Eclipse is a very popular, open-source IDE for C++ and other languages. It runs on most operating systems.
If Eclipse, KDevelop, and Anjuta DevStudio aren’t to your liking (or if they aren’t available for your version of Unix), SourceForge (www.sf.net) has dozens upon dozens of IDEs for your consideration.
Debugging with GDB
Of the available tools for developing C++ applications, GDB (Gnu Debugger) is one of the more common. GDB is a command-line tool for C and C++, intended to help you find bugs in an application. It takes a while to learn how to make the most out of GDB, but if you do much C++ programming, doing so will pay off.
GDB will do the following:
• Show the source code of a file.
• Show the values of variables.
• Stop infinite loops.
• Demonstrate the logical progression through an application.
• Stop a program’s execution at set points.
• Walk through a program, instruction by instruction.
• Allow you to inspect a program’s state immediately after it crashes (to see what caused the crash).
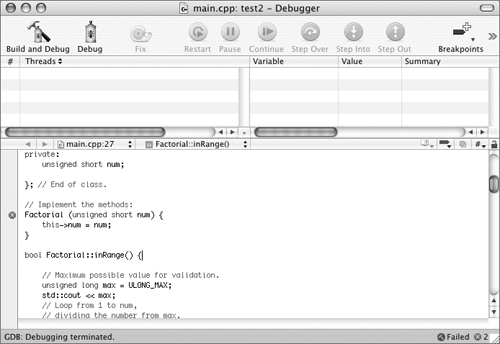
GDB is built into Dev-C++ and Xcode (Figure A.11) and is readily available on most variants of Unix. You can also download it and find out more information at www.gnu.org/software/gdb/gdb.html.
Figure A.11. Xcode’s debugging interface.
Showing you how to use GDB is beyond the scope of this book (it would require a chapter in itself), but if you do a search online, you’ll come across many good tutorials like www.cprogramming.com/gdbtutorial.html.
Tips
• The Insight Debugger (http://sources.redhat.com/insight/) is a graphical interface to GDB for Unix.
• DDD (Data Display Debugger, www.gnu.org/software/ddd/) is another popular graphical interface to GDB.