
CHAPTER 5
Site Assessment: Will Wind Power Work at Your Location?
Everyone knows that you do NOT place a solar panel in the shade, and a similar rule should be obvious for wind turbines. The following should be etched on every wind turbine and displayed conspicuously on every website: “For best results place me 30 feet above and 250 feet away (and avoid contact with migrating birds, bats, and nimbys).”
—KEVIN SHEA
This chapter provides a toolbox of methods and formulas to assess your site for wind power capacity, as well as social, economic, and environmental factors. Some math will be necessary, but we will attempt to be gentle. If you don’t think this is necessary, if efficiency and effectiveness are not your goals, you probably are just into a new Russian roulette model (don’t know when it will fire off), physics-defying, hot-rod wind turbine with the extra-sleek flaming blades. In that case, please ignore this chapter and move on to the appendix, “How to Sell Your Wind Crap on Craigslist1 and Handle Debt Into Your 70s.”
Before you do your assessment for wind energy, we hope you verified that your site has legal allowances (Figure 5-1). If you are not sure before you start, this chapter will still help you, but you might be looking in the wrong place. The easiest way to do this is to go to your local town building permit office and ask for all information on permits for wind turbines or appurtenant structures. You can also read Chapter 7 on permits or variances before staking your lot.

FIGURE 5-1 This 80 kW Zond wind turbine in Waverly, Iowa, was replaced with a bigger 900 kW turbine in 2001. Waverly Light and Power/DOE/NREL.
Get Prepared
We recommend that you find a quiet place to read. To maximize your efficiency of learning, we recommend reading it several times using the QR3 method—Question, Rush, Read, Review. First, create your questions that you want answered. Then rush through the chapter trying to answer those questions. After that, read it thoroughly. Finally, review the chapter one more time to confirm your comprehension.
If that wasn’t enough to show you how important assessing is, please note that the overview box is missing words. You can fill them out before or after you read the chapter. And if you read it now, we will throw in some homework for you at the end of the chapter. You will work in this chapter, but we guarantee you will also have ample opportunity for fun.
How to Save Time on This Chapter
Follow these simple rules:
General rule #1: Ensure you have good average wind speed in your region. This is the most important factor affecting success of a wind system, and early in this chapter you will learn what regions generally have good wind energy and will gain some observation methods to get you going. But if you find that your site has adequate average wind speed, not just gusts here and there, small wind turbines have a major advantage over large utility wind turbines in that you won’t need a serious preinstallation evaluation. You can begin to get an idea of your wind resource by checking your local weather history or global wind maps. And although some online services charge, here in the United States there is a quick, free way to evaluate your site. Go to the Choose Renewables website.
Resource

Choose Renewables www.chooserenewables.com
Simply type in your address, and you will get some idea if you may be a candidate, and you will get information on your incentives.
General rule #2: Avoid high air turbulence, which will slow your turbine down and damage it over time. Setting up a tower at least 30 feet above all obstacles within a 500-foot perimeter is a must (even more is usually better). Being on a flat open hilltop is usually ideal for optimum wind levels.
General rule #3: Make it real high. Beyond clearance, let us tell you the best solution: if possible, make your tower as high as you can afford. Balance this cost with cost for electric grid access and transmission, and social friction on visibility (Chapter 7). If you live near an airport, the Federal Aviation Administration (FAA) or other governing body usually has restrictions on towers higher than 200 feet, but other than that, today’s robust technology can sustain sufficient energy for your home if you place it on a high tower.
General rule #4: Don’t install a toy turbine. If you follow all three previous rules, you can now purchase a turbine that has a good track record to perform for many years without falling apart … or a turbine advertised with a “low wind cut-in speed,” which supposedly permits you to grab low energy speeds, yet tampers down when substantial energy is available to protect the system. If you want toys, that is okay; we love toys too. Just don’t put them in high winds, unless you like broken toys. And beware that toys probably will not generate meaningful amounts of electricity or pay for themselves.
The rest of this chapter deals with more specific scenarios and details about assessing your site.
Site Location Guidelines
Proper site selection is very important to the performance and longevity of your wind turbine. A poorly sited wind generator will probably bring nothing but poor performance, maintenance issues, higher costs, and frustration. The owners we interviewed who would fall into this class were unanimous in saying they wished they had taken more care during the siting process, and that they would not have built if they had known all the facts.
There are two basic requirements for a good wind generator site:
1. Good average wind speed. The single most important element to maximize performance of your wind system is average wind speed. For your wind generator to produce energy, the cut-in speed and the average wind speed at your site should be equal or close.
2. Low wind turbulence. The lower the turbulence, the more efficient the rotor, the less stress your wind generator will sustain, the more energy it will produce, and the longer it will last.
In order to correctly site and size a wind electric system, it is helpful to have the following information about your location:
• Average annual wind speed. As we showed in Chapter 3, a small increase in average wind speed results in a large increase in energy output of a wind generator. For example, an increase in wind speed of 10 percent (9 mph to 10 mph; 4 m/s to 4.5 m/s) results in roughly a 30 percent increase in power available. Therefore, the better the location, the better the performance. And almost universally, wind speeds increase with height. This chapter will cover various methods to determine average annual wind speed.
• Prevailing wind directions. Prevailing winds are technically winds that blow predominantly with the highest speed from a single general direction over a region. They are usually driven by global patterns. In general, low and high latitudes tend to have easterly prevailing winds, while the mid-latitudes tend to have westerly winds. Wind roses, covered later in this chapter, are tools used to determine the direction of the prevailing wind (Figure 5-2).

FIGURE 5-2 This wind rose shows the prevailing wind directions at LaGuardia Airport in New York City. Breeze Software/Wikimedia Commons.
• Topography. Although hills are better than valleys, there are also circumstances where the highest land available may not be the best place for your wind generator. High land may be awkward to get to, too far away from where you need the power, or may expose your wind generator to potentially damaging turbulent conditions.
• Barriers. Barriers (buildings, trees, etc.) produce wakes or eddies that may extend far downwind and high into the air. Such turbulence can rob your turbine of energy, or even damage it. The upcoming section on wind shear (first introduced in Chapter 3) will further cover effects and solutions of barriers.
• Surface roughness. As we mentioned in Chapter 3, the smoother the terrain, the less friction encountered by moving air, and the faster the wind speeds. We already introduced the wind shear exponent, but we’ll build on that later in this chapter and provide calculating tools.

Power Up! In order to prevent wind speed impedance:
What should your wind turbine not be near?
The ground, a roof, buildings, cliffs, foliage, large signs, plane routes (tee-hee), other wind turbines.
Basic Principles of Wind Resource Evaluation
We can’t stress it enough: wind resource evaluation is a critical element in projecting turbine performance at a given site. Here’s the relationship we covered in Chapter 3:
The energy available in a wind stream is proportional to the cube of its speed.
This means that doubling the wind speed (V) increases the available energy (E) by a factor of eight.
2V = P3
Of course, a wind resource is seldom a steady, consistent flow. But many sites definitely have better average wind speeds than others. In general, according to the American Wind Energy Association (AWEA), annual average wind speeds of 11 mph (5 m/s) are recommended for grid-connected applications. For off-grid uses like battery charging, water pumping, and monitoring devices, annual average wind speeds of 7 to 9 mph (3 to 4 m/s) may be adequate.
In addition to average wind speed, another useful measure is wind power density, which indicates how much energy is available to a wind turbine at a given site, measured in watts per square meter (W/m2). We shall expand on this concept, with more factors that can affect the annual energy production of your turbine.
Know Your (Wind) Class
In the United States, the National Renewable Energy Laboratory (NREL) classifies wind power density into seven ascending classes, which help give an idea of the feasibility of a location for wind power. Table 5-1 shows how the classes correspond to wind speed measurements at three standard heights, 33 feet (10 m), 100 feet (30 m) and 164 feet (50 m). As stated previously, wind speed generally increases with height above ground.

Given the current state of turbine technology, class 2 areas and above can be suitable for small wind projects.2 Class 1 areas are generally not okay for grid connection, but may supply supplemental energy, or make for conversations at your annual barbeque.
For countries that don’t recognize this classification system, it is easy enough to use the wind speed averages shown in the table to see the corresponding power class and density to get a general idea based on global wind maps.
Maps Are Not Gospel
Although wind experts recommend conducting a preliminary site assessment with wind maps, these maps are not particularly accurate for local sites. In fact, there are many cases in which maps are woefully inadequate, especially in suburban and urban terrain.3 Here are some points to keep in mind:
• If the height of the turbine is less than 33 feet (10 meters), which isn’t recommended, a correction will need to be made. At 5 meters, the wind speed will be roughly 10 to 20 percent lower.
• The table is more accurate for flat, open land than it is for rough terrain. If you have high surface roughness, revise the wind speeds down.
• The table does not include any local thermally driven winds, such as sea breezes or mountain/valley breezes. If these are present, add 0.5 to 1.0 m/s.
• If the site is on a hilltop, adjust the average wind speed up. If it is in a valley, don’t put a wind turbine there.
Wind Shear
Available wind maps or climate data may have brought you to an average wind speed at the height approximating your tower. But you will likely need to make adjustments based on hyper-local topography and wind shear. We introduced the notion of wind shear in Chapter 3, but we left room for a more comprehensive explanation in this chapter.
Anyone who has lost his or her hat from an unexpected gust on a city street has experienced wind shear. Wind shear simply refers to a large change in wind speed or direction over a short distance—either horizontal or vertical. Wind shear is closely related to turbulence, and is often the cause of it. It’s important to be aware of because wind shear can be a factor in estimating wind turbine energy production.4
There are many causes of wind shear, including thunderstorms, fronts, temperature inversions, and obstructions on the ground, such as mountains, buildings, trees, and even sailboats. We won’t get into the precise details, since this isn’t a book about the weather. The important thing to know is that one of the results of wind shear is that wind velocity varies with height above the Earth’s surface. As we’ve pointed out before, as the height increases, the wind speed usually increases. This results in vertical wind profiles like a multilayer cake moving across the Earth, each layer putting an increasing level of force on anything it strikes. (That layering is sometimes called the wind gradient.)
One small point: the increase in wind speed with height technically only holds true for the height above the effective ground level. That is, the wind rushing over amber waves of grain really sees the tops of the plants, not the soil on which they grow, as the effective ground level.5
So, since there are stratified wind speeds, your turbine may be receiving different wind power densities as the blades spin. The wind energy would probably be less nearest to the ground and more at the top of blade travel, and this does affect the turbine operation.6 Even low-level wind shear can bend parts of a turbine, changing the blade angle to something less efficient at harvesting energy. Such forces can also put a lot of stress on the machinery.7 The only consolation for small wind turbine owners is that these forces are going to be less than they are for large systems, where there is a greater distance between blade tips. (Although it’s also true that larger swept areas mean much more energy can be harvested from the wind.)
As we’ve suggested, wind shear also tends to result in greater air turbulence, which is characterized by eddies and randomized air flow. Mechanical turbulence is common near the ground, and forms as wind blows over or around obstructions. You can observe the same essential phenomenon easier in a rushing stream, where eddies that form in water make whitewater rafting exciting. Take that concept of bouncing around on a raft with swirls of water, and apply it to the invisible eddies that are oscillating your rotor. The faster the wind, the stronger the turbulence, just like the faster a moving stream, the stronger the eddies. Turbulence is one of the main reasons for failure in turbines. Don’t underestimate the power of the wind, just as you wouldn’t want to underestimate the power of moving water on a rafting expedition. Of course, to compensate for the extraordinary stress requires heavy-duty components, although that can reduce the performance. In the long run, it is better to find a way to mitigate wind shear.
Mitigating Wind Shear
When we often talk about obstructions, many people presume that they can be altered. However, it’s worth remembering that the main sources of wind shear result from large-scale jet streams, tropical atmospheric circulation patterns, cold-core low pressure systems, geologic features, El Niño or La Niña events, and so on.8 Unfortunately, these types of macro-effects are usually outside the range of your control.
However, there are a few things you can do to minimize wind shear locally:
1. Move the turbine. Knowing the cube factor effect of wind speed, sometimes moving the wind turbine a few meters up, away, or to the side of an obstacle, can make a substantial difference on performance. Many people like to have their turbine close to their home, but if the house is knocking out your wind, they make for a bad couple. It would be better if the turbine were matched with your dog’s house.
2. (Re)move the obstacle. Cut that tall grass or remove that wayward tree. We understand if you are a farmer with cash crops or a homeowner who enjoys your shady forest, but we can offer some compromises. If you rely on your plantings, consider selecting (or possibly replacing) tall choices with shorter-growing vegetables or dwarf fruit trees. They are abundant, and make for easy picking. For the tree huggers who can’t part with a forest view, select or replace your existing trees with dwarf deciduous trees (Figure 5-3). They can produce shade in summer, and when the leaves drop, the barren branches theoretically reduce the wind shear during the winter months, when the highest wind density typically occurs. If you can’t bring the height of the trees down, perhaps you have the ability to bring the level of the ground down by making terraces of your terrain, or even a valley. That way, even if the trees do grow, they would be lower than if on a plain. Or if you can opt to sacrifice some forest or field for a pond, you have reduced the wind shear coefficient to 0.1, while providing water for your plants, home for nature, and beauty for you.

FIGURE 5-3 If you must have trees near your turbine, choose dwarf varieties. The shorter the obstacles and the farther away from your tower, the better wind your generator will see. Kevin Shea.
Kevin lives on a wildlife reserve protected by the national government. If he cuts down a tree, it better not be more than seven inches in diameter or a threatened species. If he wanted to clear the area, he would need to arrange to replant with a significant number of timber trees to replace it. And so he selected trees that would meet his height limit while making a beautiful addition to the property.
Wind Shear Exponent

Tech Stuff As mentioned in Chapter 3, wind shear can be expressed as an exponent in calculations to fine-tune understanding of what wind power density is realistically available at your site. Specifically, wind shear exponent, α, factors in wind shear when determining how wind speed varies with height. One way of calculating this is from the following equation, described by German engineer Jens-Peter Molly in his book Windenergie (Muller, 1978):
α = 1/ln(z/z0)
where z0 is the surface roughness (e.g., forest, buildings, personal statue, etc.) length in meters, z is the reference height, and the ln is the natural logarithm that gives you the time needed to reach the aimed wind speed.
As Table 5-2 suggests, if the wind comes across a fallow crop field or body of water, you do not have to reach as high for greater wind speeds as you would in a forest or suburb, where obstructions tend to cause greater drag and turbulence. This fact is represented in the higher wind shear exponents for the rougher terrain. For wind turbines on boats or anchored to the seafloor, the reduced wind shear over water means shorter and less expensive towers: a boon to the offshore wind industry.9
TABLE 5-2 Common Values for the Wind Shear Exponent (a), Which Varies with Terrain


We provide a list of common wind shear exponents in Table 5-2, which you may be able to use to estimate conditions on your site.10
How Does This Work for You?
Wind shear exponent is a starting ground for evaluating what terrain you want in order to minimize your wind shear, and thus maximize your wind power density. And the answer seems to be that ice is the new “Green”! You will look to build your home near Superman’s Fortress of Solitude or Santa’s workshop. Hello, frigid Alaska, Canada, and Siberia! Get your property now! Or, for the timid, or those of us living in the temperate zones, turn your lawn sprinklers on in the winter just before the big chill. This chart also tells you to avoid anything with trees and nearby buildings, including your home.
So what you can reasonably take from this is that all obstructions decrease wind power density, but effects are based on the roughness of the terrain and distance from the obstruction. Every meter or foot you raise the tower, the wind shear generally has less negative effects on the performance of your turbine. It would be best if it could be calculated for your site and at the height of your tower. For this we follow up with the power law equation.
Power Law Equation: Determining Wind Speed at Different Heights. Information you get from charts and even local wind speed data might be measured at heights different from where you might feasibly be able to install your turbine. But this will not stop us from getting what we want with what we know. If we know the wind shear exponent and the average wind speed at a particular height, we can calculate what the wind speed should be at any other elevation.
The approximate change of speed with height for different types of topography can be calculated from what is called the power law equation. The power law equation is given as:
v / vo = (h / ho)α
where v is the unknown wind speed at our tower height h above ground, vo is the known wind speed from the local wind charts at a second height ho, and the exponent a is the wind shear exponent.
Example: Wind Velocity at a Site with Several Buildings
Tech Stuff Let us consider a hypothetical site. We have the following information:
1. Your regional wind speed map shows an average wind speed of 5.4 m/s (12 mph) at 30 meters (99 feet) above ground level. This is the reference height.
2. We plan to install a turbine on a 10-meter (33-feet) tower (this is quite short, and is rarely optimal, but we’re using it as an example here).
3. The area surrounding the turbine consists of high grass. From the wind shear exponent table, we see that high grass corresponds to a wind shear exponent of 0.18. Nice!
The wind velocity at level 10 m can be estimated by our formula as follows:

So, using our formula, we see that we lose about 2 mph (1 m/s) of average wind speed, which amounts to some good energy loss, by going from a height of 99 feet (30 meters) down to 33 feet (10 meters). However, this speed is the cut-in speed for many small wind turbines, so we could still consider this a favorable site. However, if the same turbine were placed at the same height within the middle of Manhattan, near skyscrapers with a wind shear exponent of .54, it would have halved the predicted wind power density, meaning it would not likely meet the cut-in speed for it to produce any energy.
INTERCONNECT
Small Wind Goes to College
College of the Atlantic (COA) in picturesque Bar Harbor, Maine, is often cited as one of America’s greenest learning institutions. The small school was founded in 1969 with a deep commitment to the environment, and the only major offered is something called “human ecology,” which is essentially an interdisciplinary study of humankind’s relation to, and impact on, the natural world. In 2007, College of the Atlantic also became the first school in the United States to be effectively carbon-neutral.
In mid-2009, College of the Atlantic received a grant to install a small wind turbine as part of a course called “A Practicum in Wind Power.” Like Kevin, the college chose a Skystream 3.7, rated at 2.4 kW (Figure 5-4).

FIGURE 5-4 The Skystream 3.7 wind turbine is a popular choice for homes and small applications, including for college classes. Southwest Windpower/DOE/NREL.
Bar Harbor’s restrictive zoning prevented the school from installing a turbine at the main campus. However, College of the Atlantic also owns an organic teaching farm in a more rural part of Mount Desert Island, and that seemed like the perfect location to set up a wind collector, due to the ample ocean breezes. In fact, the small turbine is the island’s first, even though Mount Desert is the sixth largest island in the contiguous United States.
Today, the turbine sits on a 40-foot tower, where it powers the office building at Beech Hill Farm. College of the Atlantic lecturer Anna Demeo, who led the wind power class, told us via e-mail that the system will soon be set up to post energy production data to a public website. She also told us that it has been an invaluable teaching aid. Students get hands-on training in renewable energy theory and practice, and the surrounding community is invited to come and ask questions.
“There was a lot of enthusiasm around installing the turbine,” Demeo added. “We use the performance numbers from it to teach students about calculating payback and [return on investment] ROI as well as understanding wind power calculations in the ‘Physics and Math of Sustainable Energy’ class at COA.” Demeo said the turbine has also helped spur other renewable energy projects, helping the college secure grants to add solar panels, a wood pellet boiler, and additional insulation at the farm house.
As far as actual energy production, Demeo told us “the turbine’s performance has been disappointing.” She explained, “We knew going into the project that the height might be a problem, but the local ordinance restricted the tower to 40 feet. There was talk at the time that the ordinance might change, but then we found out that the conservation easement on the farm would not allow more than a 40-foot tower anyway.” “Even with less than impressive power production, I would say that the wind turbine has been a great learning experience for all involved,” Demeo said.
Ways of the Wind: Assessing Average Annual Wind Speed
The average wind speed needs to be measured at the proposed wind generator’s hub height. It’s crucial to get an accurate number, because the relationship of energy potential to wind speed is cubed, or eight to one. You’ll likely have only a 3 to 6 mph average wind speed just above your rooftop, but you might have a 10 mph average on a 100-foot tower that’s 40 feet above the tallest trees. The difference in energy potential between 5 mph (53 =125) and 10 mph (103=1,000) is significant.
So how do you obtain this hub-height wind speed at your property? Unfortunately, it’s not usually easy to come by.
There are multiple ways to approach this value. It is really about how particular you need to be on your site, how accurate you desire the numbers, your time constraints, and your budget. We can only recommend that if you are off the grid, you should seek the most accurate information about your site, because every watt counts when your batteries are starving to be charged up after using your Jacuzzi on the rooftop of your container home in Nicaragua.
Not for Your Eyes Only
Without access to objective data, using more subjective resources becomes better than nothing for the initial assessment. Never underestimate the ability of your senses to evaluate your area. Your eyes notice the wind damage to trees, you can feel the force of a breeze on your cheek, you can taste salty sand blown into your mouth from a beach nearby, you can smell the dump five miles away, or hear cries of children carried from the nearby school.
Also, your ears are good for listening to others. Interviewing long-time locals for anecdotal comments about the winds in the area is very low on the list of quality methods, but not entirely useless, since it may deter you from trying to capture wind energy at a poor site. Ask questions. At the least, it can indicate an approximate direction and wind density of prevailing winds.
In this section, let’s take action to objectively know your property a little so you can get closer to deciding on that critical spot for your turbine.
Beaufort Wind Force Scale
Let’s start outside with detecting instantaneous wind speed at your site. That could be wind gusts—after all, it is often from gusts that people get the crazy idea for having a wind turbine in the first place.
The Beaufort Scale (Table 5-3) is an attempt to describe wind speed ranges based on some general observations. It doesn’t record prevailing wind direction or frequency of the speed, so it is nothing more than a litmus test that can suggest if further analysis is warranted.
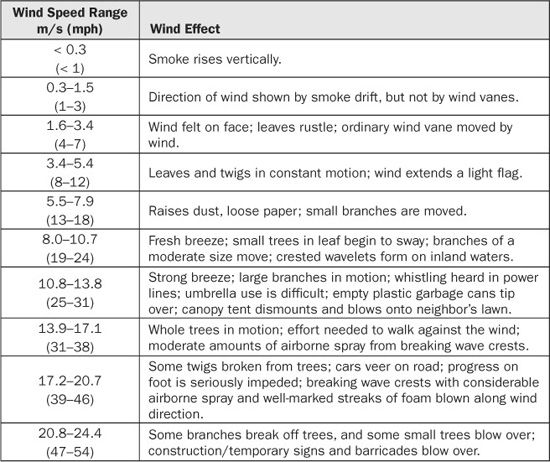
If you don’t have trees or water, you are not necessarily out of luck. This scale has been modified since it was developed in the 1850s, and certainly you should be able to make some observations on your site. We added one based on the reported wind speed from the local weather station as a marker. See if you can find it.
Now, you don’t necessarily need to stand there like a monolith to detect wind. If it is a large property, take a slow walk on every inch, and bring a lighter. See if the gusts can blow it out as you stand in different locations. Even bring a ladder if you want to get a little higher than your hedges. Or have a barbeque and invite some friends, and then watch the pattern of the smoke or see if sand from the yard gets blown onto your cheeseburgers, or lifts your canopy tent off your property.
Don’t laugh too hard—Kevin lost three canopy tents on his property from wind. (Remember: never underestimate the wind, and if you find the tents, please return them.)
If you live in a temperate climate zone, while having some winter fun note where the snow drifts are and how high they go. Kevin’s house in Long Island frequently gets buried in snow on two sides, while the rest of the property—and fortunately, the solar panels—get covered only by an inch or two. That gives some indication of wind direction and power density, at least for that time period.
We have located a wind speed calculator for Android, so consider giving that a try.
Resource
Wind Speed Calculator, Android www.nrel.gov/gis/mapsearch
Griggs-Putnam Index of Deformity
Now let’s try to get a sense of your average wind speed. The secret may lie in your trees or in the trees of the nearby area.
The Griggs-Putnam Index is a way of estimating the prevailing wind speed by observing the growth patterns of trees (Figure 5-5). It is based on the concept that strong winds often deform trees and shrubs, typically in a pattern called flagging. Being able to read this can suggest a record of the local wind speeds during the vegetation’s life.
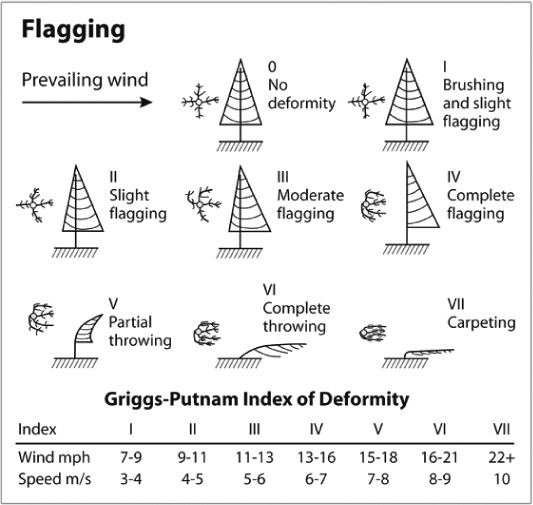
FIGURE 5-5 The Griggs-Putnam Index provides a way of estimating the prevailing wind speed by observing the growth patterns of trees. Wind Power for Home & Business by Paul Gipe (Chelsea Green, 1992).
The effect shows up best on coniferous evergreens, which don’t generally lose their leaves, meaning their resistance to the wind flow remains relatively constant during the year. Deciduous trees shed their leaves in the winter and thus change the exposed area tremendously. If average wind speed is too high, deciduous trees simply cannot survive, since their leaves get too dried out or blown off. However, it isn’t always true that a lack of deciduous trees is as an indication of high winds, since there can be other factors at play.
Another point to consider is that absence of flagging does not necessarily mean an absence of wind, because flagging only occurs when winds blow consistently from one direction. Even Class 5 high-wind sites will not show flagging if the wind direction changes a lot. (The changes of wind direction can be best pictured in the section on wind roses.)
Data-Driven Pyramid of Wind Assessment
We can’t stress this enough: use local data as much as possible. Possible sources include other wind energy users, weather bureaus, airports, newspaper historical weather data, and local weather enthusiasts who have their own monitoring stations and keep tabs on other local data. Mapping the data you have, plus characterizing similar sites, may give you some idea of your resource.
Figure 5-6 is a pyramid that shows you ways to assess your site from most general to most specific. We will look at all these methods:

FIGURE 5-6 When considering your potential wind site, try to gather as much data as possible. Move from the most general to the most specific. Kevin Shea.
1. Global wind maps
2. Regional maps
3. Climatic and meteorological data
4. Wind energy roses
5. Professional wind analysis services options
6. Anemometers
Global Wind Maps
First we start with the big picture, literally. Figure 5-7 shows a global average wind speed map, thanks to a team of scientists at NASA’s Langley Research Center (LaRC). It is derived from ten years of geostationary Earth-orbiting satellite data. Although less accurate due to the indirect means of measurement at the time, satellite data are currently the only wind data with true global extent.11

FIGURE 5-7 This global average wind speed map shows the largest wind resources (lightest areas) above the oceans and midcontinental plains. NASA.
Roughly 7 m/s (15.6 mph) and faster, shown as medium gray to white, are economically worth exploiting today, even in higher-cost locations for large wind farms. We see that the largest wind resources are above the oceans and midcontinental plains. This doesn’t necessarily suggest that you should build an island out of recycled-plastic bottles, add a wind turbine, and then float off of Newfoundland. In many areas, especially on land, the 5 to 6 m/s (13.4 mph) areas, displayed in dark gray, are economically viable for small wind turbines.
In the United States, the South, with a few exceptions, has the lowest potential, but even there some coastal or hilltop areas may be feasible, even profitable, for small-scale wind. On the other hand, the American Midwest and the hurricane alley states have high-quality wind volume and good potential for both large-scale and small-scale wind installations. Parts of the Rocky Mountain states, West Coast, and Northeast also have favorable wind patterns, so that means small-scale wind may be possible near many densely populated cities (so long as you have no obstructions), as well as rural farms and exurbia.
The coastal oceans are of special interest because they have strong winds and are close to most of the world’s population and electricity use. Internationally, many places that will benefit include much of Canada, Greenland, Iceland, Western Europe, southern Saudi Arabia, India, and southern edges of South America, Africa, and Australia.
One important fact that can be deduced from our global site assessment: Wind potential is somewhat regionalized.
Resources
NASA, Global Wind Map 1.usa.gov/visibleearth
Global Wind Map bit.ly/windpowerworldmap
Regional Wind Maps
So let us discover more about how your region measures up. Governments, nonprofit groups, and commercial wind energy companies have all created large-scale wind maps. They may not have enough resolution to provide details on your specific site, but they may suggest first-cut feasibility for small wind turbines.
These maps are typically generated by data collected at various heights, often ranging from 50 meters (164 feet) to 100 meters (328 feet). Such data was most likely collected in open areas, and therefore must be adjusted significantly for wind shear in urban, highly forested, or built up areas.
Still, they may be able to give you a general idea of the local resource.
Resources
Full World Interactive Map 1.usa.gov/nrelmapsearch
U.S. Regional and State Map Links 1.usa.gov/regionalwindmaps
U.S. 50-Meter Wind Map 1.usa.gov/usawindmap
World of Wind Atlases bit.ly/WindAtlasDK
Wind Powering America bit.ly/whereiswind
Wind Powering Maps bit.ly/windpowermaps
The National Renewable Energy Laboratory website includes wind maps for 25 countries and all 50 U.S. states (Figures 5-8 and 5-9). Created in cooperation with the U.S. Geographic Information System (GIS) and the United Nations Environment Programme, these intuitive wind maps were produced at 50 meters elevation. They can help you quickly screen out less promising areas.

FIGURE 5-8 This regional wind resource map of the United States can give a general idea of large-scale trends, but it can’t reliably predict what’s going on at your site. NREL.

FIGURE 5-9 A closer view of the wind resource in the state of Wyoming. NREL.
We include an image of the United Arab Emirates (Figure 5-10) to demonstrate that as we enter a post-oil era, there are feasible renewable resources not far from the existing petrol infrastructure. The same could be said about the state of Texas, which already has many wind farms.

FIGURE 5-10 This regional map of the United Arab Emirates shows that even places long associated with fossil fuels may have wind resources to exploit. World Health Organization.
If you are interested in installing in any other countries or looking into systematic and comprehensive collections of regional wind climates around the world, this is the place. The World of Wind Atlases site is established and maintained by members of the Wind Energy Division at Risø DTU in Roskilde, Denmark (a country that has long been at the forefront of wind energy). The site maintains major national and regional wind atlas studies and other comprehensive wind investigations and databases.
The most comprehensive free regional maps for the United States are currently located online at the Wind Powering America website. The maps are generated from average wind speed data from weather stations at 80 meters and 100 meters, as well as from previous projects.
You are so lucky to be in the Midwest, particularly in Iowa and Oklahoma! Check out the wind power maps using the provided link to view down to the county wind maps. Yeehah!
Canada Wind Atlas
bit.ly/CaWindMaps
bit.ly/OntarioWindMaps
This map shows the Canadian territory sliced into 65 tiles, with calculated data on mean wind speed and energy for three different heights, as well as three geographic fields (roughness length, topography, land/water mask). We included a link to an interactive, color-coded map of numerous wind statistics for any one-square-kilometer area from as low as 10 meters (30 feet) in the province of Ontario. Cool, eh?
United Kingdom
Renewable UK bit.ly/bweaWindMaps
Blokes! The Department of Trade and Industry wind speed database, offered on the Renewable UK website, contains estimates of the annual mean wind speed throughout the United Kingdom. This covers different parts of the country within a 1-km square at 10 meters, 25 meters, or 45 meters above ground level. The database even permits you to type in your ordinance survey grid reference to get specific sites. Cheers!
Climatic and Meteorological Data
To get more precise data near your site, you may be able to tap in to local weather observation stations, which may be established at nearby airports, participating schools, hospitals, and agricultural services (Figure 5-11). Precise wind measurements are made by anemometers, which are typically 10 meters above the ground level, often at open sites, and free from surrounding obstacles (although there are some exceptions).
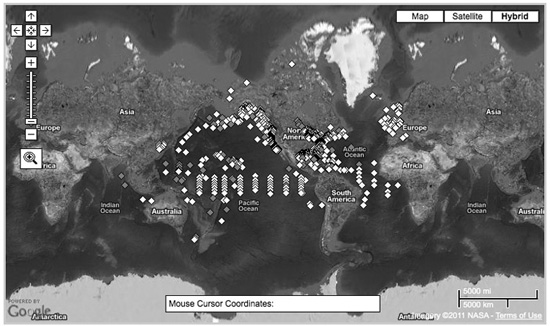
FIGURE 5-11 If you are on the coast, you may be able to take advantage of NOAA’s buoy weather observation program, either by checking the website or dialing in for real-time data. If you live inland, there are comparable programs. NASA/NOAA.
In most cases, wind observations are made with two-or three-minute averages of three-or five-second samples, taken at the top of each hour around the clock.12 So, these are not gusts. However, there are some locations where the observing program is limited to a shorter period than 24 hours.
True, many wind turbine installers include anemometers with their products, but this data is not always available to the agencies that generate the wind maps. If you know of any wind turbines in the local area, you might want to visit the owners to find out what wind data you can obtain from them. (You should also try to get a sense of how you like their kit.)
Resources
NOAA, Wind Energy Data 1.usa.gov/NOAAWindData
Accuweather accuweather.com
Weather Underground bit.ly/WundergroundHistory
NOAA, U.S. Wind History 1.usa.gov/USwindhistory
NOAA, Graphical Forecasts 1.usa.gov/NOAAgraphicalforecasts
XCWeather bit.ly/xcWeather
This book can provide a starter for your search into your community. The National Oceanic and Atmospheric Administration (NOAA) and Accuweather websites provide access to public wind data from as early as 1901, and you may be lucky enough to live quite near a test site (Table 5-4). You may be pleasantly surprised.
TABLE 5-4 The National Oceanic and Atmospheric Administration publishes current and historic data, all the way back to 1901 in some cases, for many sites. You may have to do some calculations and interpretations to make wind data relevant to your site. NOAA.
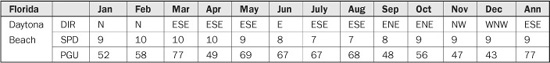
Note that data from NOAA is usually in “raw” form, which means you will have to calculate average and maximum wind speeds, direction, and duration on your own. Once you find a weather station near you, the numbers will start to make sense. If you are spreadsheet savvy, you can enter the data and see immediately if your location has potential.
The table provides the prevailing wind directions (DIR) given in compass points, the mean wind speeds (SPD), peak gusts (PGU), and annual average wind speeds (ANN) in miles per hour (mph). One downside to the tables is that the data might not be current, unless you pay for the recent reports. This means recently installed obstructions, such as a skyscraper, or terrain modification, such as the reforestation of an area, may throw off that accuracy.
Weather Underground (www.wunderground.com), one of the earliest Internet weather websites, holds the world’s largest network of personal weather stations (almost 19,000 in the United States and more than 13,000 across the rest of the world). Their latest online product is the WunderMap, an interactive weather map that allows users to choose from a number of different layers, including wind, that are plotted on top of a dynamic map interface (Figure 5-12).

FIGURE 5-12 Weather Underground’s WunderMap allows users to choose from a number of different layers, including wind. Weather Underground links tens of thousands of personal weather stations around the world. Weather Underground, wunderground.com.
In addition, the link takes you to an online tool that displays an easy-to-understand, linear weather graph of the average wind speed and direction. Simply select the range, and a chart filled with many data points fills the graph. At a glance, you can see the frequency of a particular wind speed or the wind speed distribution—and the numbers don’t sugar-coat the truth the way a wind sales rep might. You can quickly step away knowing that areas close to your cabin have a 10-or 20-year history of varied speed ranges and the frequency of those ranges.
Finally, the UK-based XCWeather boasts current wind observation maps for Great Britain, Germany, France, Spain, and Italy, as well as the United States. The maps display average wind direction with colored regions, plus “gust” arrows, colored based on intensity (Figure 5-13). They even provide animation for wind activity up to the 24-hour range.

FIGURE 5-13 XCWeather’s website shows wind observations for several European countries. The maps display average wind direction with colored regions, plus “gust” arrows. XCWeather.
We are getting closer to your doorstep in terms of knowing what size power plant you will become. The obvious limit of this approach in grabbing climate data is that it only demonstrates the history from a weather station, which even if it is a block away, could be significantly skewed based on the differences between the topography of each site, the height of the anemometer used, and the validity of the observation methodology. In some cases, these weather stations were sited on airport tarmac just a few feet above the ground. Information on the particulars of a weather station is not always provided, which could be an issue, unless your site is the airport itself.
Wind Energy Roses
Although linear graphs of average wind speed are helpful, a better tool integrates wind speed and frequency of wind blowing from various directions. When a president’s limo and vehicle train enter a town, various efforts are typically made ahead of time to ensure that nothing will impede their path of direction to their destination. The same should be done for the very important prevailing (VIP) wind. When you know where most of the wind energy is coming from, you can make sure that path to your wind turbine is free of obstructions.
Now, experiencing a few overturned flower pots on your property, watching a wind vane, or reading a passage in the farmer’s almanac do not make for an empirical test. Instead, we use a rose.
A wind energy rose (often shortened as wind rose) is presented in circular format, with spokes or “arms” of differing lengths that give a summarized view of how wind speed and direction are typically distributed at a particular location (Figure 5-14). A wind rose can compactly display wind speed, direction, and frequency information for any selected period for which measurements have been taken. Annual wind roses represent wind measurements taken over a year, while seasonal wind roses depict data from a shorter period.

FIGURE 5-14 A wind rose compactly shows how wind speed and direction are distributed at a site. The longer the arm, the more frequent the wind from that direction. Color coding shows the amount of time the winds blew at that speed range. USDA Natural Resources Conservation Service.
A wind rose is derived from a compass rose, and both usually have north pointing upward on the graphic. The subsequent arms represent the rest of the 16 primary directions, but in the case of the wind rose, they indicate the direction the wind is blowing from (e.g. N, NNE, NE, ENE, E, etc.). In a wind rose, the longer the arm, the more frequent the wind is from that direction. Summing the frequencies, shown at the tips of the directional arms, may not necessarily add up to 100 percent, however, since “calm” periods are not included.
The concentric circles drawn from the center of the wind rose represent the percent frequency of wind occurrences from each direction. Each circle represents a different frequency, from zero at the center to increasing frequencies at the outer circles. They help to show at a glance the frequencies within each wind speed category. The values of the concentric circles in this example are in 2-percent increments, but can differ between wind roses since they are scaled to best fit the observed data. In Australia, the percentage of calm conditions is often represented by the size of the center circle—the bigger the circle, the higher the frequency of calm conditions.13
The different colors (or in some cases the thickness) of each section of the arm can represent the wind speed range category. For example, a red section (in the black and white photo, it shows as the darkest grey, or is thicker than the slower range) could indicate a wind speed of 10 to 20 mph. As a result, each sectioned arm not only graphically represents the percentage of time that winds blow from a particular direction; it also displays the percentage of time that winds blow at certain speed ranges.
A quick analysis of our sample wind energy rose shows that significant wind energy arrives from the northwesterly region much of the time. In fact, the three arms around the northwest direction (NNW, WNW, and W) comprise roughly 25 percent of all hourly wind directions. This is quickly calculated by taking the sum of the frequencies (9.39 + 4.7 + 8.8 = 22.9%) of each of these directions. On the other hand, the winds from NNE to ESE are neither strong nor as frequent in any particular direction. Adding each percentage, they amount to 25 percent of reportable wind, yet most of the time the speed is too low to provide much energy.
These wind roses also provide details on promising speeds from different directions. Although the wind doesn’t blow nearly as much from the southerly direction, the last section of the corresponding arms shows that the highest wind speed range, 10 to 20 mph, occurs as frequently as from northwesterly regions. With a glance, you can see at least two areas where the VIP might be arriving from, so it is best to site the turbine to exploit that wind energy.
To calculate the typical amount of time in hours that the wind blows from a particular direction and at certain speeds, just multiply the respective frequency by the appropriate amount of time. In our example, there are 520 days × 24 hours/day in the time period assessed, or 12,480 hours. From the wind rose we can calculate from the concentric circles and sectioned arms that winds blow from the northwest at speeds between 5 and 10 mph 4 percent of the time. This represents 0.04 × 12,480 = 499.2, or about 500 hours (21 days’ worth) of typically having winds from the west northwest at these speeds at this specific location.
We couldn’t readily find enough useful free sites that display wind roses outside of the United States, Australia, and Ontario. If you find one, send it to our Facebook pages. In the next section we can show you some websites that might offer services for your area.
Within the United States, the Idaho National Laboratory is gracious enough to provide a do-it-yourself, enter-the-location, and right-before-your-very-eyes calculate and display a wind power rose to show your family and friends, and then put on the refrigerator. Also included with the software is a program to help you create a wind rose from your own observations. It is designed to combine validated wind resource data from either climate data mentioned earlier or from data from your anemometer to calculate average wind speed and then display it in the wind rose map.
The bonus is that it includes sample power curves from some of the best-performing small wind turbines, with estimated annual energy production and capacity factor. After Chapter 8 on wind turbines, you can paste the power curve numbers, and you will know how your site performs with the machine of your choice before you put any money down (unless you got the data from a professional service or anemometer).
Resources
U.S. Wind Rose 1.usa.gov/USwindrose
Australia bit.ly/auswindrose
Idaho National Laboratory (INL) 1.usa.gov/windrosegenerator
Ontario, Wind Rose bit.ly/ONwindrose
Professional Wind Analysis Services
What was once used exclusively for large wind farm developments is now becoming increasingly accessible to community projects, and even individual installers, for a small fee. Getting a professional wind mapping assessment is much quicker, safer, and easier than using an anemometer, and it may bring similar results.
These assessments are typically online-based services that analyze existing data and modeling from climate history, nearby anemometers, and other sources, and they can be a fairly accurate way to estimate real-world values. Most services tend to use an interactive Google map that permits you to locate and place your wind turbine precisely on your property, with a suggested hub height. They include online tools providing annual mean wind speed, monthly mean wind speed, annual wind rose, and wind speed distribution for your specific location.
These services are made possible by a dataset created through applied weather prediction models, similar to national weather forecast services, as well as publicly available observations from meteorological towers worldwide.
A number of producers of wind analysis models have argued that the difference in annual mean wind speed data between their tools and actual on-site measurements is less than 1 m/s. Modeling is increasingly being proven effective, even in complex terrain and wind regimes. Not bad for an online instantaneous query. Some of them, like Seattle-based 3TIER (Figure 5-15), permit multiple locations or multiple hub heights (20 meters, 50 meters, 80 meters), so you can compare several prospects, or set one on your neighbor’s property, so you can verify that you have more potential wind energy than the Joneses. Nice!

FIGURE 5-15 Services like 3TIER can provide quite detailed analysis of wind data and trends for specific sites, often for a modest fee. Remember that the results are going to be affected by your precise surface roughness and any obstacles. 3TIER Wind Prospecting Tools, 3TIER Inc.
Oh, the price to assess your wind resource in moments, from your rocking chair? Could be as little as $150 for a full ten-page report with graphics and explanations. If you wish to make a career out of assessing other properties, you may consider leasing the software for $500 monthly, or buy it outright for several thousand dollars and earn revenue while educating your neighbors.
Resources
3TIER bit.ly/3tiertool
WindNavigator www.windnavigator.com
WindStream bit.ly/auWindstream
Wind Atlas and Application Program www.wasp.dk
Anemometers
If you plan on investing significant money in wind power, it may be worth your while to actually measure the wind speed at your proposed hub height for a year or more. This is what commercial wind farmers do, and it’s the most direct way to get a handle on the average wind speed on your specific site.
Note that we suggest doing a measurement for a year or more; ideally, you would measure for several years, or at least a year and a half. This is because winds can be quite variable, even year to year. Your area might be affected by El Niño or other periodic macro-level events, although ideally the research you would have already done would have provided some insight into those kinds of trends. It’s most important to avoid relying on data from a single season, because winds tend to vary through the year, with highest speeds most often seen during the winter.
Wind speed is measured with a device called an anemometer, the most basic of which hasn’t changed much since Dr. John Thomas Romney Robinson invented it in 1846, though there have been a few incremental improvements. Robinson’s design had four hemispherical cups arranged at right angles. He observed that the prevailing wind direction would catch the cups, causing the device to rotate around a vertical shaft (making it a simple vertical axis wind turbine). By counting the number of revolutions per second, Robinson could work out the wind speed.
Today’s anemometers usually have three cups instead of four, since they are more responsive (Figure 5-16). They may have a tag added to one cup as well in order to measure the wind direction by observing where that cup speeds up. There are many other ways to measure the wind, including with lasers, sound waves, a resistive wire, or even a ping pong ball attached to a string. Also common is the horizontal axis anemometer, sometimes called a “windmill” or “propeller” anemometer, or an aerovane (Figure 5-17). This device has a small rotor, like a tiny horizontal axis wind turbine, and a tail that looks like a weathervane. As a result, an aerovane can display both the wind speed and direction.

FIGURE 5-16 The most direct way to measure wind is with an anemometer, like the rotating three-cup design pictured in the center. To assess a site, you should take measurements for a year or longer. Brian Clark Howard.

FIGURE 5-17 An aerovane is a type of “windmill” or “propeller” anemometer that measures both wind speed and direction. Brian Clark Howard.
The biggest drawbacks to using anemometers are time and cost. Understandably, people are often not thrilled when they hear they may have to wait a year or more before they can start shopping for their new renewable-energy toys. Commercial anemometers are expensive, and weather stations are very expensive. Affordable ones can be found with a quick Google search for “average wind speed anemometer,” with prices that range from $30 to $2,000, depending on the durability, quality of results, application, and bells and whistles, not including the tower.
Homebrew methods of setting up an anemometer may drop the cost to between $1,000 and $5,000, depending on the height evaluated. A professional setup will likely cost three to five times that. Obviously, that’s a lot of money to invest in something that may end up telling you not to get a wind system, which is why a lot of small installations are made without this step.
Once operating, you should only need to check on the anemometer setup occasionally for guy wire integrity and to ensure that the cups are spinning when the wind is blowing. The cheap ones can have an accuracy of plus/minus 5 percent when wind reaches a speed above 3 mph, but to ensure that your equipment can handle the environment, check for feedback from previous customers. Not all anemometers are made for hostile environments. Also, get a clue of how high you want your final wind power tower to be before you buy the tower for the anemometer. And it is usually best to install a higher tower, because if you want to go lower, you can simply lower the anemometer. If you have to calculate for hub heights higher than your anemometer, you should expect increasingly inaccurate results.
What are some pointers on anemometers that you might not find in the installation guide? First, when is the best time of the year to start assessment with one? We can reasonably suggest a month when it is easy to install in order to mitigate risk and minimize effort. It is a different type of experience when you have to slosh through the Mississippi mud fields or pick through a foot of frozen earth to install anchors.
Second, leave it alone for the time you are measuring. You don’t want to risk moving it a few feet and affecting the readings. And last, if for some reason in the first five months the system fails for more than a week but less than a month, you can average all the recorded months and get a fairly accurate average. However, if it fails within the sixth to the twelfth month of an 18-month period, we would suggest that you extend the testing to the same month(s) of the following year to ensure you are not losing data on a month that might have higher wind energy.
To aid in understanding how this works, simply recall what was discussed in the section on wind roses—namely that certain months typically display higher frequency and intensity of wind power energy. If Kevin were testing on his property on Long Island and the system failed during the cold winter winds of January, his main energy-producing month, he would monitor the following January to achieve a more accurate assessment before he flagged his conquest with confidence.
Bringing It All Together
In the end, it’s best to use all available methods at your disposal to assess your wind resource, take an average of the results, and then round down. It’s much better to predict lower wind speeds and be pleasantly surprised than to predict unrealistically high wind speeds and be disappointed.
Remember, the more time you spend and the more data you assess, the more accurate picture you’ll have. Still, you may be surprised that many system owners we talked to didn’t spend as much time as we’d recommend at this stage, and few used an anemometer. Some are disappointed with their system results, some are satisfied, and some are very satisfied, though it’s also true that in many cases energy produced isn’t the only value of the system. Only you can decide what balance of up-front cost versus risk is right for you.
We asked small wind installer, author, and trainer Dan Fink for advice on the matter. “The stuff available from NREL is really good, and can give you a decent ballpark figure,” Fink told us. “Micro-siting makes a huge difference, much more than for solar power. Everyone knows that you don’t put your solar panels in the shade. But a wind resource measured by someone 10 miles away could be completely different than what you have, because of ridges, valleys, trees, buildings, and so on. That’s where people get confused if wind will work for them.”
Tower Types and Site Evaluation
It’s important to remember that when you are siting a wind turbine, you are siting for the tower as well. So, we provide here a brief section on the relationship of your site to your tower type.
As we mentioned earlier, there are three main types of towers: tilt-up towers, fixed guyed towers, and freestanding towers (Figure 5-18). Let’s take a look at how your site might accommodate each one.

FIGURE 5-18 There are three main types of turbine towers: fixed guyed, tilt-up, and freestanding. Kevin Shea.
To understand how it affects your site decision, we need to first look at the general requirements for all towers. Your site needs at least a good-sized patch of open space, road access (unless you own or can afford to rent a helicopter), adequate soil, and—sometimes—level ground. We define open space here as any area that is not only void of obstacles that prevent wind, but also void of any geological feature that would prevent you from getting your turbine and trucks to the site. Rocky terrain, steep inclines, thick forests, ponds, and muddy roads are a few examples of features that impede passage of a wind turbine. It adds to your cost, and is sometimes the major factor in determining the feasibility of a project, at least until hover-crafting wind turbines are invented.
Once you are at the site, consider the soil type. If your ground is bedrock, making foundations may be relatively straightforward. However, if your alligator-infested swamplands have good wind, then creating a substantial base to hold your turbine in place may be your biggest challenge.
Fortunately, you can put a tower on an incline, as long as you can get through the installation. You can often use the slope to your advantage, and this can be cost saving.
Most geographical features that present challenges, with the exception of active volcanoes, are resolvable, but may require different approaches, and lead you to the tower type of choice.
Tilt-Up Towers
Rather self-explanatory, a tilt-up tower permits the turbine to tilt down to the ground via a hinged mechanism near the base (Figure 5-19). Tilt-up towers require large open spaces without obstructions, at least on one side, because you need to lower or raise it (hopefully only occasionally). They are usually made out of tubular steel.

FIGURE 5-19 Tilt-up towers offer easy maintenance, but they need a wide clearance around the tower. Warren Gretz/DOE/NREL.
Ensure either that you own the property that the tower is about to descend to or that you have legal permission to bring this heavy steel structure over your neighbor’s white picket fence. This tower type also requires a totally clear cookie cut-out on the ground of a size at least the length of the tower and width of the rotor diameter.
If it requires manual assistance with a heavy-duty truck, ensure you have access to the area on the opposite site. You don’t need to have level ground, and it can help if you tilt down the tower into the incline. Also, make sure the wind turbine’s resting spot is not over a land depression like a gulley (or a swimming pool), because that would defeat the purpose of tilting the tower for easy access (Figure 5-20).

FIGURE 5-20 Make sure your turbine’s resting spot is over level ground. Warren Gretz/DOE/NREL.
Fixed Guyed Towers
Like the tilt-up tower, your site doesn’t need to be flat to accommodate a fixed guyed tower (Figure 5-21). Guyed towers are lightweight poles or latticed steel fixed in a concrete base, supported by at least three cables or guy wires, attached to the tower and mounted to anchors in the ground some distance from the tower.

FIGURE 5-21 A Kansas family proudly shows off their Breezy 5.5 wind turbine (aka “the Sunflower”), held up with guy wires. Timothy McCall/Prairie Turbines.
As its name suggests, this tower type typically doesn’t tilt down, but frequently it might have a hinged base, and for installation is raised using a small truck with a winch and a pivot bar, while the side guy wires assure the tower doesn’t swing to the sides as it is placed in its final position. The cleared area required for install appears to be in the form of a Christmas tree, where its Christmas star (or angel) would be at the position of the rotor on the tower as it lies on the ground.
Although the installed tower itself might not take up as much of a ground footprint as the tilt-up tower during its lifetime, the paths of the tension wires always need to be clear of swaying and falling branches. In addition, care must be taken to avoid siting near roads or electric lines. In the case of a compromised cable (snap), it becomes evident that a recoiling and dropping line can cause its own havoc. Even for maintenance, the site should permit access for a bucket truck to raise and lower the turbine if major overhaul or blade replacement is required.
Freestanding Towers
Freestanding towers are generally heavy steel structures, and they may have either a lattice or monopole design (Figure 5-22). They can maintain the same width through their entire height, like a typical flagpole, or they can start wide at the base and become narrower at the top, like the Eiffel Tower.

FIGURE 5-22 This Northwind 100A turbine in Colorado is mounted on a 98-foot (30-meter), freestanding monopole tower. The 100-kW turbine has a rotor diameter of 62 feet (19 meters). Lee Jay Fingersh/DOE/NREL.
Freestanding towers have a relatively small footprint, but need a place to excavate an extensive hole for a deep, or wide and deep, concrete footer. If your site is on top of bedrock, using rock anchors may suffice, even for large towers. Not all stones are equal in terms of strength of anchors, so find out what you’ve got and talk to an expert about it.
Like the fixed guy tower, you will probably need road access and space for a crane to lift the heavy tower. A Toyota Hilux is not likely going to raise a freestanding tower; more likely it will catapult the car. After the tower is up, most maintenance will require climbing the tower, so make sure you have the gear ready.
Consider Maintenance
You’ll need to make scheduled maintenance on your wind generator at least once a year, and possibly more frequently. Are you willing to safely climb, or hire someone else to climb, the tower (Figure 5-23)? If so, then the vegetation could be allowed to grow around the tower. (Don’t let it grow too high, or did you not read the wind shear section?) However, if you are thinking of hiring an expensive crane, then you need to ensure that you have an access road to the tower. The next decision is aesthetics.
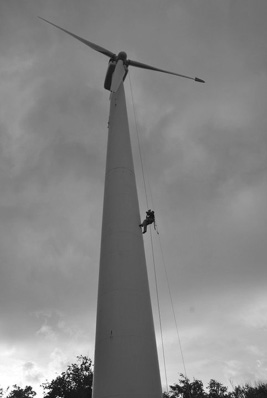
FIGURE 5-23 If you have a high tower, chances are good you are going to have to climb it at least once a year for maintenance, if not more often. Make sure you can ascend and descend safely, with proper safety gear. Rosalie Bay Resort.
Siting for Roof-Mount Micro-Turbines
Like many people, you may be excited over the prospect of having your very own small turbine on your home. And plenty of YouTube videos show some progress in the field, often with fancy computer-generated graphics and high production values. A roof seems like a shortcut to getting higher into the wind, and it seems like it could save space and the expense of a tower. For some, the roof may seem like the only option because they have so little space, especially in suburban or urban areas.
As it turns out, rooftop wind turbines are quite controversial in the small wind industry, with many long-time pros condemning them en masse and claiming that they hurt the credibility of the whole field. We’ll share the facts that we have available, and you can decide whether it is worth it to you.
In a nutshell, our current recommendation is to avoid roof mounts for the vast majority of situations, unless you want an expensive experiment or want to serve as some startup company’s guinea pig. That’s not to say roof-mounted turbines will never work, but there are currently very few examples of successful installations, and most of the technology is quite new and largely untested in the real world (wind tunnels can only tell you so much).
It’s important to note that mounting a turbine on your roof can be dangerous and difficult, and it can endanger what is probably your most valuable possession besides you and your family—the building. Turbines do produce vibrations, which can be enough to cause structural damage and even roof failure.
If it is your home, you certainly don’t want a heavy wind generator crashing into your bedroom while you sleep! In a less extreme scenario, the vibrations can be annoying, and can require expensive dampening equipment and a lot of tweaking. On a lighter note, if you can afford two turbines placed on either side of your bedroom window, it could be the most realistic flight simulator. “Honey, I think we are flying to your favorite country today!”
Probably the biggest drawback to roof mounts is that they tend to be in high-turbulence zones (Figure 5-24). The building itself tends to disrupt the wind, often in complicated ways, and many homes are close to trees, utility poles, and other buildings. Further, although your home may have two or three stories, that isn’t really very high when it comes to wind turbines. Even if the wind weren’t affected by the home, a roof mount would have a hard time getting a turbine into good flow.

FIGURE 5-24 Roofs tend to experience heavy turbulence, as do any obstacles to the wind. Kevin Shea.
Since rooftops create power-robbing turbulence, that disrupted air also tends to place wear and tear on the blades and the generator assembly, which can shorten a wind turbine’s life. Turbine models that supposedly contain mechanisms for turbulence reduction most likely experience added vibration as a result, which would require more dampening, and that is additional cost to you.
To reduce rooftop turbulence, a wind turbine could theoretically be raised well above the roofline on a tower (Figure 5-25). But the engineering required for this can be formidable. Most likely, you’re not going to want a big tower sticking way up off the top of your house, like something from a Monty Python sketch. That has a good chance of causing angry neighbors, and it sounds expensive.

FIGURE 5-25 A roof-mounted micro-turbine kicks in power when the sun doesn’t shine on a farm in Cobden, Illinois. Advanced Energy Solutions/DOE/NREL.
Some supporters of roof turbines have pointed out that, in isolated areas, a pitched roof tends to cause wind to speed up. That is generally good, except for the presence of wind shear. Even turbines designed specifically to take advantage of the acceleration of wind across buildings have shown very poor energy performance in real situations, with payback periods literally in the thousands of years (more on this in Chapter 12).
In 2007, British researchers conducted a year-long study on the performance of 23 roof-mounted turbines at 30 sites in the United Kingdom. Called the Warwick Microwind Trial, the project was carried out by a consulting firm called Encraft, with funding by the Pilkington Energy Efficiency Trust, Warwick District Council, BRE Trust, and participating homeowners.
The study used a number of different designs, including 14 Ampair 600 systems, 5 Windsave WS1000s, 1 Eclectic Stealthgen 400, 1 Swift 1.5kW, and 3 Zephyr AirDolphin systems (23 + 1 spare). The locations were spread across several towns and included three tower blocks, a number of gable end installations in different contexts, a steel-framed building, and a timber-framed “ecohouse.”
If you want to view the detailed results of the Warwick trials yourself, browse to www.warwickwindtrials.org.uk. But the “short answer” is that many small wind experts interpret the study’s results as reinforcing their beliefs that rooftops are poor places to harvest wind energy.
Every turbine tested in the Warwick study produced less than 500 watt-hours (½ kWh) per day. To put that in perspective, the average U.S. home uses 30 kWh per day. That means, at best, one of the rooftop turbines could provide 1/60th of a home’s energy. Not too impressive.
Further, some of the study turbines were unable to generate more than the “parasitic” power losses used by their inverters, meaning they consumed more electricity than they generated. This was largely due to very low wind speeds. At some sites, the amount of energy that had been predicted to be produced was more than 1,000 percent higher than what was actually generated.14 A number of the study’s roof turbines were turned off during the course of the trials because of technical problems or complaints over noise.15
In fact, the study authors noted a number of problems, including long waiting periods for equipment and difficulty in sourcing all the needed supplies. Remember when we mentioned that the rooftop turbine sector is largely unproven and immature? The researchers also concluded that having a good wind resource is the single most important factor that determines whether a wind energy project is going to be successful. (That should sound familiar.)
Perhaps not surprisingly, manufacturers of rooftop wind turbines are critical of the Warwick study. Some argue that the scientists used test sites in an area that historically has relatively low winds, and that were really not suitable for any type of wind-collecting device. Some said the trials failed to take into account their particular models and high-tech designs, although it’s worth noting that several manufacturers were represented.
Small-wind owner, installer, and author Ian Woofenden pulls no punches when it comes to roof mounts. “They might make a profit for the companies that sell them, but if your goal is renewable energy, roof mounts don’t work,” Woofenden told us in a phone interview.
“The best use of roof space is solar panels,” he added. “For wind energy, there is nothing that will work at that level. There is low wind and high turbulence, a one-two punch knockout.”
Woofenden calls roof-mounted turbines a “crazy waste of resources.” He said people often forget about the cubic relationship of energy and wind speed, and argued, “It’s about kWh.” He added, “If you move 20 feet above a roof you get a significantly larger resource, though that is still in a turbulence zone. If people don’t understand energy then they’re ripe for being taken advantage of.”
Another small-wind expert, Mike Bergey, president of Bergey Windpower Co., said, “The plain facts are that roofs weren’t designed for wind turbines and the wind over roofs is hard on a wind turbine. It’s the hardest and worst place to put a wind turbine.”
Southwest Windpower Vice President Andy Kruse was more sanguine: “There are conditions where a rooftop-mounted wind generator can work. However, like solar, an improperly mounted wind generator can be worthless or worse, cause damage to the roof. A wind generator must always be mounted on the upwind side of the structure and if at all possible more than 10 feet above the roof. Structural engineering must be completed on any building where a wind generator above 1kw is installed.”16
For his part, Stephen Crosher of Quietrevolution, a manufacturer of small vertical axis wind turbines based in the United Kingdom, told us via e-mail that his products can work well on a roof if the right conditions are in place. “The building needs to be several stories higher than the surrounding buildings,” Crosher wrote. “The mast used on roof tops should be at least half as high as the depth of the building, e.g., if the building in plan is 8 m[eters] × 8 m[eters] the mast should be at least 4 m[meter] tall. Quietrevolution advises a six-meter mast as this is appropriate for most roof tops.”
Crosher added that underlying topography needs to be considered. “A tall building in a dip is unlikely to work well, while a smaller building on a hill top is likely to perform,” he explained. “Lastly, the choice of site should not be shadowed from the more dominant wind directions. In the UK this is all directions from south through west and the north east.”
As mentioned previously, a small number of companies are working to address the difficulty of siting building-mounted turbines by using software and other computer models to predict wind resources more accurately in these environments. They are also using exotic designs or, frequently, vertical axis wind turbines (VAWTs), both of which we cover in detail in a later chapter (see Figure 5-26). Some of these companies have won high-profile design awards for their efforts, and roof-mounted turbines enjoy considerable media buzz and attention from the public.

FIGURE 5-26 This Savonius VAWT sits on a roof at Ben-Gurion University of the Negev in Israel. It’s a demonstration project that produces little energy. Brian Clark Howard.
Power Up! “Breakthroughs” are frequently announced by makers of rooftop turbines, many of whom also boast that their devices have “very low cut-in speeds” or are “better at turbulence,” although you should already be skeptical about the importance of these claims (we’ll address them at length when we get to VAWTs). It’s perhaps most important to note that actual installations of roof-mounted and VAWTs can often be counted in the tens or maybe hundreds. In comparison, more “traditional” propeller-style small wind turbines have been installed by the hundreds of thousands, and they have decades of proven track records.
If you have a lot of disposable income, there’s maybe nothing wrong with ordering the latest and greatest roof turbine and impressing all your friends and neighbors, although be aware that some people may accuse you of discrediting the small wind industry and turning away potential customers for them if you have problems or poor results.
The bottom line is that if you are on a budget and care about producing kilowatt-hours, putting a turbine on your roof these days is at best a considerable risk. Ten years from now, who knows?
Resources
Domestic Roof-Mounted Wind Turbines Study bit.ly/midwalesmicrowind
Urban Micro Turbine Article cnet.co/CNETurbanmicro
Social Friction Factor
Just when you get a site that you know would be perfect for lassoing wind energy and riding that horse into the sunset, you want to share your excitement with the neighbors and tell everyone to put one on their property.
Take off your thinking cap and put on some comfortable clothing. You might also want to grab a tissue box. We need to balance the science we’ve covered so far with a short section on belief and emotions. In Kevin’s neighborhood, he tends to loosely call any resistance from the public to a wind project the Not In My Back Yard (NIMBY) policy. The fact is:
Your neighbors, whether the turbine can be seen, heard, and/or felt, or the nearby public, have an interest in the safety of the birds, bats, fish, or howler monkeys around you, as well as other factors you might not have even thought of, so all may have a stake in the success of your project. In Chapter 7 we shall discuss in detail winning over your neighbors, overcoming zoning hurdles, and working with the power authority and your government. It can seem overwhelming, but it can be done.
Here, we just alert you to the fact that your location may have an effect on your neighbors’ emotional comfort or property value (Figure 5-27). Any site evaluation should include what the neighbors—Status-Quo Stan, Hyper-hearing Henderson, Viewshed Vicky, Seizure-stricken Sally, Paulie the Politician, Bird and Bat-loving Bobby—think of your project.

FIGURE 5-27 This Bergey 10 kW Excel sits atop a freestanding lattice tower in Kansas. Warren Gretz/DOE/NREL.
What? Outrageous you say! Just wait for the details in the ensuing chapters. Some jurisdictions do not yet have sufficient legislation specific to small wind turbines, and some that do issue permits have mechanisms that delay the process. Currently, it is still common for building ordinances to require consent from neighbors within a certain distance from the turbine, or a majority vote from town boards. In addition, they may require extensive and expensive testing, similar to what’s applied to the big guns: noise pollution, shadow effect, avian mortality, epileptic seizure or syndrome effects, and so on.
Your only recourse if the permit ordinance doesn’t address your innovative wind collector is to assess the situation for social temperature. Unlike the scientific method we use to evaluate the site for wind energy, the hot air chatter and cold stares from the community are not easily measurable. Your recourse is usually the old-fashioned way: tell your neighbors and town officials your plans and see if they applaud, accept, or abhor your ideas. And when your survey, formal or informal, results in a very hot-to-handle situation, you need to decide if the challenge is worth it.
However, the good news is things are changing. Small wind turbine performance and safety standards have been established from various wind energy associations. The certification process requires wind power systems to adhere to sound limits, strict installation protocols, and built-in safety components. Such quality control measures provide town officials substantial assurances, such that there is no longer such a foreboding case-by-case challenge of assessment. Of course, if you are within a progressive jurisdiction where you can already get a wind turbine permit, you will be able to bypass some of the hurdles of paperwork and the Facebook surveys. If you get defriended because of your insistence on a wind turbine, let us know.
Summary
Before you start shopping for turbines, it’s critical to make sure one will work on your site. Above all else, do you have enough wind to make the project worthwhile?
Luckily, a number of tools are available to help you answer that question. You can check out global and local wind maps, and examine data from nearby weather stations or other wind energy producers. You can talk to neighbors and even get clues from the landscape, including how trees may be deformed by the wind.
We recommend ordering a custom wind assessment from a reputable company online. For a modest fee, you can often get quite detailed estimates of the wind resource on your property. If you’re really serious about the technology, you may also want to get an anemometer and take your own measurements. Unfortunately, setting one up can cost a good amount of money, and you really should do the monitoring for at least a year and a half.
Once you’re sure you’ve got enough wind, you also need to make sure your site can support a tower, both for installation and maintenance. And finally, what will the neighbors think? Get them on board early, or risk stress and headaches later.
To help you start thinking about these decisions, we put together Table 5-5.
TABLE 5-5 Design Approach to Small Wind Turbine System

