
CHAPTER 3
Electricity, Energy, and Wind Science
The answer, my friend, is blowin’ in the wind. The answer is blowin’ in the wind.
–BOB DYLAN
In this chapter, we will provide a brief overview of electricity and the core principles of wind energy (Figure 3-1).

FIGURE 3-1 In order to understand wind energy, we first need to know a little about electricity. Kevin Shea.
We will brush over the basics, but if you need more explanations, follow the footnotes.1 We don’t provide ludicrous imagery like the writers from the South Park television program, but we do use speeding cars, sponges, and aquariums to help illustrate a topic that is usually hard to explain.
Basics of Electricity
In a nutshell, William Beaty writes on amasci.com:
“Conductive objects [such as wire] are always full of movable electric charges, and the overall motion, or flow, of these charges is called ‘electric currents.’ Voltage can cause electric currents because voltage differences act like pressure differences, which push the conductors’ own charges along. A conductor offers a certain amount of electrical resistance, or ‘friction,’ and the friction against the flowing charges heats up the resistive object. The flow-rate of the moving charges is measured in amperes. The transfer of electrical energy (as well as the rate of heat output) is measured in watts. The electrical resistance is measured in ohms.”2
Electrical Charge (Voltage)
You want to know what is inside the wires doing the work? Well, inside every wire is a sea of electrons—the charge. Beaty explains that charge in a wire can be thought of as similar to water in an aquarium, since the outer electrons of metal atoms are free to move through the entire mass of material, similar to water molecules in a tank. A charge can move, and usually needs little more than a push, like rubbing your foot on a rug in the case of static electricity. Without that “push,” the charge inside a metal remains neutralized because each movable, negatively charged electron is near enough to a corresponding positively charged proton within a nearby atom, keeping the charge paired among its atom friends. Beaty suggests that’s like a pipe stuffed with positively charged sponges, which are in turn filled with a negative liquid.
What gives the electrons a push? It takes a separation of positive and negative charges within the material, which leads to something called electrical potential. The actual driver of charge separation is called electromotive force (emf), so technically emf creates potential, which is measured as voltage.
Remember that sea of electrons and Beaty’s sponge analogy? Well, if you put pressure on that sponge, it would send the negative liquid flowing through the pipe of sponges. This would leave the positive sponge left behind and an oppositely imbalanced charge. The haves with the have-nots. The voltage is, therefore, an electric field that extends across the space between the empty sponge and the full sponge. Electrostatic fields are measured in terms of volts per distance, and if you have an electric field, you always have a voltage. It’s part of their “pumping” action.
A battery acts as a charge pump. If we have a ring of copper wire connected to the positive and negative ends of the battery, it will pull charge out of one side and push it into the other side. This causes a voltage difference to appear between the two sides of the ring. It also causes an electrostatic field to form around the ring. The voltage can be thought of as pressure.
So, in practical terms, the voltage between two points is a measure of the electrical force that would drive an electric current between those points. The higher the voltage, the more “push” that is available. Voltage is represented by energy per unit charge, and is measured in units called volts (V). Technically, one volt is equal to one joule per coulomb. We define joules in the section under power, and a coulomb represents charges approximately equal to 6.24151 × 10¹⁸ protons or –6.24151 × 10¹⁸ electrons.
One final note before we continue. Charge isn’t “used up” in wires. It isn’t like a limited number of gumballs in a dispenser that have to be refilled. The electrons return to where they were before, or they settle into the nearest convenient spot, but there is always enough to fill the structure of the wire. Perhaps it is more like the Willy Wonka everlasting gumball dispenser.
Current (Amperes)
In the spec sheets of turbines, you might see listed a rate for a particular number of amp-hours. For the sake of deciding what turbine you want to get, it is good to have an understanding about how to measure the energy flow that is coming from the generator (Figure 3-2). Whenever the charge “stuff” within metal wire is forced to flow, we say that electric currents are created.

FIGURE 3-2 This Bergey 10-kW Excel wind turbine provides supplemental power for a farm in Scott City, Kansas. Excess power is fed back into the utility grid. Warren Getz/DOE/NREL.
We normally measure the flowing charges in terms of amperes or amps (A), though the concept of current is often represented as the letter I. As stated earlier, charge is actually measured in units called coulombs, and the word ampere is really shorthand for the rate of one coulomb of charge flowing per second. If we were talking about water, then coulombs would be like gallons, and amperage would be like the rate of gallons per second, according to Beaty’s helpful analogy.
Note that people often expect electric current to be at light speed from the source to the receiving point. After all, when you flick on a light switch, it gets brighter pretty darn quick. But actually, charge-stuff flows slowly through wires, slower than centimeters per minute. So, do not confuse this with the electrical energy that powers your light; we will discuss that later with watts.
The amperage or rate can be affected by two things: (1) speed of the charges, and (2) size of the wire. Here are some simple correlations:
• Double the speed of charges in a wire and you double the current (amps).
• Increase the size of the wire, and you increase the amperes.
Ampere-Hours (Amp-Hours)
While perusing for wind turbines or batteries online, you will likely see references to amp-hours. One amp of charge flowing through a wire for an hour is one amp-hour. As an example, a typical flooded lead-acid battery might store 420 amp-hours of electricity.
Resistance (Ohms)
Wherever it travels, electricity encounters resistance to its flow. It can be helpful to think of resistance as friction, since the result is similar: impeding action of a force. Resistance is usually represented as R and measured in ohms. The more ohms something has, the more resistant it is to transfer of current.
If we may borrow another analogy from Beaty, let’s imagine a pressurized water tank. Connect a narrow hose to it and you’ll get a specific flow of water, measurable in gallons per minute. It stands to reason that if you increase the thickness (cross-sectional area) of the hose, then you’ll increase the flow rate. The same relationship holds to resistance and wires: thicker wires have less resistance, because there are more electrons available for moving charges. Now, double the length of the hose, and the flow of water decreases by two times. This is because we doubled the friction. Make the hose shorter and the reduced friction lets water flow faster.
Similarly, if we double the length of a wire, we double the friction and cut the charge flow (amperes) in half, assuming the voltage (pressure) is constant.
All Together Now: Ohm’s Law
We can also change the flow by changing the pressure. Add a second battery to the circuit in series and this gives twice the pressure difference, which doubles the charge flow. Ohm’s Law says if the pressure (voltage) goes up, the flow (amps) goes up in proportion. It also says that the resistance affects the charge flow in a predictable way. If the resistance goes up while the pressure difference stays the same, the flow gets less in “inverse” proportion. Simply said:
The harder you push (voltage), the faster it flows (amps).
The bigger the resistance (ohms), the smaller the flow (amps).
Let’s take what you now know and write it shorthand:
Volts/Ohms = Amperes
Voltage divided by resistance equals current. This is the mathematical expression of Ohm’s Law. So, make the voltage twice as large, then the charges flow faster, and you get twice as much current. Make the voltage less, and the current becomes less.
If you keep the voltage the same and you double the resistance, say, by adding another light bulb, you get another law:
The more resistance you have, the slower the flow (current).
The more light bulbs, the more resistance, which means that current is less and each bulb glows more dimly.
So that explains the relationships between volts, ohms, and amps. However, wind turbines usually list rated wattage. So what about watts?
Power (Watts)
A watt (W) is a concept that people often have trouble with at first. A watt is a rate, and it measures the rate of transfer of electrical energy at a given moment. This is a similar concept to your car’s speedometer or a police radar gun, which measures the rate of speed of a vehicle at a given moment. Except electrical energy is measured in units called joules (J) (technically, one joule results from passing a current of one ampere through a resistance of one ohm for one second). And when you transport one joule of energy through a channel (a wire, say) every second, the flow rate of energy is one joule per second. That amount is defined as one watt. In other words, 1 watt = 1 joule per second, just as 1 mph = 1 mile per hour when it comes to your car.
So, if a cop were to pull you over for using 400 joules per second, that would be like saying you were caught pushing 400 watts of electrical energy at that moment. Remember, this is a rate, so it does not necessarily tell you the total result of your actions, since you would also need to know length of time. There’s a big difference in terms of distance traveled between going 60 mph for one second and going 60 mph for four hours. However, knowing the rate lets you shop smarter for appliances, lighting, and other devices, because the higher the wattage of a device, the more energy it uses at any given moment. Similarly, the higher the wattage of a wind turbine, the faster it can produce energy.
In classical physics, wattage refers to power, which can be another confusing concept. That’s largely because, in common usage, people tend to use the words energy and power interchangeably. (In fact, you will even see that occasionally in this book, because there just aren’t enough synonyms to go around to make things readable. However, if we feel the difference between power and energy is important to understanding, we will use the terms precisely.)
So, what is the difference between energy and power? When it comes to the energy sector, you will see power represented in watts and energy represented in something called watt-hours, which we explain next.

Tech Stuff Technically, power is the rate at which work is performed. In the case of electrical work, we express that rate in joules per second. As you may know, “work” also applies to mechanical processes, in which case one joule is equal to the work done in applying a force of one newton through a distance of one meter (a newton is a measurement of force; technically, the amount needed to accelerate a one-kilogram mass at a rate of one meter per second). The amount of work done by a joule is sometimes approximated by the energy needed to lift a small apple one meter straight up, the amount of kinetic energy of a tennis ball moving at 14 mph (23 kph), or the energy released as heat by a person at rest every hundredth of a second.
Energy (Watt-Hours)
We save the most important measurement of all for last: energy. For the sake of making an important distinction, let’s continue the police car analogy. If we switch the rate of joules per second for miles per hour, we can observe a cop in an unmarked car following you as you speed at 400 joules per second on the highway at a constant speed. At the end of one hour, the police officer pulls over your car. Not only does he say that you were moving 400 joules per second (the rate), or 400 watts, you would have successfully moved this electrical energy for an hour, so we would say you used, or consumed, 400 watt-hours. Note that even though it has the word “hour” in it, a watt-hour is no longer a rate; it is an actual amount of something—and that something is what we call energy (Figure 3-3).

FIGURE 3-3 Weather station data is a valuable resource that aids smarter wind energy prospecting. Pictured are two aerovanes (right) and sonic anemometers (see Chapter 5). Warren Gretz/DOE/NREL.
The reason energy (watt-hours) is so much more important than power (watts) when it comes to wind systems is because energy is what actually provides what we want: light and the operation of electronics and machinery. Energy is what is bought and sold, not power. So when you look at your electric bill, the utility doesn’t really charge you by the rate; they charge you by how much energy you actually used, typically measured in kilowatt-hours. Kilo = 1,000, so that refers to how many hours you consumed at a thousand watts.
Here’s the basic formula:
Watts (the rate of energy generation, movement, or use)
× hours (time) = watt-hours (a quantity of energy)
Remember, light bulbs, microwaves, toasters, and TV sets are rated by watts, the rate at which the device consumes electricity. Even turbines are listed with rated power of performance at a certain number of kilowatts. Although we will soon explain that this alone is not a good way to evaluate the energy production of a turbine, it can be calculated if you know the volts and the rated amps. The formula for this is:
Volts × Amperes = Watts
For example, if you come across a turbine that is said to output 120 volts at 30 amps, the rated wattage would be 3,600 watts, or 3.6 kilowatts. However, if you don’t have a good wind resource, or your turbine isn’t installed and operating correctly, it doesn’t matter what the power rating is; it won’t produce any meaningful amount of energy, and it won’t “pay back” your investment. You earn credits from your utility, or drive operation of local loads, only by generating usable energy. And as you’ll soon see, peak or rated power tends to be a very poor predictor of actual energy production rates in real-world applications.
Here are a couple of discovery tools for you to further explore electrical energy and current. Please follow the instructions, and feel free to experiment with various variables.
Resources

Discover the Charge bit.ly/efield
Explore 3-D Electrostatic Activity bit.ly/3dfield
How Are Watts, Ohms, Amps, and Volts Related? amasci.com/elect/vwatt1.html

Hazard It’s worth noting that amps are the part of electricity that is most dangerous to your health. You can have 20,000 volts go through your body and leave you virtually unaffected (although your hair might stand on end). But it only takes 0.5 amp to do some serious damage to your body in a very short time.
Of course, it’s always important to stay safe when working with electricity, and this book alone is not enough to prepare you for doing all necessary wiring on a complete turbine system. Even certified electricians are sometimes hesitant to work on wind turbines, unless they have received hands-on training with the equipment. There is no substitute for real-world experience.
INTERCONNECT
From Failed Crop Farmer to Idaho’s First Successful Wind Farmer
For four decades, Bob Lewandowski and his family tried to scrape out a living as farmers on 20 acres of windswept plain between Boise and Mountain Home, Idaho. It was hard going. “I used to curse the wind,” Lewandowski told The Idaho Statesman in 2004. “Every time we put seed in the ground the wind would come up and blow it away.”
Lewandowski decided to try to put that steady wind to use. Literally betting the farm, he spent $120,000 to buy, ship, and refurbish three old 100-kilowatt turbines from a wind farm in California (Figure 3-4). Although Lewandowski had no formal training in the field, he did most of the work himself, raising the first 150-foot tower and even inventing some of his own performance-boosting repairs.

FIGURE 3-4 Bob Lewandowski installed and maintained these used 100-kilowatt wind turbines on his property outside Boise, Idaho. Today, the turbines serve as teaching aids for local colleges. Brian Clark Howard.
After four years and 19 permits, Lewandowski’s first turbine started spinning, and he began to sell power to an Idaho utility, becoming the first outfit to do so in a state that is ranked 13th in potential wind resource.
Lewandowski eventually got three turbines working, each providing enough power for 15 to 20 homes, and his wind farm was a success. He passed away in 2005, and a local company proved unable to keep the turbines working profitably, largely because the makeshift work Lewandowski did over the years required too much maintenance to keep going. However, the turbines were recently moved to the College of Southern Idaho and Idaho State University, where they now serve as teaching aides for the next generation of wind installers.
Lewandowski’s turbines were visible from a major highway across the West (Figure 3-5), and they inspired many people to consider the technology. Today, Idaho has several big wind farms, with more in development. Lewandowski showed how one man truly can build his own power plant, with a little ingenuity, elbow grease, and a relatively modest financial investment.

FIGURE 3-5 Lewandowski’s turbines provided enough power for up to 60 homes in total, making his small wind farm a success. He helped inspire the state of Idaho to launch several big wind projects. Brian Clark Howard.
Wind Energy Principles
Soon, we will help you begin an assessment of your site and your situation. But before we can begin, we need to go over some wind energy basics. In Chapter 1, we discussed where wind comes from. But what power is available in the wind if we were to cut a slice out of it and examine its properties? What variables affect how much energy a given turbine can actually harvest out of the wind?
Let’s call in an Energy Special Unit: Windy Acres, and use physical evidence to solve the invisible mysteries of wind energy.
Understanding Wind Speed Terminology
It turns out that most people are quite bad at estimating wind speed, especially when it comes to their own potential sites, where they tend to be overly optimistic about annual averages. In truth, wind speed varies a lot, depending on where you are and even what you are using it for. If you are on a boat or listening to weather reports, it is common to hear the term knots. “Aye aye, Captain, she is blowing at 3 knots.” But for the rest of us, at least in many countries, the standard measurement is metric, so wind is measured in meters per second (m/s). Within the U.S. market of small wind turbines, you will often see this standard interchanged with miles per hour. The following conversion shows the change from miles per hour to meters per second:
(1 mph / 3,600 sec) * (1.61 km / 1 mile) = 1 / 3600 * 1609.344 = 0.45 m/s
Therefore, there are 0.45 m/s for every mile per hour. We can approximate that there are about 2 miles per hour for every 1 meter per second, so any value on an analysis chart in meters per second can be doubled to get an approximate wind speed in miles per hour. For example, 6 m/s is approximately 12 mph. From now on, we will display speed as mph (m/s), so we can accommodate everyone.
There are three basic types of wind speed: (1) instantaneous, (2) average, (3) and peak. Luckily, these are relatively self-explanatory. Note that the least useful of the three is the instantaneous speed, or what the wind speed is at that moment. Wind does not come across your property like an extra-long power train. It is not a steady flow. It varies. You can sit all day and watch or measure the wind, and it won’t give you any idea of your wind resource. In fact, the only thing useful about measuring instantaneous wind might be to find out the peak wind speed.
Peak wind speed refers to the highest gust expected on a site. This is important because it gives us an idea of how strong a turbine system will need to be in order to withstand peak forces. Those who are new to wind energy might reasonably assume that the strategy should be to design a system that can withstand the strongest winds ever recorded. However, that is a little like asking for a car to be built to last for 100 years, or for a laptop battery that will power your computer for a month. Such overengineering is going to make the system too expensive, too heavy, and probably inefficient at normal operation.
Put bluntly, small wind turbines are not going to be designed to generate power from, or even to withstand, tornadoes and hurricanes—at least for the foreseeable future. Currently, most small turbines and towers are advertised to withstand winds of 120 mph (54 m/s). However, there are a number of variables that can be involved, including quality of installation and the nature of the site. Unfortunately, most manufacturers can’t afford to do a large sample of real-world failure tests, so there tends to be some extrapolation. We think that’s another good reason to go with a time-tested turbine design from a reputable company with a track record of thousands of successful installations.
The most crucial measure for wind systems, as you may have guessed by now, is the site’s average wind speed. This is because you need to know the average energy available over a specific period. What we need to start to evaluate is the percentage of time that wind flows at various speeds, or the wind distribution for the site.

Power Up! Unless you are running a remote Antarctic or mountain research base (Figure 3-6), places with livable human conditions tend to see average wind speeds within the range from 0 to 15 mph (0 to 6.75 m/s). Residential sites and farms might see a range of 7 to 12 mph (2.8 to 5.4 m/s), and urban regions usually see less than that.

FIGURE 3-6 This research station in Antarctica is powered by a wind turbine, solar panels, and a diesel generator. Northern Power Systems/DOE/NREL.
The Basic Wind Energy Formula
Now, we give you the core of the formula that is really the holy grail of wind energy, and which is arguably the most important equation in this book (Figure 3-7). This brief formula can bring you closer in your journey of producing your own energy, or it can be used as a shield of defense against the marketing wizards that will dazzle you with numbers that, with a little education, do not add up.
Power = k CP 1/2 ρ A V3
where
P = Power output, kilowatts
Cp = Maximum power coefficient, ranging from 0.25 to 0.45, dimensionless (theoretical maximum = 0.59)
ρ = Air density, lb/ft3
A = Rotor swept area, ft2 or πD2/4 (D is the rotor diameter in feet, π = 3.141)
V = Wind speed, mph
k = 0.000133; a constant to yield power in kilowatts. (Multiplying the above kilowatt answer by 1.340 converts it to horsepower [i.e., 1 kW = 1.340 horsepower].)
FIGURE 3-7 Arguably the most important equation in wind energy. Kevin Shea.
Power
So, what does the wind formula mean and how does it work? The P stands for power. You want to know the instantaneous power that your turbine is going to collect. As we stated previously, unlike energy, which is measured in watt-hours, power is measured in watts, the rate of energy flow. So, power equals watts. And what determines the power available to your turbine as the wind hits your blades is air density (D) and the swept area (A).
Air Density (D)
All air has density, just as solids and liquids do, although it’s not a property we often associate with air, unless we go mountain climbing. Density is simply mass (measured in kilograms, kg) per unit volume (measured in m3, meters cubed). At sea level with a temperature of 60 degrees Fahrenheit (15 degrees Celsius), the Earth’s air has a density of 1.225 kg/m3. Why did we provide all those conditions? Because, as you will see, air density matters in how well your turbine will perform.
When air molecules are more tightly packed, meaning they have greater density, they inflict more force when they move past your turbine’s blades. Let us illustrate by asking which would place more force on your face, a “pancake” of whipped cream or the pie that it was on? If you’re talking about a turbine, you’d prefer the pie. With higher density comes more energy.
Can we increase the air density? With all other factors remaining the same, lower elevation will have greater air density, because there is more “weight” of air above. That means lower elevations will have more potential wind energy available. For every 1,000 feet in elevation you climb, you can harvest 3 percent less energy with a wind turbine. So at 10,000 feet, you are left with 30 percent less potential energy. (At 10,000 feet, you will also probably notice that the air is a bit “harder” to breathe, because it is less dense.)
In addition, temperature affects air density. Specifically, air is denser when it is cold. That’s because the molecules are packed closer together. That means there is more energy available out of cold air. In most temperate areas, this is an added benefit in the winter. Winter brings you more potential energy when you are typically inside more, using more of it. Then summer comes and the air is thinner, so there is less energy.
It’s instructive to understand the relationships of elevation and temperature to wind energy, but for most purposes these variables are not really very important, and will rarely make or break a project. So if you live in a warm climate and up on a high mountain, don’t move just yet. All is not lost. In fact, many productive wind farms are being installed on mountain ridges around the world, often even near the equator.
Swept Area (A)
The single most important factor of performance of a wind turbine that we have total control over is the swept area, the area that the blades sweep as they rotate (in a circled plain). You could periscope a tower thousands of feet into the air to get into the ceaseless trade winds above, but unless you have an adequate collector size, you are not maximizing the potential energy available. And the math is simple. If you double the swept area, you double the size of the pie that will hit the turbine, subsequently increasing the power. Yummy. But don’t stop reading, there’s more.
To continue we need to mix squares and circles for a moment. Swept area is measured in square feet or square meters. But it is a circle. To calculate the swept area, you need to use the formula for an area of a circle, which you may remember from high school geometry: the square of half the circle’s diameter (the radius) multiplied by p (roughly 3.14).
Area = π(D/2)2
What you will find is that as you double the length of the blade, you quadruple the swept area! Congratulations. With adding a little length to your blades, you increase the amount of energy you can harvest by a lot. At this point, you should have a good idea why commercial wind turbines keep getting bigger and bigger: the larger the swept area, the more energy that can be produced, and the relationship is exponential.
Now with vertical axis wind turbines, the swept area is not measured in quite the same way. If you were to take a picture of a VAWT, on the photo, you could draw an outline around the rotor, and you will see that its area is more of a square (Figure 3-8). Accordingly, the swept area would seem to be width times height (W × H). Right? Wrong! If the wind is hitting the entire square swept area, it is not only hitting the blades that are turning away from the wind, but also the blades that are returning against the wind. Hence, your swept area would be half the width. And you can’t say that the swept area is all around the vertical axis turbine, either. If the force of wind were coming from any other direction at the same time, it might push the rotor in the opposite direction, right? Is this physics defied? No, but then that is one of the reasons why vertical axis turbines are made to be tall, to compensate for all the energy that is being wasted.

FIGURE 3-8 A Windspire 1 kW vertical axis wind turbine (left) and monitoring tower at the National Wind Technology Center (NWTC) in Golden, Colorado. Amy Bowen/DOE/NREL.
Now that you have bigger blades, you don’t have to move. Problem solved. You just have to add a few feet to your blades, and you will be in action. Now, just one more thing to look at: the wind speed.
Wind Speed Cubed
Here comes the final ingredient, which also has the most dramatic effect on the power available for your turbine: wind speed. And guess what, you can control the speed … sort of. We will get to that when we start talking about site evaluation and towers in Chapter 4. But we’ll give you a hint: height matters.
The power available in the wind relates to the cube of the wind speed (V3 or V × V × V). What exactly does this mean? Let us show you in Table 3-1.
TABLE 3-1 Available Power in Winds of Increasing Speed

Notice a pattern: Every time you double the wind velocity, you don’t just double the energy available; you increase the potential energy eight times. The reason we showed so many numbers is to illustrate the enormous change in energy. Do you realize that when your wind velocity increases from 0 to 8 mph, you have already increased the energy available over 512 times, or 2,400 percent? Wow!
Power Up! This leads to an important point. If the power increases exponentially as the wind goes faster, that means we also are losing that enormous resource when the wind is slow. The rotor will spin, but it won’t be producing much more than the heat on the bearing. So, when someone is trying to sell you a wind turbine that is designed to “capture wind energy at low wind speeds,” realize that you will necessarily see only tiny amounts of energy at those speeds. Unless the wind turbine is somehow eight times more affordable, it may be wise to avoid them.
“If someone tells me that their turbine can start producing energy in very low winds, I say so what,” small-wind author and expert Paul Gipe put it bluntly. “There is so little energy available in low wind speeds that it is essentially worthless. Having something spin around doesn’t change that,” he told us. Author Ian Woofenden warned, “The fact that wind energy is a cubic relationship is something people repeatedly overlook.”
But wait, isn’t wind speed one of the factors that we can’t change unless we change our location? Does that mean I am stuck with my average wind speed unless global climate change improves my condition? Yes and no. You can change the location of your turbine … if you build a taller tower. Even though it is true that the air density gets less as we go higher, the higher wind speeds we see more than compensate, largely because of the cubic relationship. If you could afford to go up 10 feet you might gain 1 mph, and that would translate to 30 percent more available energy. Wouldn’t you say that it is worth it? As Paul Gipe said, “If you want clean energy that helps save the planet, you need to make energy.”
When is too much of a good thing bad? You noticed we didn’t list very high wind speeds, like, say, 40 miles an hour and above. There’s a good reason for that. Believe it or not, mad scientists design the system to protect the wind generator from such speeds, so normally the turbines are battening down the hatches when the wind is impeding on your walking. What, you ask? Wouldn’t we want to collect all of the energy?
Whoa, there, thrill-seeker. Engineers are currently developing systems to tap into this region; however, there are two good reasons why there is not much feasibility yet: weight and frequency. First of all, what good is a dead turbine? All that energy in strong winds is going to affect the machine. If you were creating a turbine dragster that was to work only a few times, you might be able to get away with operating at high speeds.
Wisely, most manufacturers aim to make products that will harness wind energy for a very long time (this is especially important if you want to see any kind of payback on your investment). To design a machine that would work through harsh winds would take some very heavy duty stuff. This would tend to make the whole system bulkier and heavier, and consequently less responsive to moderate winds, because it would take more wind energy to push the blades. It would also make it more expensive.
Wind Distribution
The next reason for mitigating the effects of very high winds is their relative frequency.3 As you know, the strength of wind varies, and an average value for a given location does not alone indicate the amount of energy a wind turbine could produce there. Frequency does. Again, if we lived in that place where the wind speed was constant at 40 mph, the speed at which walking in the street is impeded, think how different life would be. We’re thinking not much outside playtime, and some serious eye goggles and Kevlar clothing to protect us from light projectiles every time we are outside. But alas, such high winds are not commonplace. In fact, as we can show, they generally occur less than 2 percent of the time.
To better assess the frequency of wind speeds at a particular location, especially when comprehensive data is unavailable, installers often run sampled data through a probability distribution function, such as that found in the Weibull distribution model and its companion, the Rayleigh distribution model (Figure 3-9). These models describe the range of possible values that a random variable, like our reliable friend the wind, can attain and the probability that the value of the variable is within any subset of that range. These models describe wind speed variability mathematically in an attempt to approximate the real world. Different locations may have different wind speed distributions, based on the average wind speed, elevation, latitude, and other factors, but they all mirror a bell-shaped curve.

FIGURE 3-9 Distribution of wind speed (black) and energy generated (gray) in 2002 at the Lee Ranch test facility in New Mexico. The histogram shows measured data, while the curve is the Raleigh model distribution for the same average wind speed. Wikimedia Commons.
In 2002, Sandia National Laboratories commissioned a wind study at Lee Ranch in New Mexico.4 The results, summarized in Figure 3-9, give an idea of wind distribution in many terrestrial locations. The gray bars represent the wind energy available, measured in the number of megawatt-hours, at a particular wind speed over a year. The black bars represent the number of hours that a specific wind speed was recorded. Picture these like stacks of coins. For every second, data received is a measurement of the amount of energy produced and the wind speed that produced it. A coin could be placed in the corresponding columns for every measurement.
For example, you can see that not many black coins (frequency) were placed in the black column for 20 mph. Barely a few hours. Yet, it produced a stack of gray coins (megawatts available), equating to 100 megawatts from those infrequent wind bursts. Contrarily, you can see this location recorded over 500 hours of wind at 5 mph. That appears to be nearly 500 times more frequent than at 20 mph. Yet, the energy available was nearly equal. That is the reason that most reputable professionals and manufacturers don’t attempt to market a wind turbine that has a “cut-in speed” of less than 7 mph. Frequency alone doesn’t always equate energy.
On the other hand, it appears evident from the chart that half of the energy available arrived in just 15 percent of the operating time, at around 8 to 20 mph (3/6 to 9 m/s).5 Bring back that question of building a turbine to handle the stronger winds; if you designed a machine to handle the wind speeds above 20 mph that arrive only 2 percent of the operating time, its weight would tend to make the turbine less responsive in lower speeds, subsequently returning lower potential energy.
So, hopefully you can see that the best solution is usually to design a wind turbine that harvests the sweet spot of wind that is relatively frequent and also provides a useful amount of energy. In the future, with more data available for particular areas and more advanced technology, it might be possible to more fully customize a turbine, sort of like how sports shoes have become highly specialized based on activities. But for now, most turbines work within the range of moderate winds.
Let’s return to calculating the potential wind energy using what we now know about wind speed distribution. We have discussed air density, swept area, and wind speed. We understand that the potential energy is proportional to the wind velocity cubed (V3). But if it is true that every location with the same wind speed can have a different wind distribution, wouldn’t that result in different power available?
For example, let’s say that a property in Long Island, New York, has the same average wind speed as a property in Ostional, Nicaragua. However, Long Island has more volatility in its wind speed distribution, as it is in the path of trade winds during the winter, which pack a powerful punch. In contrast, Ostional doesn’t have those fluctuations, due to the constant prevailing winds from nearby Lake Nicaragua. These steady winds produce less power over time than the temperate region. How can the formula for power availability take into account those differences?
That requires us to average the cube of all different wind speeds over time in a distribution chart. Remember those coins in the black columns? If you cube the wind speed (V3) for each time there is a coin in each black column, then divide it by the total number of coins, you will get an average that better estimates the projected annual energy availability.
Power Up! Meteorologists have characterized the distribution of wind speeds for many of the world’s wind regions. With their results, they were able to determine that if you live in a temperate zone like the United States and Europe, the current Rayleigh wind speed distributions offer a good approximation, so it won’t require extra work. In fact, a study of small wind turbine performance (Figure 3-10) found the AEO (annual energy output) estimates based on the Rayleigh wind speed distribution to be only 5 percent less than what was actually produced in the field, according to Paul Gipe in his 2004 book, Wind Power (Chelsea Green).

FIGURE 3-10 Jim Johnson, a senior engineer at NREL’s National Wind Technology Center in Colorado, conducts research on large and small wind turbines to make them more effective. Scott Bryant Photography/DOE/NREL.
Applying the Wind Equation
Tech Stuff Let’s sum up the wind formula with an example. We explored effects on the amount of power available from air density, the swept area, and the average wind speed. If we would like to know the average annual power available to a particular site that is at sea level, with average temperature 60 degrees Fahrenheit, average wind speed of 9 mph (4 m/s), and a blade diameter of 12 feet (3.65 m), we would grab our handy equation and plug in the numbers.
For less confusion, we will use the symbol ρa in place of D for the air density. Please remember to convert feet to meters and miles per hour to meters per second.
P = ρa × π(D/2)2 × V3 = ½ (1.225kg/m3) × π(3.65m/2)2 (4 × 4 × 4) = .6125 × 3.33 × 64 = 130 watts/m2
Let’s now make energy from power, or take instantaneous wattage, and let the clock spin forward so that we can take a peek at your future electric bill, or your credit. Now if we carry this average over 24 hours, 365 days a year (24 × 3,365 = 8,760 hours), you will get the grand total estimate of 1,138 kilowatt-hours/m2 for the annual wind energy density.
What more can you want? More power? More energy? That is next.
Wind Speed, Power, and Height
Here comes a key factor that can strongly increase the amount of energy your system can generate, but which is most often sacrificed by small turbine owners during the decision process. Let us tell you the general rule so you can get your dessert first, before diving into another equation.
• Wind speed and wind power are both affected by height.
• Doubling the height increases the wind speed by as much as 10 percent.
• This increases the wind power available by as much as 25 percent.
• Increasing the tower height five times doubles the wind power available (200 percent).
Now, back to formula basics: If velocity is V and height is H, we need to determine the effects if both of these are expected to change. So if we are changing our original height (HO) at our original average wind velocity (VO) to a new height (H), we should expect an increased wind speed (V) at our new height.
If the formula were as simple as:
V/VO = H/HO
it would suggest that there exists a linear relationship, or a 1 to 1 ratio. For example, if we wondered how much the wind speed would increase, if we measured the original average wind speed to be 10 mph (4.5 m/s) at 33 feet (10 m), and we doubled the height to 66 feet (20 m), the equation would look like this:
(in mph) V/10 = 66/33, or (in m/s) V/4.5 = 20/10
The new wind speed would be 20 mph (9 m/s), and that would suggest that doubling the height doubles the wind speed. But something is being overlooked—the environment around us.
The reason that wind speed increases as we move up into the atmosphere is because there are fewer obstacles and less friction to disrupt the wind. As air rushes past the Earth’s surface, it encounters resistance due to friction, which is called ground drag. This effect slows down the wind, all the way to a height of about 1,650 feet above the surface. Perhaps not surprisingly, the greatest slowdown occurs closest to the ground. Over an essentially flat surface, wind is most slowed by friction for the first 60 feet of height. The rougher the surface, the higher the effects persist.
If you were standing on a grassy plain and measured a 20-mile-per-hour wind at 1,000 feet above the surface, it would likely be at only 5 miles per hour at 10 feet. This difference in wind speed with height is often called the wind gradient. Some writers also call it wind shear, although we find that designation a bit confusing because wind shear can also refer to a related concept.
To pilots and meteorologists, wind shear refers to a change in wind speed or direction over a relatively short distance. Wind shear is closely related to turbulence, and often causes it. Many factors produce wind shear, including smog, differences in atmospheric temperature, the wake of jetliners, or terrain features, including mountains and forests. In general, the rougher the surface, the higher the wind shear. That can be dangerous, even deadly, to pilots, and it usually means more turbulence and less recoverable energy for wind prospectors (Figure 3-11).

FIGURE 3-11 A Bergey small wind turbine outfitted for field study by NREL, which is measuring wind speeds upwind and in the tail wake, tower bending, yaw rate, torque, blade bending, rotor speed, and other variables. Dave Corbus/DOE/NREL.
The combination of wind shear and ground drag means that wind speeds are fastest over water and ice, then flat ground, then bumpy terrain. The next chapter covers ways to evaluate your site.
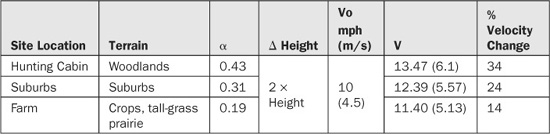
Tech Stuff The rate at which wind speeds increase with height can be estimated for various types of terrain with a value called the wind shear exponent, α. The lower the number, the less rough the surface, and the less dramatic the effect of increasing height. We show you how to calculate the wind shear exponent in Chapter 5, but suffice it to say that it is derived from another variable called surface roughness: the sum of the effects of vegetation and topography. Table 3-2 shows wind shear exponents for the three main types of terrain that you may consider putting a small wind turbine on. Note that the values range from 0.43 for woodlands to 0.19 to flat prairie. (See a longer list in Chapter 5.)
TABLE 3-2 Wind Shear Exponents (α) for Various Types of Terrain and the Associated Effect on Wind Velocity with Changing Height
Including this factor, the formula will change to look more like this:
V/Vo = (H/Ho)α
And since we are solely interested in calculating the unknown wind speed (V), it would be finely tuned to look like this:
V = (H/Ho)α * Vo
Notice that the change in height is multiplied by a fractional exponential.
So, if you are still with us, consider the same increase at three different scenarios for common installations: (1) in woodlands for a cabin, (2) on property in the suburbs, and (3) on a farm. In all three cases, we are doubling the elevation.
Do you want to calculate in fractional exponents? If so, it is easy. Get your handy calculator and type in the change in 2, then select the “to the power” symbol that looks like this “^”, then type in the α value earlier, and then press the equal button. If your calculator can’t do that, here are some links.
Resources
Online Fractional Exponent Calculator bit.ly/fractexpo
Android calculator bit.ly/androidcalc
iPhone/iPad/iPod calculator bit.ly/iphonecalcapp
These results, as summarized in Figure 3-12, show that any doubling of the height will significantly increase the wind speed. Moreover, the more surface roughness present at the original height—as represented by the wind shear exponent—the more dramatic the effect.

FIGURE 3-12 Wind speed increases dramatically with height. U.S. Coast Guard.
But, let’s bring it back to what you really want to know: how much more power (P) is available? (Just when you thought we were done with this equation.) First, we showed the basic equation; then we added the important wind shear exponent (α). Now, we are going to convert all of this into power.
Air density and the swept area are assumed to remain constant in this equation. In order to determine the power increase, we equate the power available (P) to the cube of velocity, where Po is the power at the original height of 33 feet and P is the power at the new height of 66 feet. For this example, consider a large area with a cut lawn—wind shear coefficient of 0.14.

Doubling the tower height increases the power availability nearly a third! Just for kicks, what if we were to increase it to a 100-foot tower? That is three times the height. Just change the 2 to 3. The result is 1.57 Po. This suggests that by tripling the tower we can increase the power available over 50 percent. This is an enormous change. Figure 3-12 graphically represents how increasing height increases the power in the wind.
Now, a little caveat here to our fun to ground us all. The increase in power with height is a rule of thumb. Remember the discussion that we had about wind speed distribution, where the average wind speed varies? This is for the location, including elevation, where your turbine currently is set. Well, as you increase the tower height above rough terrain, the wind is less impeded, turbulence decreases, and wind speed increases. This means the average annual wind speed will increase. So, not only does the overall power density intensify, but it also increases the accumulative energy production.
Super Power vs. Super Energy: Annual Energy Output (AEO)
Now that we have spent some time covering power, it is time to look more closely at energy, which we have already pointed out should be much more important to you.
One of the first things you will see on the specifications of wind turbines will be rated power, accompanied with a power curve. In this section, we will familiarize you with these concepts, and introduce the energy curve as a better tool to predict turbine performance.
As we stated earlier in this chapter, the difference between power and energy is fundamental. Power (watts) is the instantaneous view of potential energy. It is that framed picture of energy we hope to see. Energy (watt-hours) is the accumulation of that power used or generated—it is the motion picture made from all of those frames. When you pay your utility bill, you are paying for the amount of energy consumed in time. You are particularly interested in 8,760 hours, the number of hours that are in a year. This is commonly referred to as the annual energy output (AEO).
Tech Stuff Consider a micro-turbine that has a swept area of 1 m2 (10 ft2). Input a modest wind speed of 4.5 meters per second (10 mph). Remembering that there are 1,000 watts per kilowatt, then energy can be roughly determined from the power (P) in a specified time (t) like this:
E = P(t)
If we want to determine the energy output for the year, it is provided here (in meters):
AEO = [½ Air Density × Swept Area (m2) × Average Wind Velocity(V)3 / 1,000 watts] × [hrs/yr]
AEO = (1.225/2) × 1m2 × (4.5 m × 4.5 m × 4.5 m)]/1,000 watts per kW × (8760 h)
AEO = 0.6125 × .09113 kW/m2 × 8,760 h = 798.3 kWh/m2
If we want to calculate with feet, not meters, we can grab a formula that makes it even simpler:
AEO = 0.6125 × [Swept Area (ft2)] × [Average Wind Velocity (mph)]3/1,000 watts × (8,760 h)
AEO = 0.6125 × [10ft2] × [10(mph)]3 / 1,000 × (8,760 h)
AEO = 5,365.5 kWh/ft2/year
So, if all conditions remain the same, this micro-turbine can generate nearly 800 kilowatt-hours annually for every square meter, or 80 kilowatt-hours per square foot.
So, we can produce that much energy per year?! Uh, not quite. It is just about physics. Read on if you dare.
Powering Down: Losing 40 Percent of the Betz
That is not a misspelling of “bets.” It’s a person’s name, and it explains the limits of wind power.
A turbine cannot extract all the energy from the wind passing through the rotor because of the simple fact that to absorb all the energy, it would have to be a solid disk (Figure 3-13). In this way, it would act no different than a brick wall. Brick walls don’t currently rotate or harness energy for our consumption. In fact, the rotor needs the spaces in between the blades to cause it to rotate. If there are too many blades closing up the open spaces, some portion of the wind would deflect around the swept area, or put enormous force on the rotor. This is largely why Charles F. Brush’s massive 144-blade turbine produced so little energy in the 1880s (see Chapter 1). It is a delicate balance to maximize the use of the wind energy as it passes the blades.

FIGURE 3-13 This 10-kW Abundant Renewable Energy 442 catches the wind at NREL’s National Wind Technology Center in Colorado. Lee Jay Fingersh/DOE/NREL.
In 1919, German physicist Albert Betz established a theoretical limit on wind turbine efficiency, claiming that no turbine can capture more than 59.3 percent of the potential energy available in the wind. This value is often called the Betz coefficient or Betz limit.
To add pain to punishment, this ideal limit can only be reached with a rotor without a hub and massless blades. Haven’t seen anything like that around, have you? No research has emerged since, or designs have been tested, that contradict the Betz limit. In fact, some studies have resulted in less flattering percentages.
So, this loss in power subsequently reduces our potential energy output by at least 40 percent just at the rotor. Today’s best commercial turbines are approaching the Betz limit thanks to sophisticated, computer-managed active controls and hightech materials, though small turbines aren’t quite so efficient. Plus, we still need to convert the mechanical energy into usable electrical energy before we can speak in terms of actual kilowatt-hours. The remaining energy is processed through a turbine generator, rectifier, inverter, controller components, sensors, and even any batteries, all of which add up to take up to an additional 40 percent from the net energy (59 percent) harnessed.
In fact, the most effective turbines today of all sizes have approached only a 35 percent total efficiency rating by the time the power is released. Calculating this from our previous example is simple enough.
798.3 kWh/m2 × .35 = 279.4 kWh/m2
So, at 10 mph (4.5 m/s) we should be receiving roughly less than one-third kilowatt per squared meter (10 squared feet). With an average American house consuming 10,000 kilowatt-hours per year, that would mean about 3 percent of a typical home’s usage would be provided by this micro-turbine. For all the spinning, it doesn’t seem like it is cutting it.
Now you can blame the rotor, you can blame the generator, and all the other components that might drain some of the energy before it gets delivered. But before you do that, let’s take a look at how other energy conversion devices are doing.
Converting one energy source into another always causes some loss. Table 3-3 illustrates the approximate conversion efficiency of several common energy sources into alternating current.
TABLE 3-3 Energy Conversion Efficiencies for Various Generating Technologies

For this table, we are referencing technology that is out of the lab and in production. And as the table specifies, this is conversion efficiency to alternating current. In the case of solar, it has a relatively high conversion efficiency to DC power, but common energy consumption is alternating current, so as with wind technology, it sees comparative losses during conversion.
On balance, wind turbines fare relatively well compared to other resources when it comes to efficiency. And in the data in the table, the energy required to make or transport the continual supply of fuel (natural gas, oil, coal, hydrogen) was not factored in.
But why stop there? Let’s also take a look at the conversion efficiencies of common devices and natural phenomena (Table 3-4).
TABLE 3-4 Energy Conversion Efficiencies for Processes
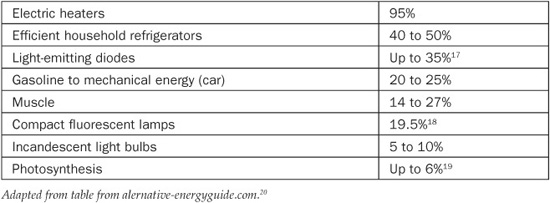
All processes have a loss when they convert one form of energy into another. The traditional incandescent light bulb has an efficiency as low as 5 percent to produce light, although you get a whopping 95 percent efficiency to produce heat.
Summary
We started this chapter with a review of electrical concepts that set the table for the serving of a few wind principles. Next, in our search for the power in the wind, not only did we find multiple factors determining what is available, but we also encountered limits and losses during the conversion of wind energy to household electricity.
While estimating what a wind turbine will produce, and noting that it might not be enough juice for your site, it may be helpful to know the three ways to increase output, listed in order of descending priority:
1. Increase wind speed.
2. Increase swept area.
3. Improve the wind turbine’s conversion efficiency.
You may increase the wind speed by either selecting a better site with higher average wind speed or building a higher tower. In the next chapter, we will help you evaluate your specific site. With those resources, you will be able to determine the minimum height necessary to maximize whatever turbine you ultimately select. In a later chapter we will take a personal assessment, and you will have to reconsider if a high tower is practical for you.
Once you have the optimal site and height, you can consider the size of the swept area. We touched on the concept here, but in Chapter 8 we will cover the swept area of specific models. So you can begin to try on a few models and see if one fits your energy goals.
The third option is really a recommendation that you find a turbine that is the most efficient for the value. Some manufacturers have been accused of making outrageous claims of performance. You have been provided a tool to test their claims. Chapter 8 will better prepare you for this. But, know that it is important to understand what many overlook—energy output is most sensitive to wind speed and swept area. So, before you try to find a turbine that claims to beat the Betz limit, don’t underestimate the value of reliability and cost-effectiveness.