CHAPTER THREE
WAREHOUSE PERFORMANCE, COST, AND VALUE MEASURES
3.2 Workforce Facing Metrics: A Great Place to Work
3.4 Shareholder-Facing Metrics
3.5 Warehouse Performance Gap Analysis
In our RightScores methodology, we treat the warehouse like a business. Businesses compete on the basis of financial, productivity, utilization, quality, and cycle-time performance. They are also accountable to serve their employees with a great place to work, their customers with excellent customer service, and their shareholders with excellent returns relative to risk. Accordingly, this chapter on warehouse performance measurement shares guiding measurement principles, workforce metrics, customer service metrics, shareholder performance metrics, and techniques for utilizing those performance metrics in warehouse project justification.
3.1 RightScores Principles
RightScores is our performance-measurement model. The model is based on seven key principles of performance measurement. I will explain these principles briefly and then apply them to warehousing.
1. Servant leadership. The heart of the RightScores model is service. Our model encourages serving employees with a great place to work, serving customers with excellent customer service, and serving shareholders with excellent financial performance. Accordingly, RightScores’ metrics face three way: Employee-facing metrics include safety and turnover. Customer-facing metrics include accuracy, cycle time, and on-time performance. Shareholder-facing metrics include cost, productivity, and utilization.
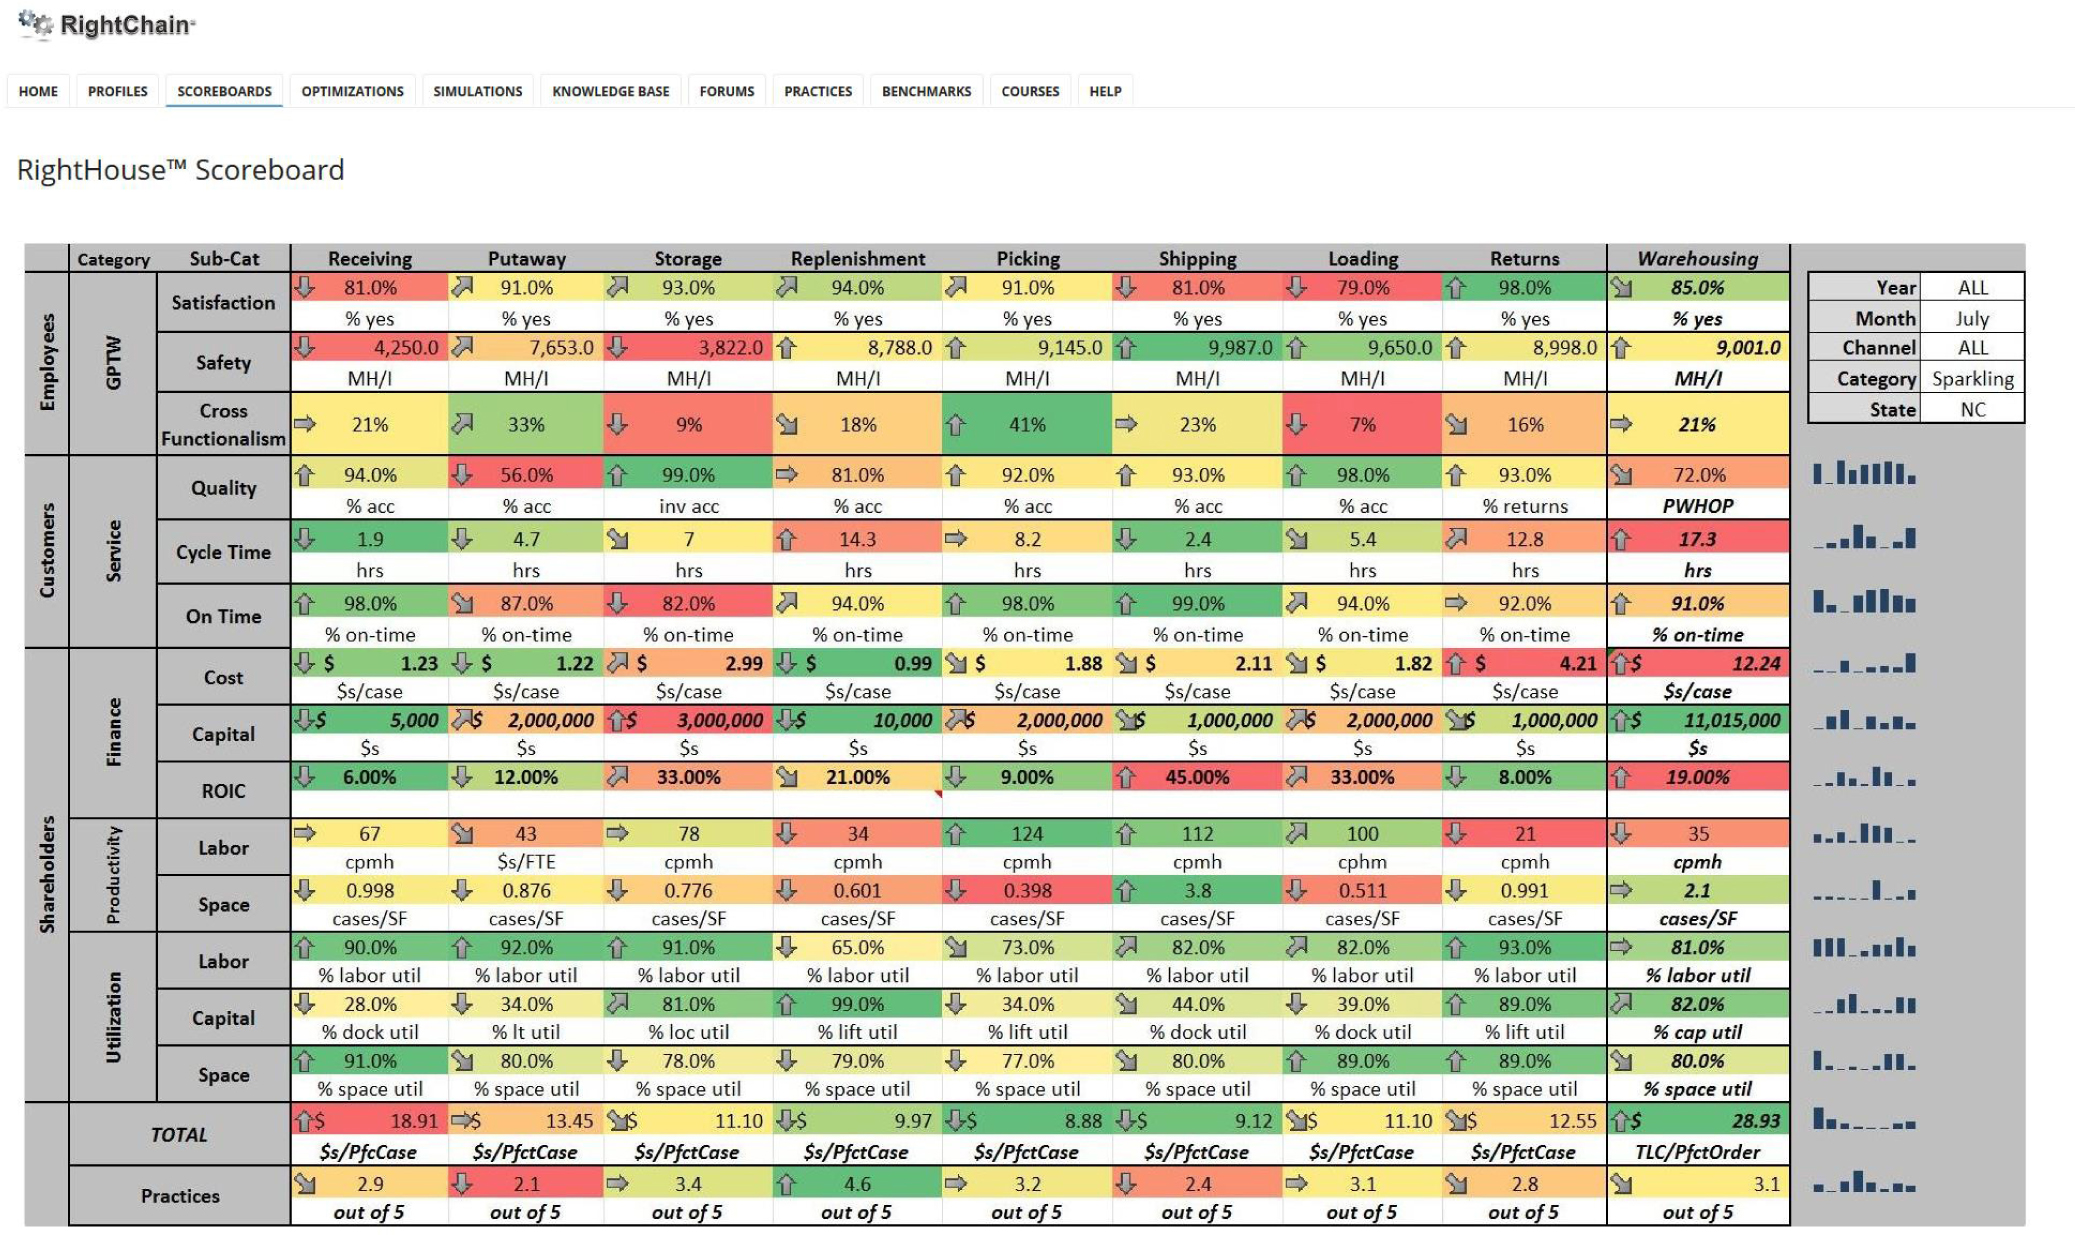
2. Span the flow. In a supply chain, the flow of materials, information, and money connects suppliers and customers through production, purchasing, inbound transportation, warehousing, outbound transportation, and customer delivery (Figure 3.1). In warehousing, the flow typically moves from receiving, to put-away, to storage, to picking, to shipping. This flow of connected activities organizes the columns of metrics on our RightHouse Scoreboard (Figure 3.2).
Figure 3.1 RightChain™ Scoreboard.
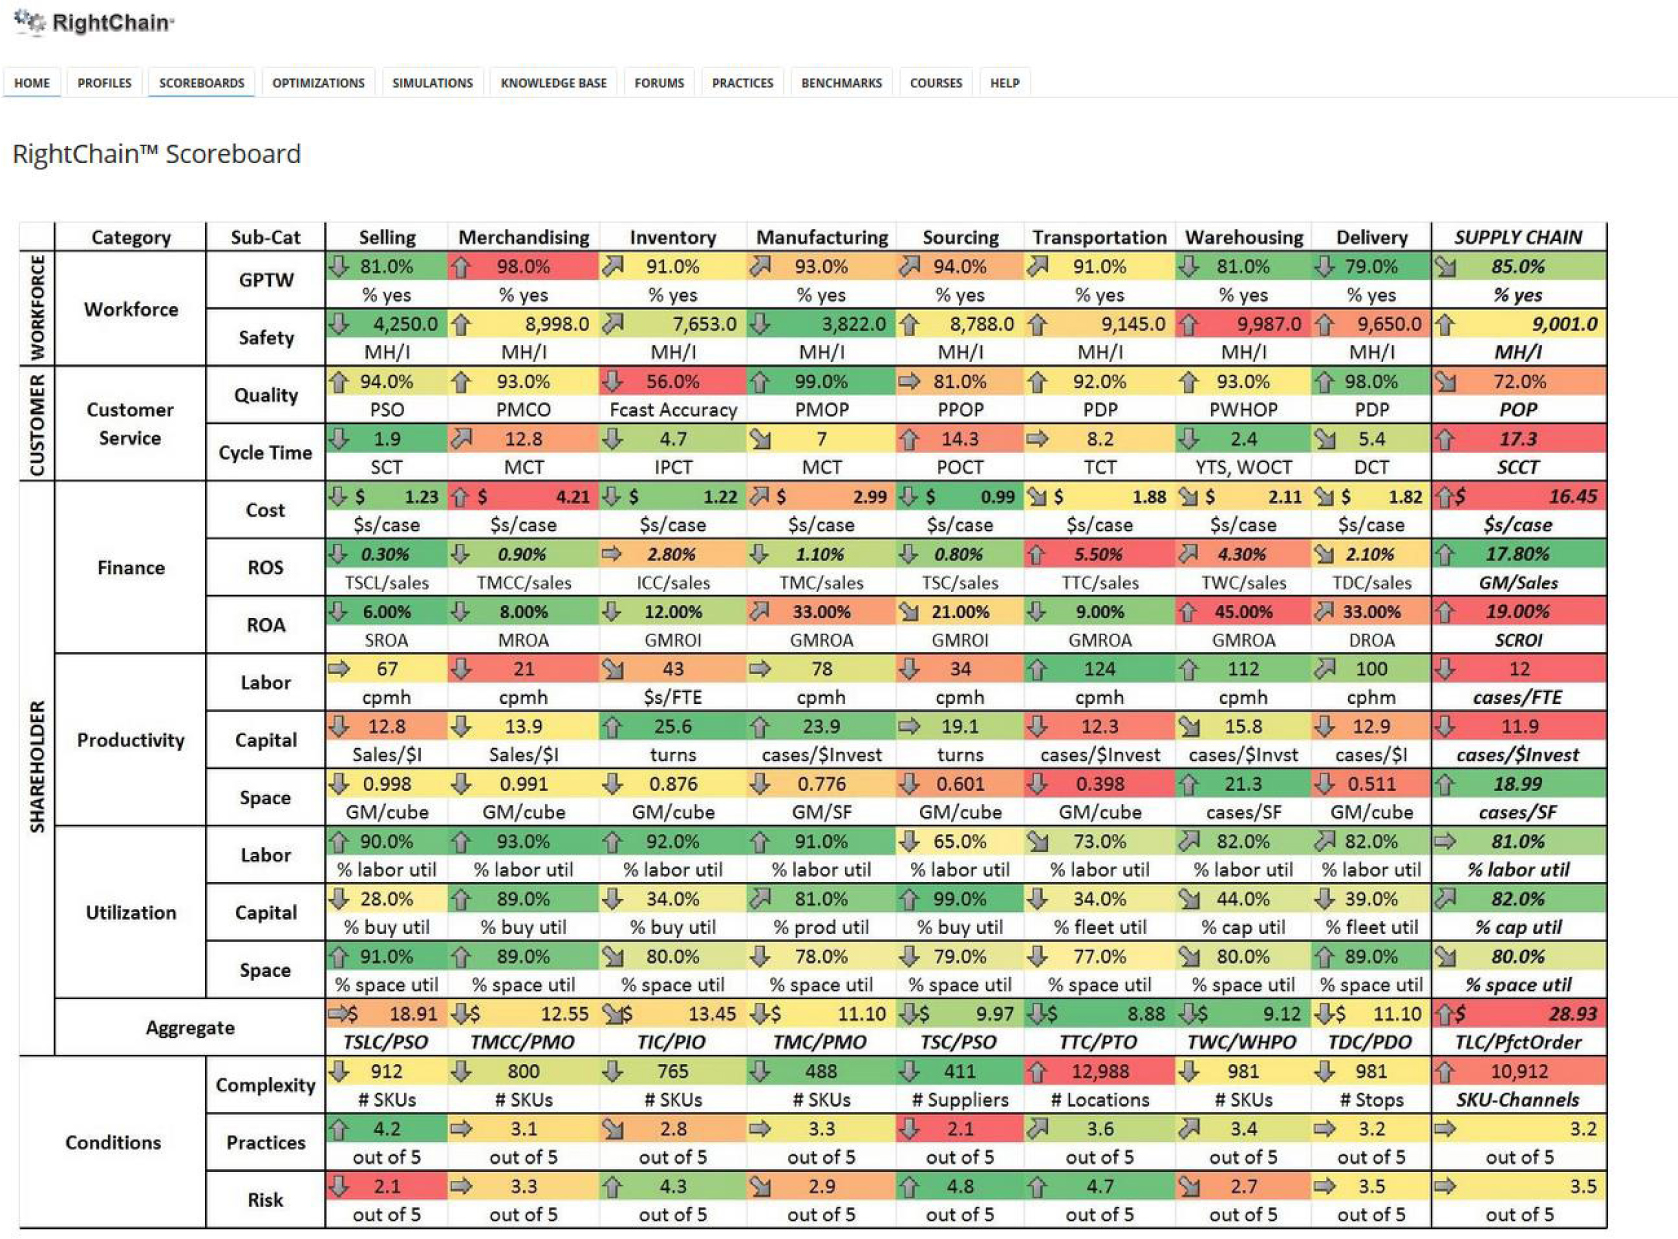
Figure 3.2 RightHouse Scoreboard summary screen.
3. Red, yellow, green. We recently completed a warehouse performance and practices assessment for the U.S. Army. The Army was pleased with all the aspects of the assessment except one—RYG. To be honest, I did not know what the acronym meant, so I asked. The representative explained that RYG is simply “red-yellow-green” and that it is a critical aspect of the presentation of the Army’s indicators. When I pressed further, the representative explained that in battle, military personnel may be trying to understand an assessment with little to no sleep, little to no food, and with bullets flying around. In trying to make good, quick decisions under those circumstances, it is helpful to simply know if things are okay (green), in trouble (red), or somewhere in between (yellow).
4. For better or worse. Trending indicators of improving or declining performance are another useful feature in metrics presentations. We use directional arrows in each metrics cell to illustrate trending.
5. Down and down we go. Our RightHouse Scoreboard allows users to drill down to a specific warehouse, to a specific activity in a specific warehouse, and to a specific operator in a specific activity in a specific warehouse, Results are filtered by month, location, and channel of business.
6. Practice makes perfect. Warehouses perform the way they practice. Accordingly, our RightHouse Scoreboard reports a practice score for each warehouse activity.
7. Sum the whole. The metrics either add or multiply across the activities to indicate the overall performance of the warehouse.
3.2 Workforce Facing Metrics: A Great Place to Work
A great place to work is safe, operates with a high cross-functional percentage, operates with a healthy operator-to-supervisor ratio, and is evidenced by a high retention rate of high-performance workers.
There are two basic reasons why workers leave for another workplace: they feel unsafe and/or they feel undervalued. Physical safety is the most basic provision organizations for their warehouse workforce. Two very simple measures provide of warehouse safety are the personnel-hours worked between each accident and the personnel-hours worked between each recordable accident. We monitor both for each warehouse activity and for the warehouse as a whole.
Cross-Functionalism
Another reason workers leave is boredom and injury due to repetitive tasks. By educating and encouraging workers to qualify for and work in multiple functions, boredom and repetitive tasks are minimized, and overall staffing requirements are reduced. Cross-functionalism measures the percent of operators who are trained to work in multiple functions.
Operator-to-Supervisor Ratio
Several years ago, a crazy idea called self-directed work teams crept into business buzzword vernacular. The implementers quickly rediscovered that teams need direction. There is an optimal level of direction for any activity, including each warehouse activity. In our benchmarking research, we have found that an operator-to-supervisor ratio between 8 and 12 yields optimal performance.
Retention
In our annual survey of concerns for warehouse managers the top two primary concerns have always been the same—turnover and aging (Figure 3.3). The impact of turnover on warehouse productivity and quality is grossly underestimated. In our recent survey, we correlated turnover rates with our Warehouse Quality Index (WQI). The correlation is strong and unmistakable. Retention of high-performing warehouse operators is one of the common denominators in world-class warehousing operations (Figure 3.4).
Figure 3.3 Warehouse managers’ primary workforce concerns. Worker retention has been the number one indicator for as long as we have been conducting this survey.
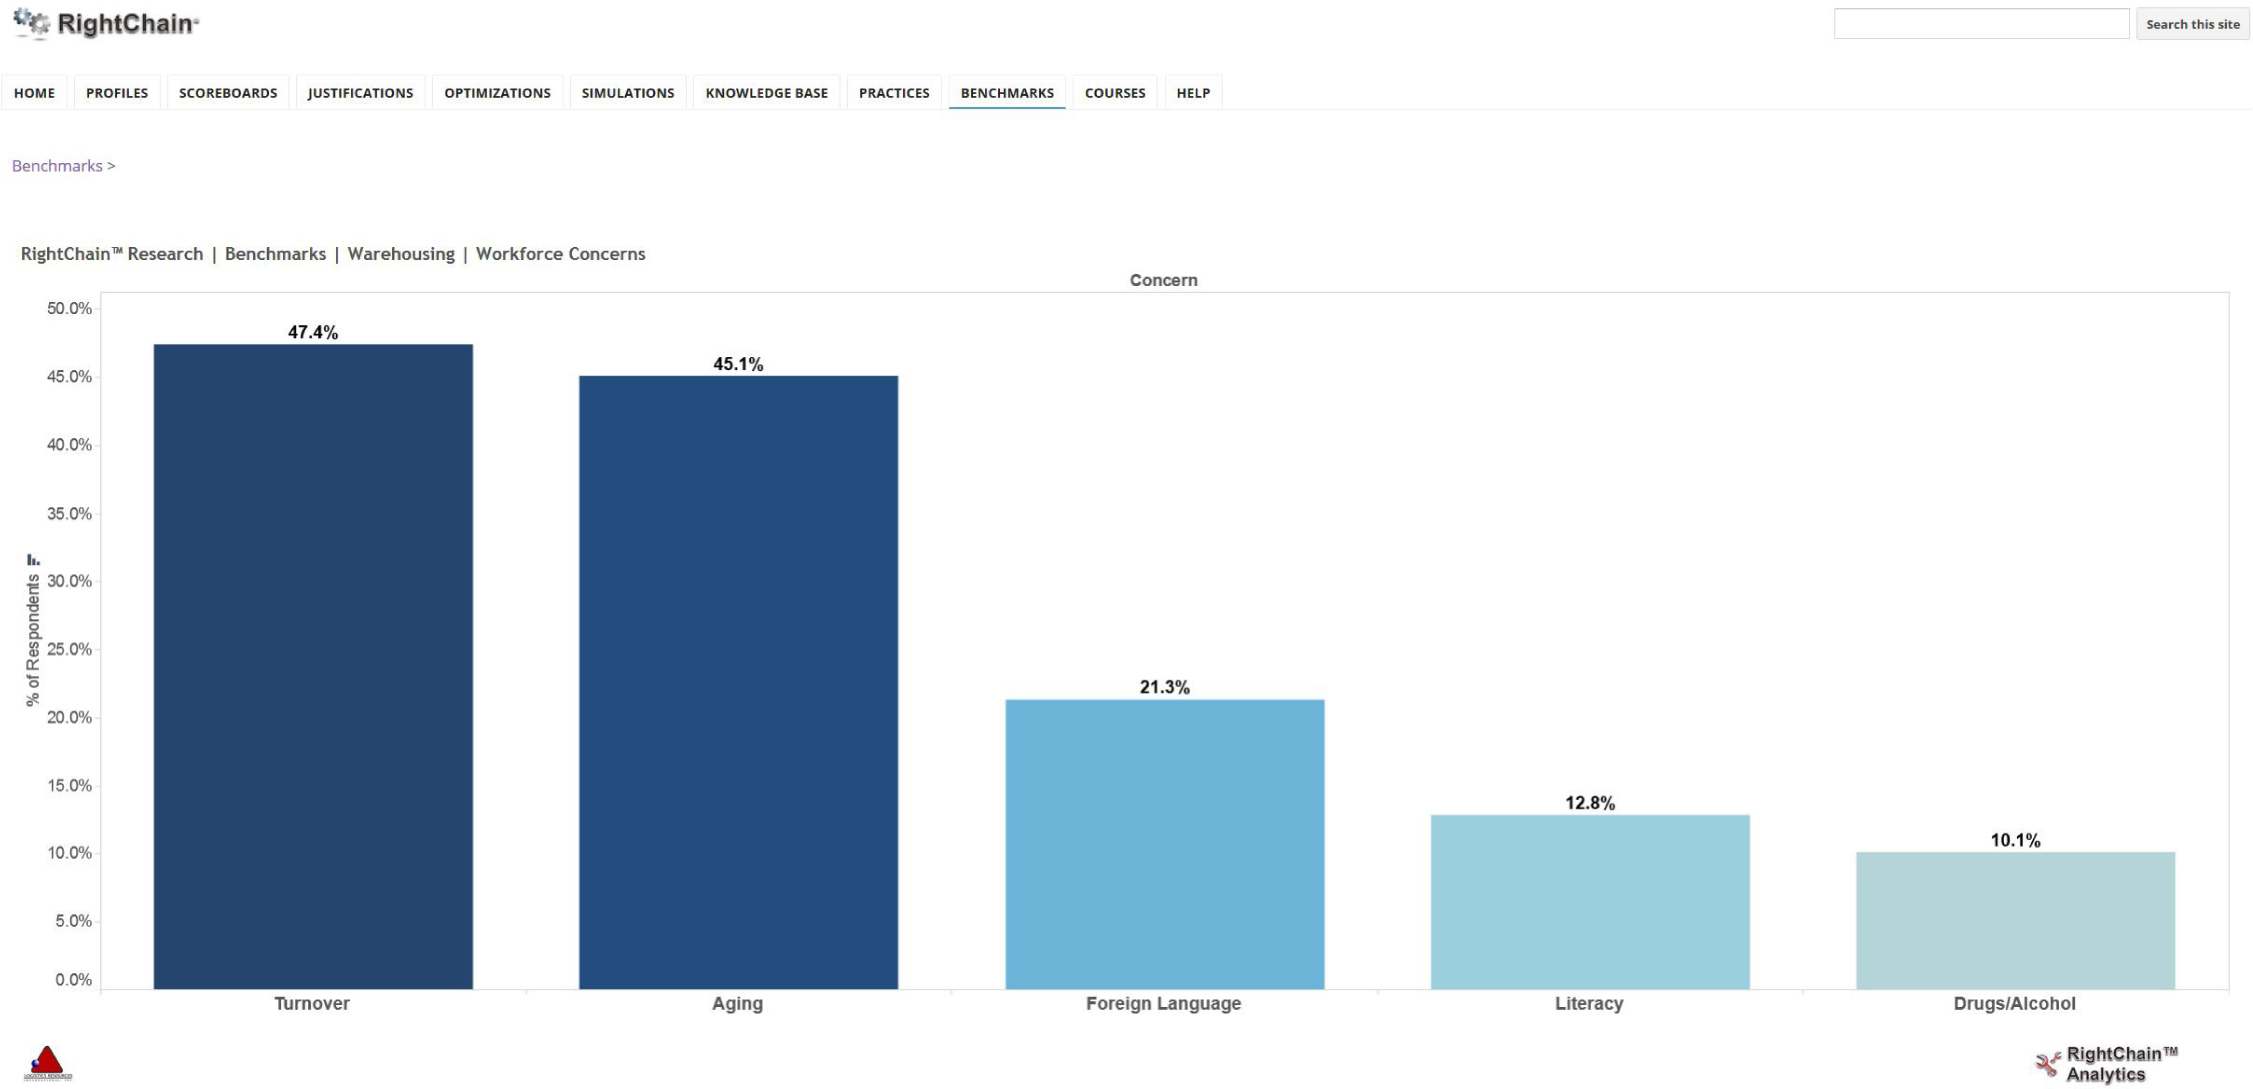
Figure 3.4 Warehouse workforce turnover versus Warehouse Quality Index (WQI). The WQI, the product of inventory and shipping accuracy, is one of our overall indicators of warehouse quality performance. There is a dramatic drop-off in the WQI as turnover increases. When we compare the cost of poor quality with the cost of retaining a high-quality workforce, we have yet to come across a situation where the warehouse was not significantly better off investing in the workforce.

3.3 Customer-Facing Metrics
Warehouses contribute to customer service when they provide accurate orders, on-time in short cycle times.
Accuracy
Our RightHouse Scoreboard tracks (Figure 3.5) at least one accuracy indicator for each warehouse activity and summarizes those indicators into four accuracy indicators—two for inbound handling and two for outbound handling.
Inbound Accuracy High inbound accuracy prepares a warehouse for high outbound accuracy, we recommend two inbound indicators—put-away accuracy and inventory accuracy.
Put-away accuracy measures the number of put-away transactions that are executed to the correct system-directed put-away location. It is difficult, if not impossible, to recover from an inaccurate put-away.
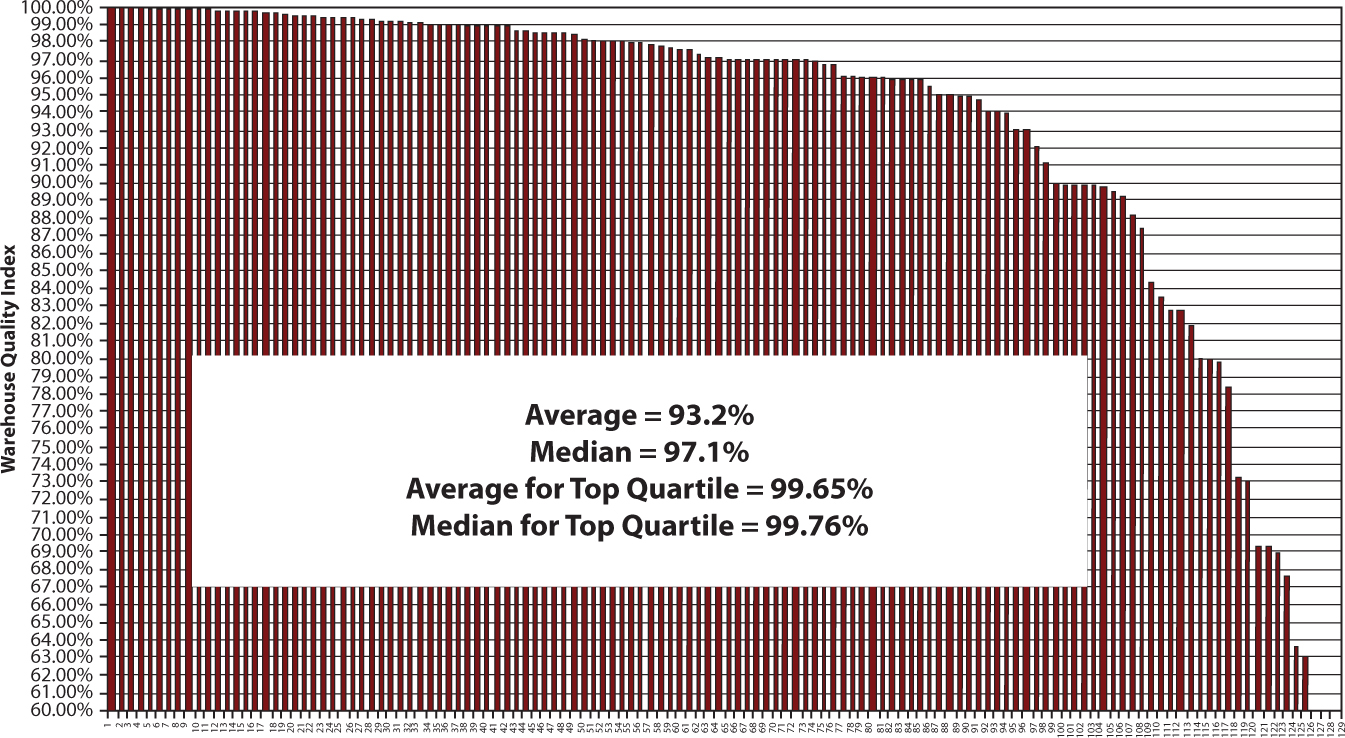
Warehouse inventory accuracy measures the number of inventory locations that hold the system-recorded level of inventory. High levels of inventory accuracy are achieved through high put-away accuracy, ABC cycle counting, disciplined housekeeping, and real-time transactions. Under the drag of poor warehouse inventory accuracy, trust in the supply chain breaks down. No inventory strategy can properly operate without high degrees of trust in the numbers used to support it (Figures 3.6 through 3.8).
Figure 3.6 Inventory accuracy benchmarks. We recently surveyed organizations with uniquely high requirements for warehouse inventory accuracy. Their location, item, and financial inventory accuracies are depicted in the figure (RightChain Research)
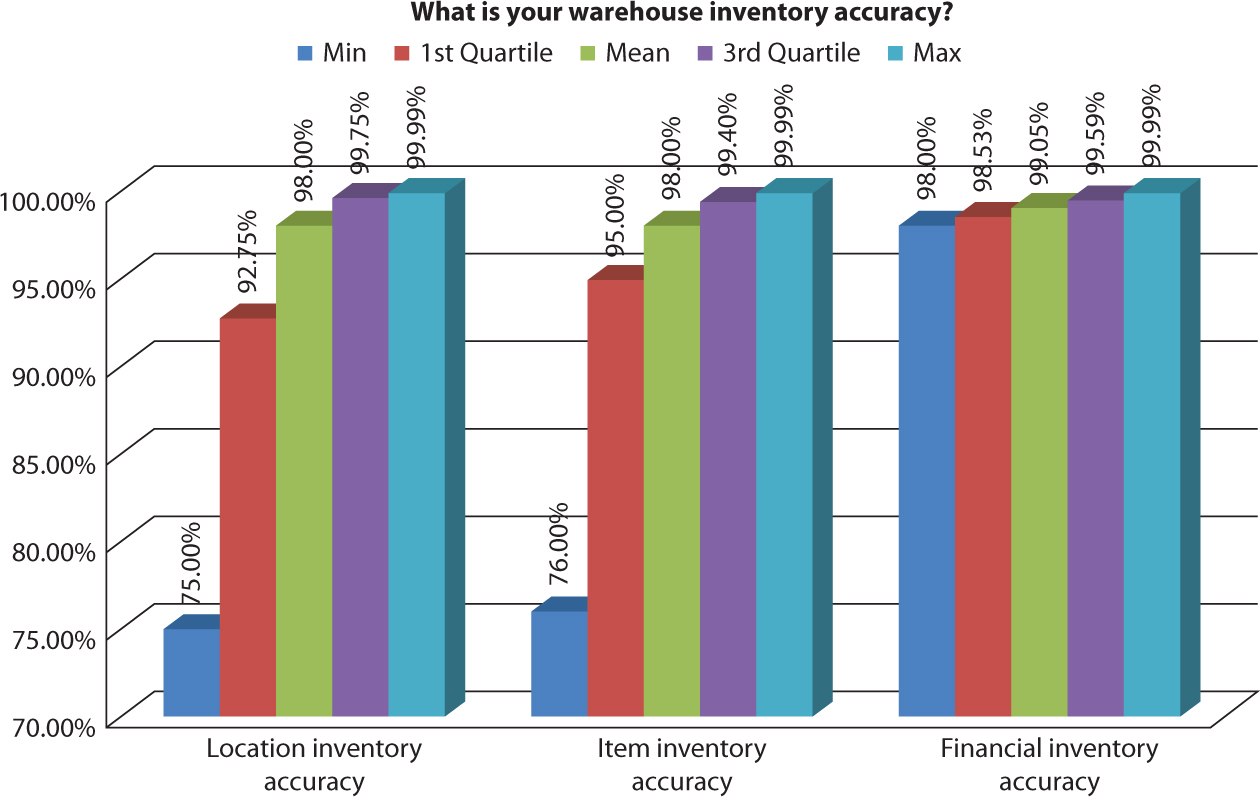
Figure 3.7 In the same survey, we asked the participants what methods of inventory counting they employ in various stages of the supply chain (RightChain Research).

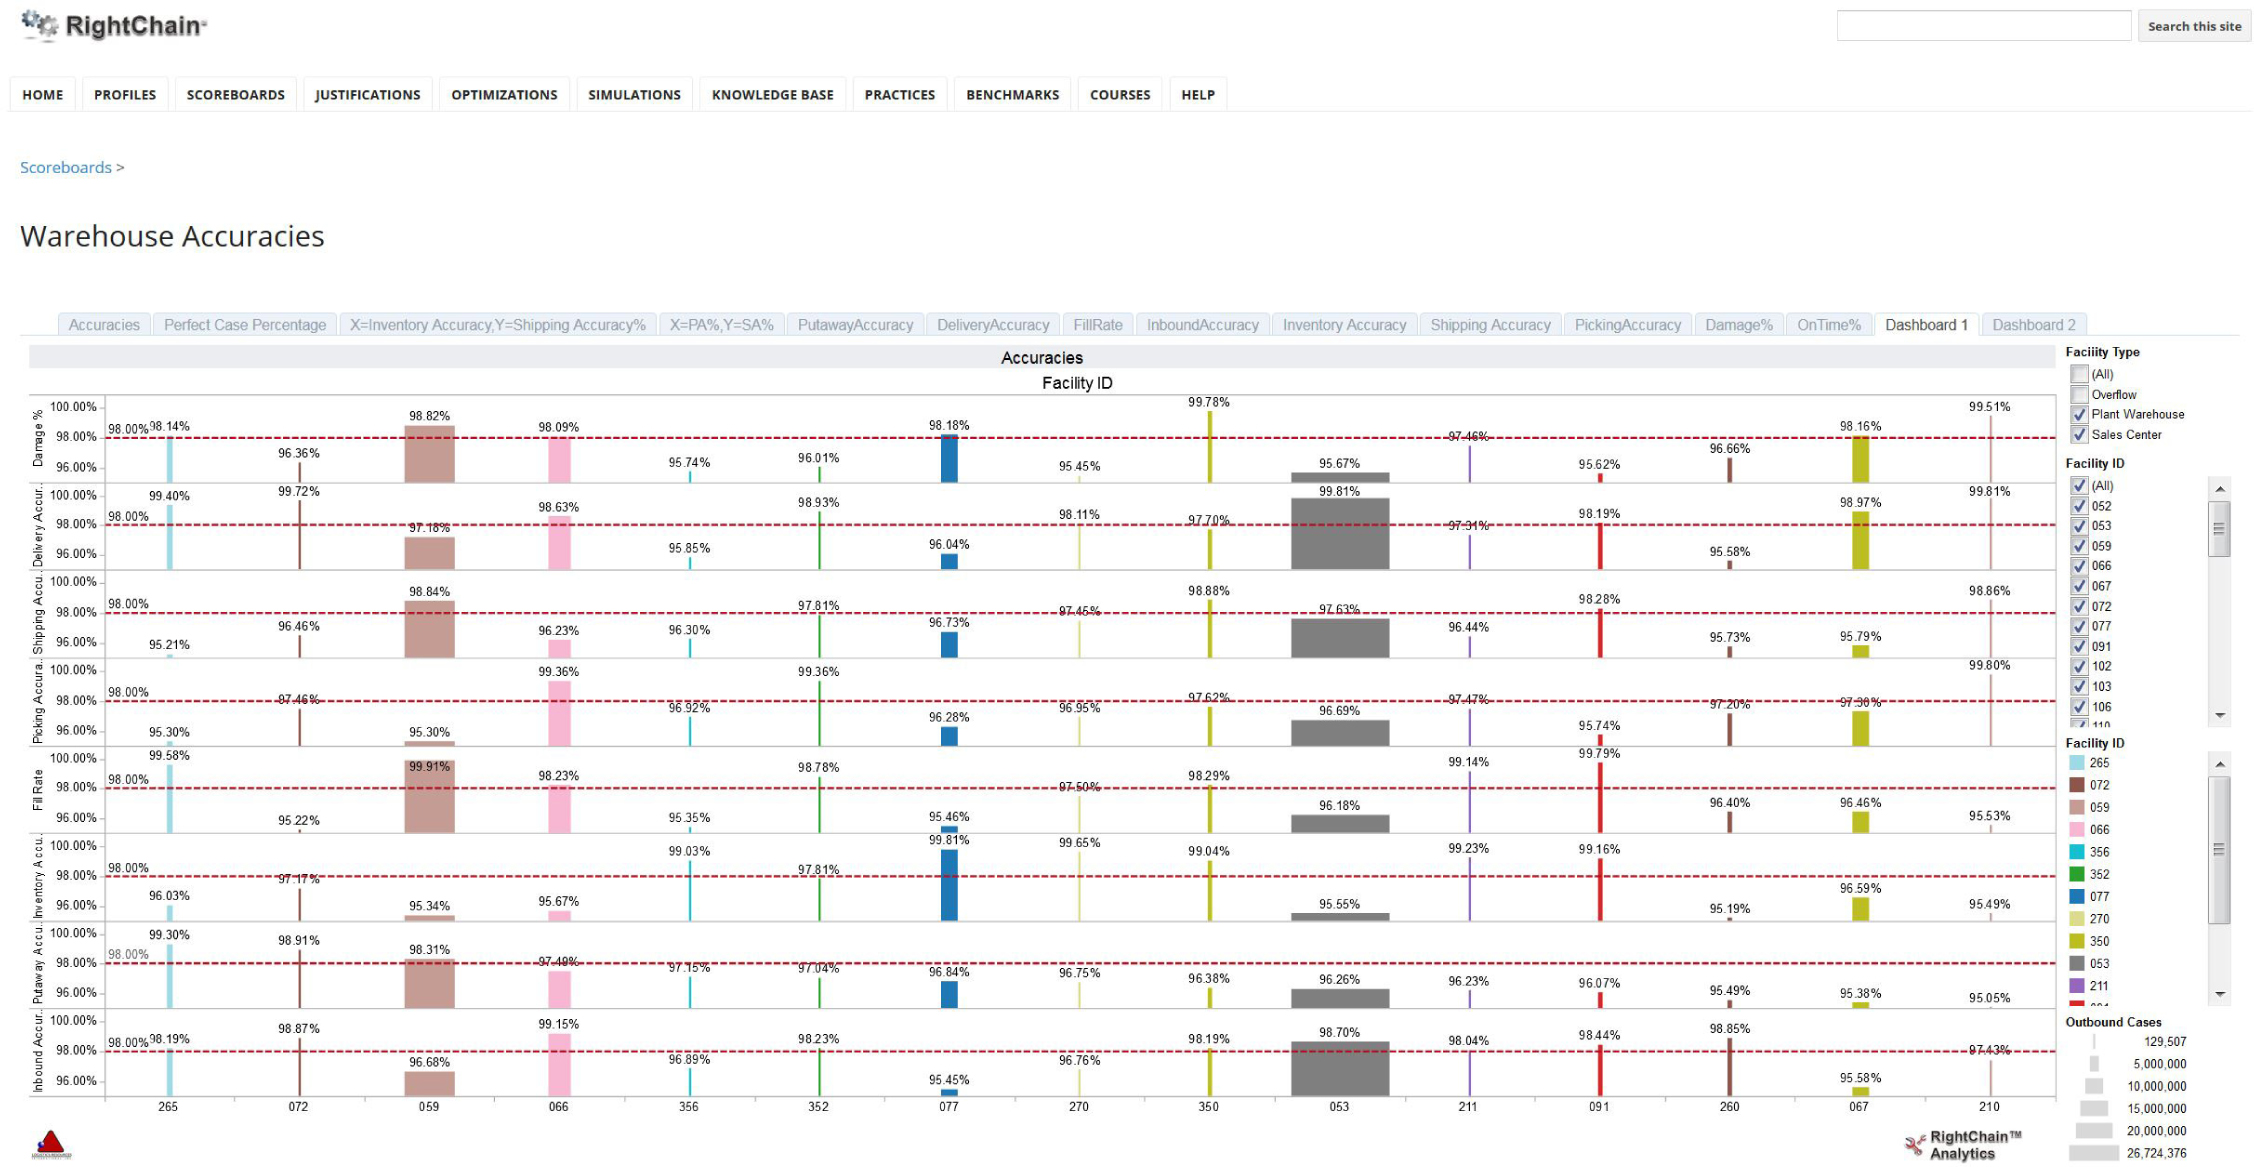
Figure 3.8 Accuracy performance screen from the RightHouse Scoreboard. Inventory accuracy is along the x axis, and shipping accuracy is along the y axis. Each bubble represents a distribution center in a supply-chain network. The size of the bubble corresponds to the transaction volume in the distribution center (RightChain Analytics).

Outbound Accuracy Our RightHouse Scoreboard monitors two indicators of outbound accuracy—picking accuracy and shipping accuracy. Picking accuracy is the portion of order-line picks executed with the correct stock-keeping unit (SKU) in the correct quantity. Shipping accuracy is the portion of shipping-line transactions executed with the correct SKU in the correct quantity.
Our best warehouse clients (Figures 3.9 through 3.11) in the United States have shipping accuracies at or near 99.97 percent. Our best warehouse clients in Japan have shipping accuracies at or near 99.997 percent, an order of magnitude improvement.
Figure 3.9 Accuracy and damage indicators monitored in survey warehouses (RightChain Research).
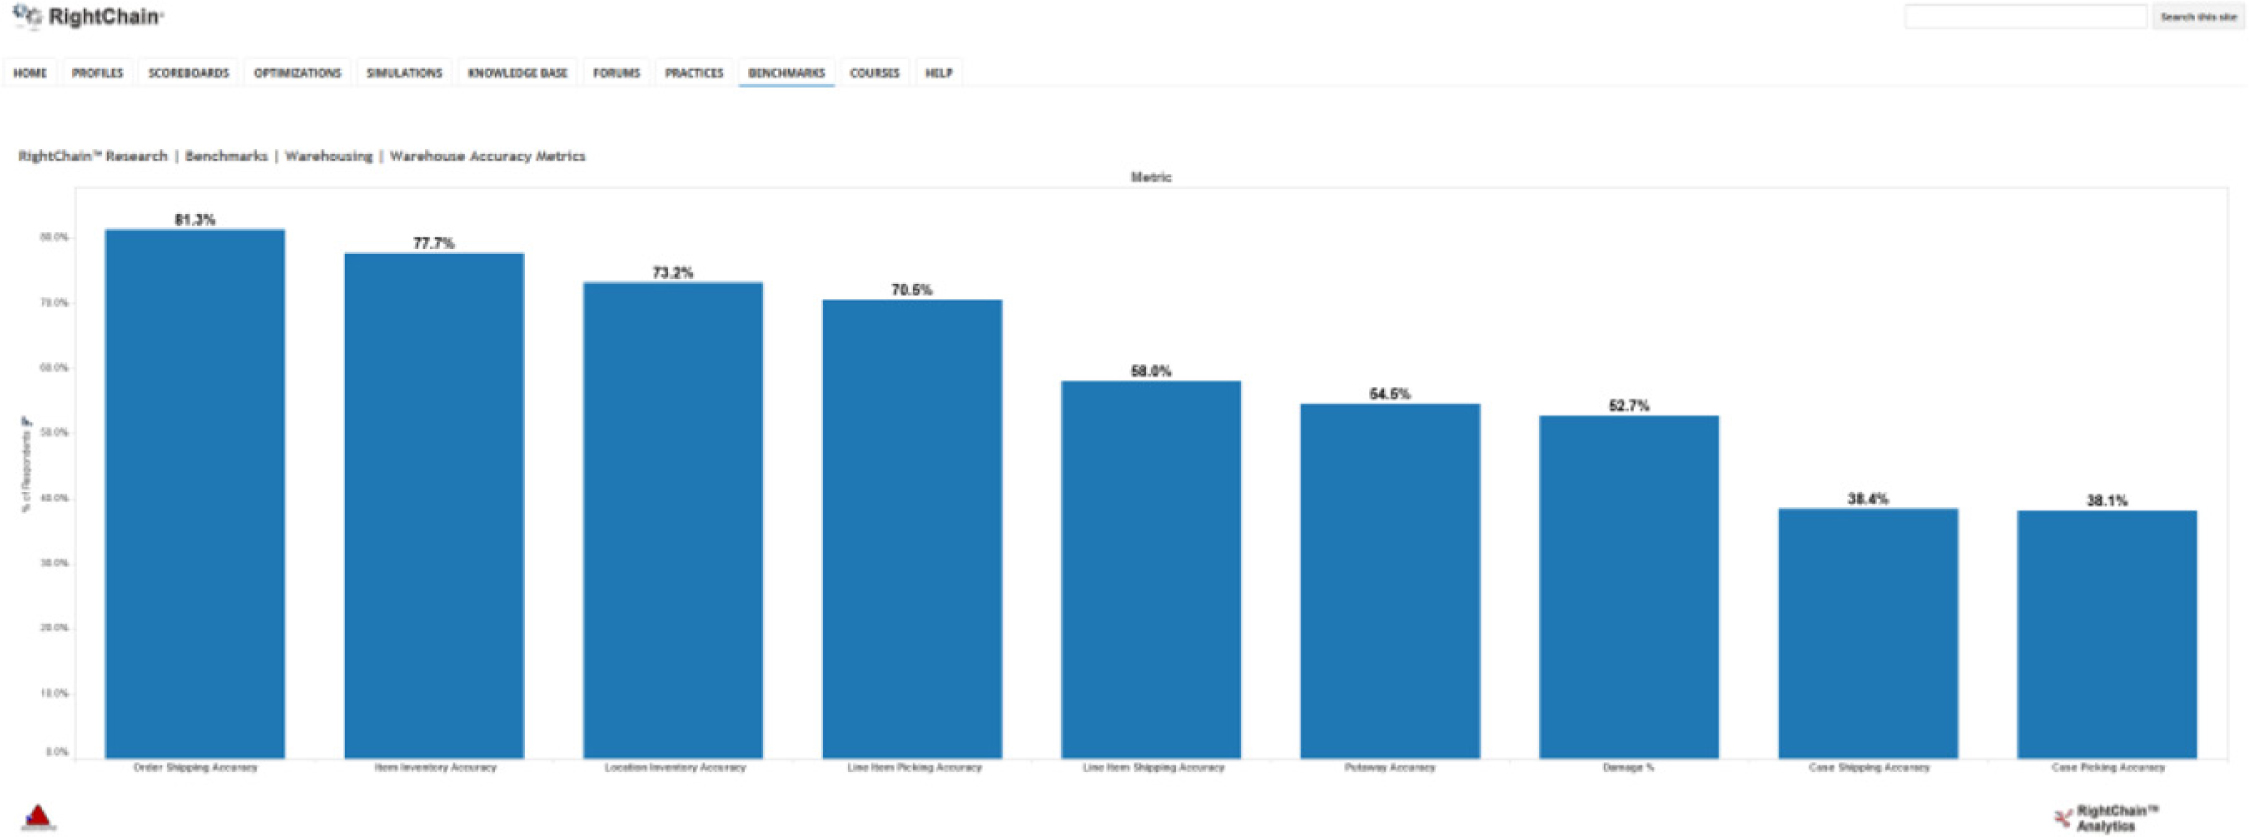
Figure 3.10 Means of determining picking and shipping accuracy in survey warehouses.
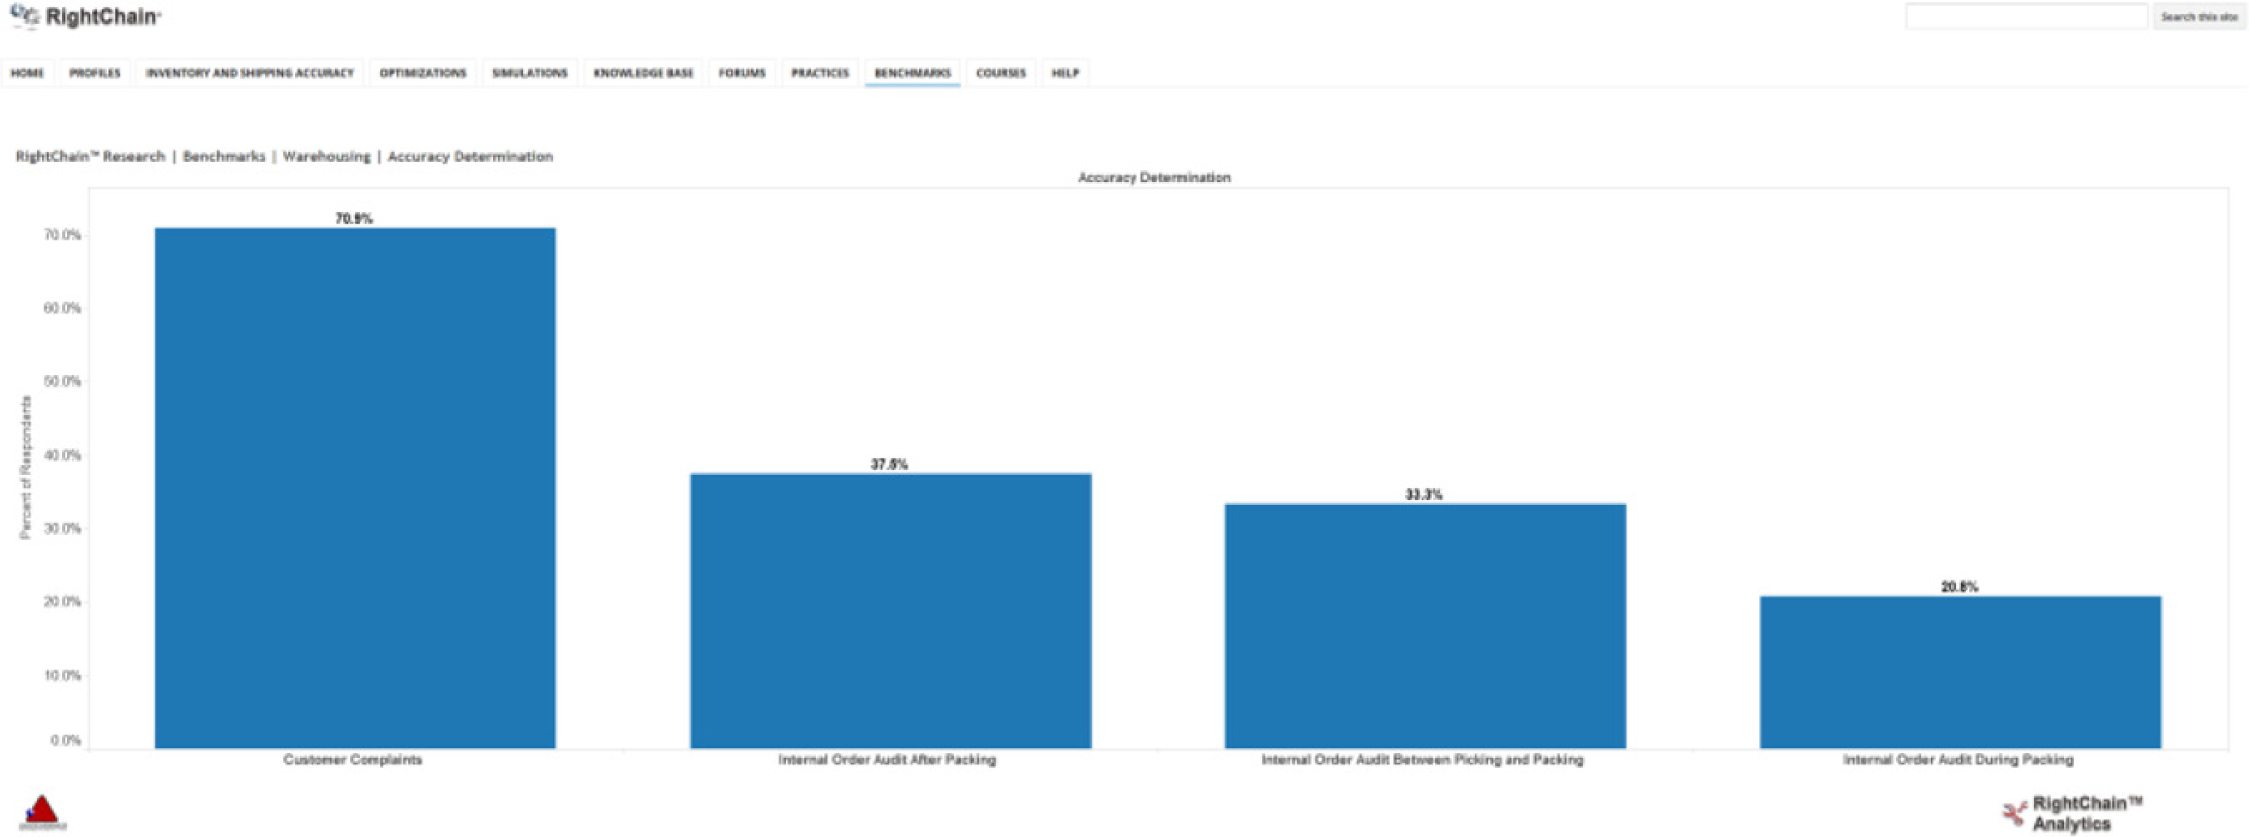
Figure 3.11 Our Warehouse Quality Index is the product of a warehouse’s inventory accuracy and its shipping accuracy (RightChain Research).
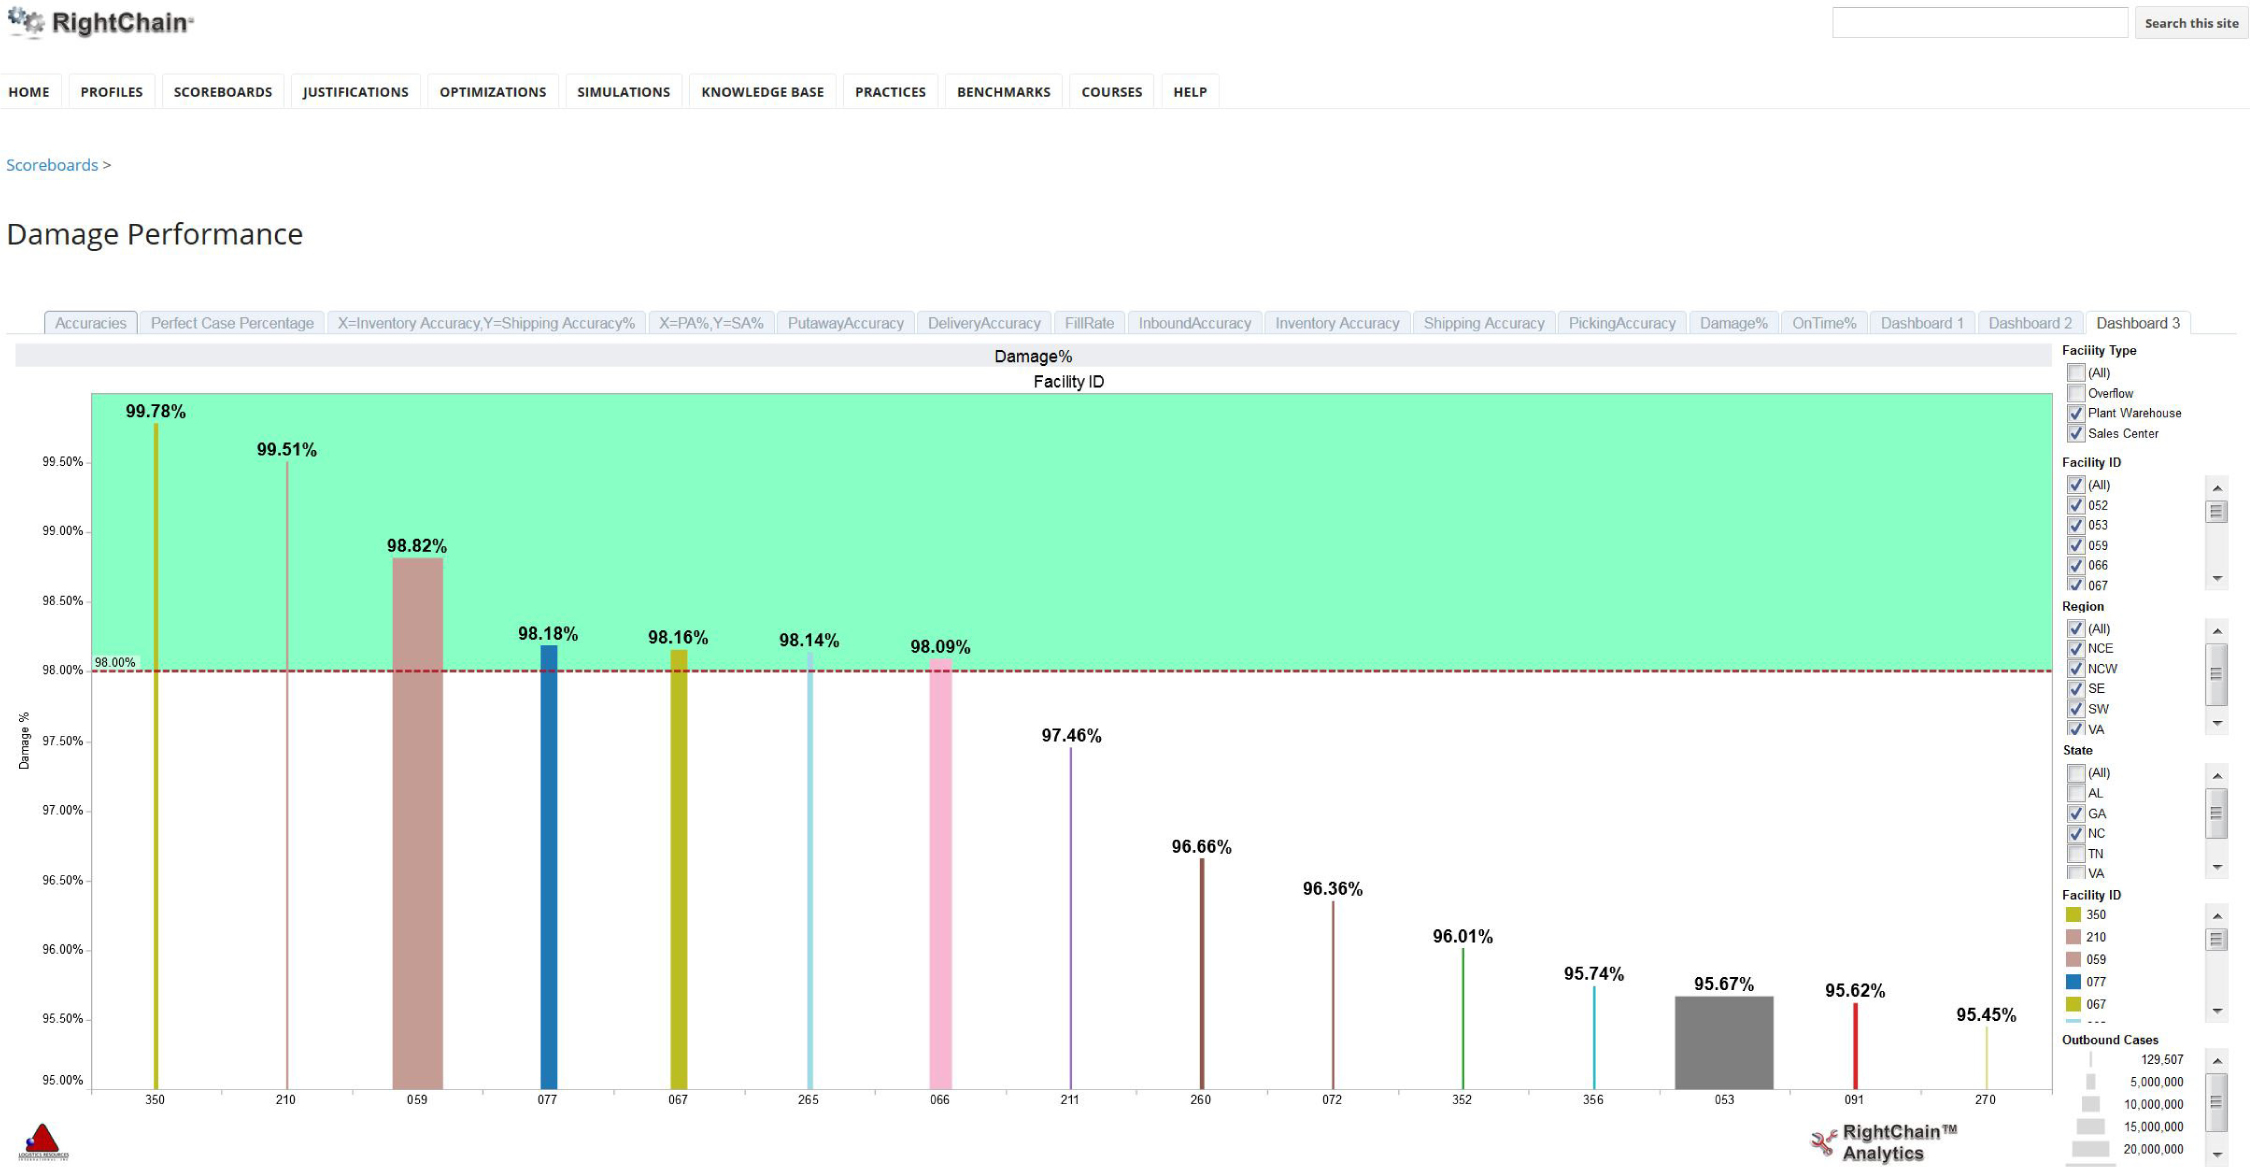
Damage
If accurate orders arrive on time to the right location with damage, all the production and logistics work in the world is for naught. Accordingly, the RightHouse Scoreboard tracks damage rates for each warehouse activity and for the warehouse as a whole (Figure 3.12).
Figure 3.12 RightHouse Scoreboard damage performance analysis.
On-Times
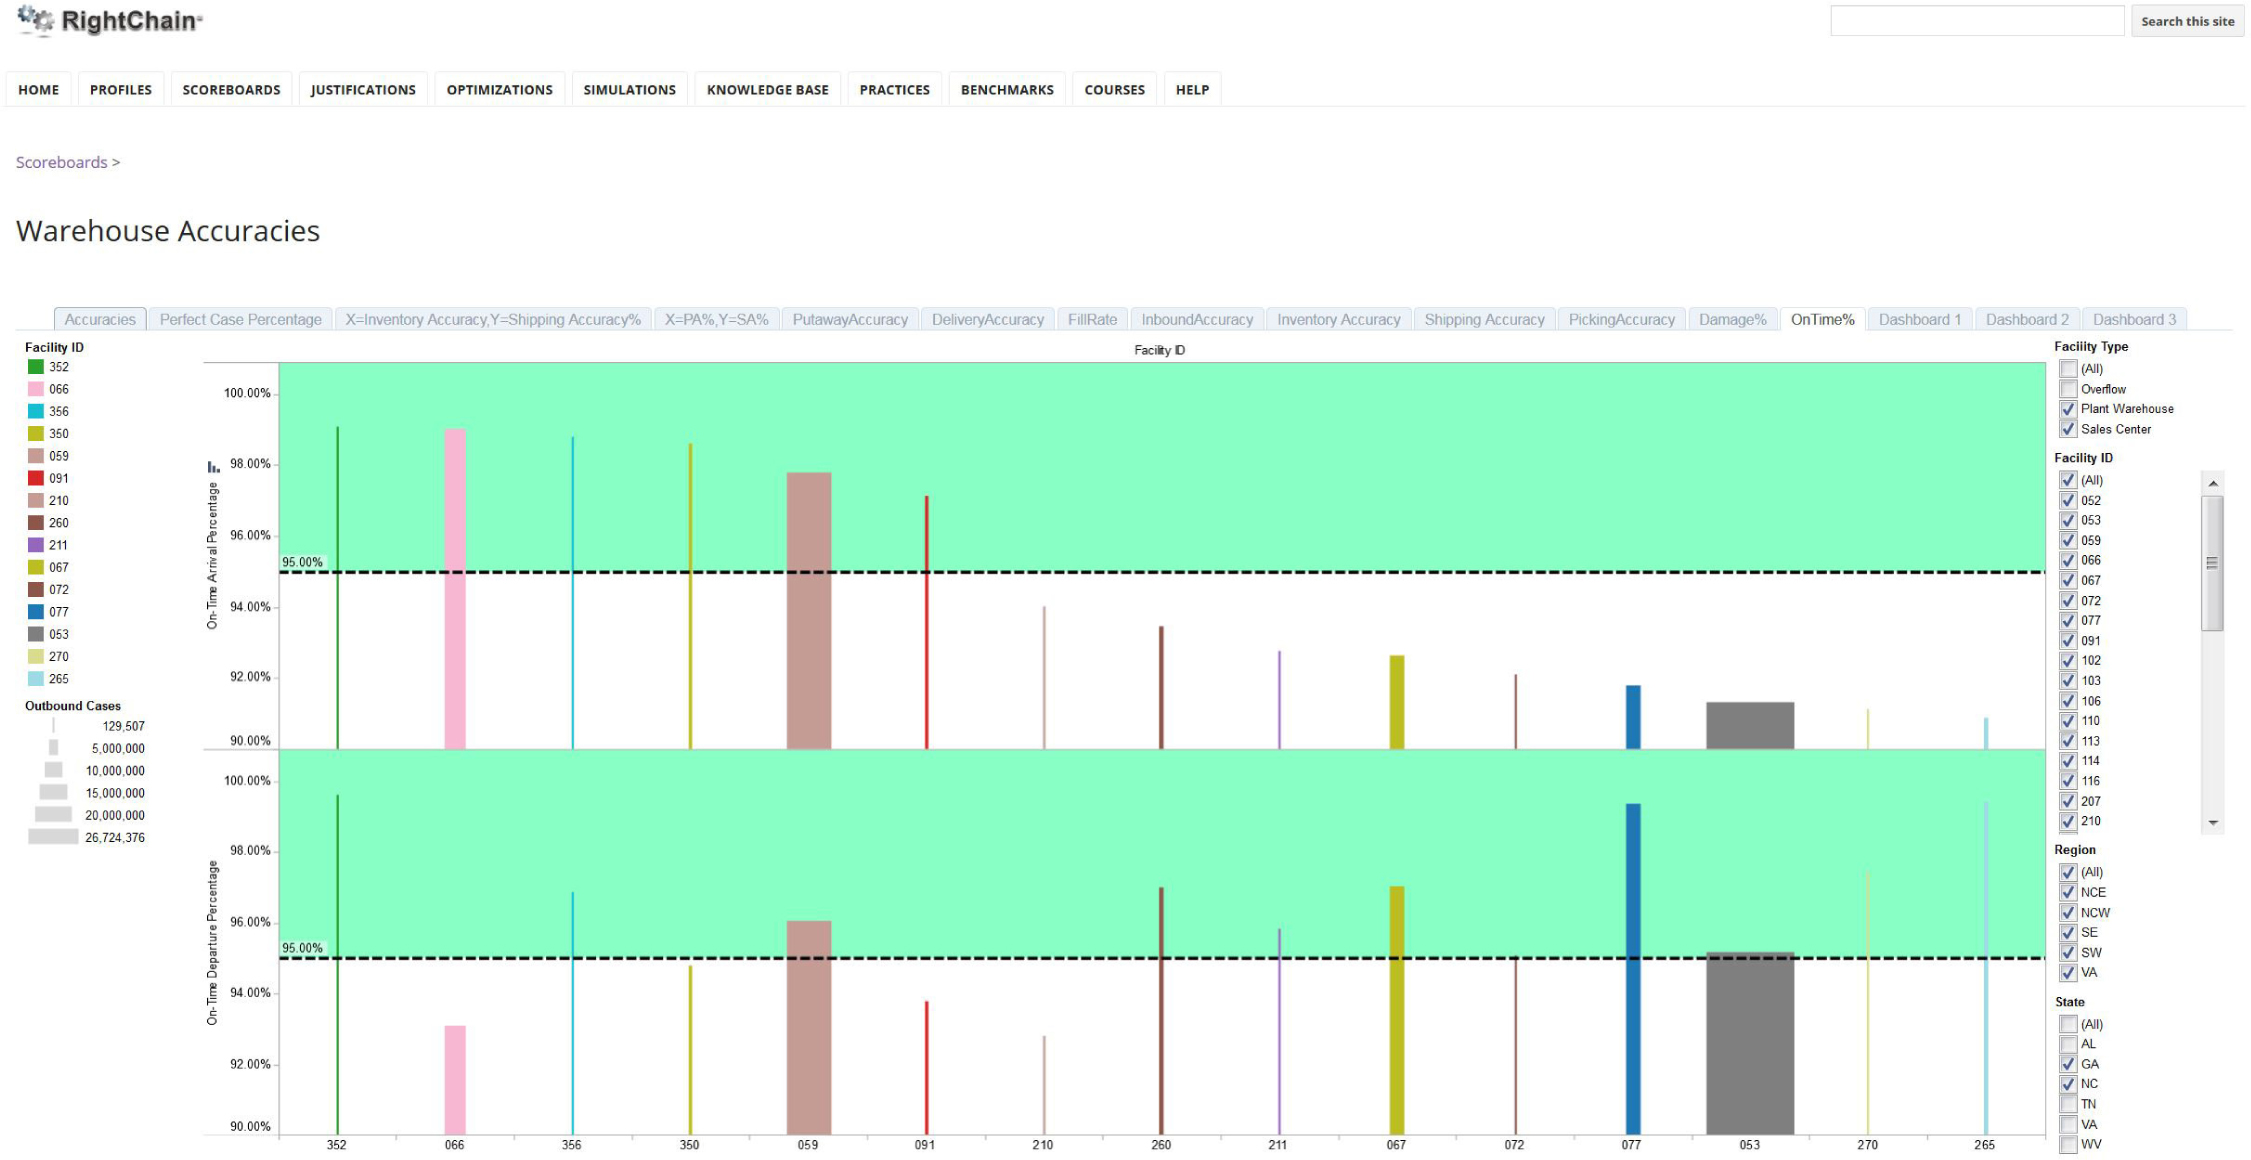
The RightHouse Scoreboard monitors three key on-time performance indicators—supplier on-time arrivals, on-time put-aways, and on-time departures. Supplier on-time arrivals are measured as the percentage of inbound product that arrives on time. If suppliers arrive late, it is very difficult to keep a warehouse or supply chain on time. On-time put-aways measure the portion of put-away lines that are executed on time. Again, if put-aways are late, it is very difficult to keep the warehouse on time. Lastly, on-time departures measure the percent of loads that depart the warehouse on time (Figure 3.13).
Figure 3.13 RightHouse Scoreboard on-time performance analysis.
Cycle Times
The RightHouse Scoreboard includes two cycle-time indicators—dock-to-stock time and warehouse order cycle time. Dock-to-stock time (DST) is the elapsed time from when a receipt arrives on the warehouse premises until it is ready for picking or shipping. Warehouse order cycle time (WOCT) is the elapsed time from when an order is released to the warehouse floor until it is picked, packed, and ready for shipping.
A few years ago, we were asked to assist a large apparel retailer with its supply chain strategy. We toured the main distribution center during one of the initial visits. I noticed that the receiving dock looked especially full. I asked the manager what the dock-to-stock time was. He proudly shared that it was 96 hours. I shared that our benchmarking showed that 24 hours was a norm, 8 hours was above average, and a few hours was world class. The manager was somewhat defensive and said that the company had investigated systems that were designed to reduce dock-to-stock time but could never produce an acceptable return on investment. I asked how much inventory was sitting on the dock. It was $8 million worth of inventory. I asked the manager what range of investment proposals the company had received for the material-handling systems required to help reduce dock-to-stock time to 24 hours. Quotes were in the range of $2 million. I did some quick math and calculated that by reducing their dock-to-stock time by 75 percent, the company could reduce its inventory by $6 million. I then asked, “Wouldn’t it make sense to spend $2 million to take $6 million out of inventory or to reduce inventory carrying costs by $2 million per year at the 33 percent inventory carrying rate?” The manager shared that the company had only tried to compute an ROI based on labor savings alone and had not considered inventory savings. This reconsideration launched one of the nation’s most successful supply chain strategies.
3.4 Shareholder-Facing Metrics
Our recommended categories of shareholder-facing metrics are cost, productivity, and utilization.
Warehouse Cost Performance
The main cost categories to operate a warehouse are labor, space, material-handling equipment, and warehouse management systems. These typically add up to between 2 and 5 percent of sales.
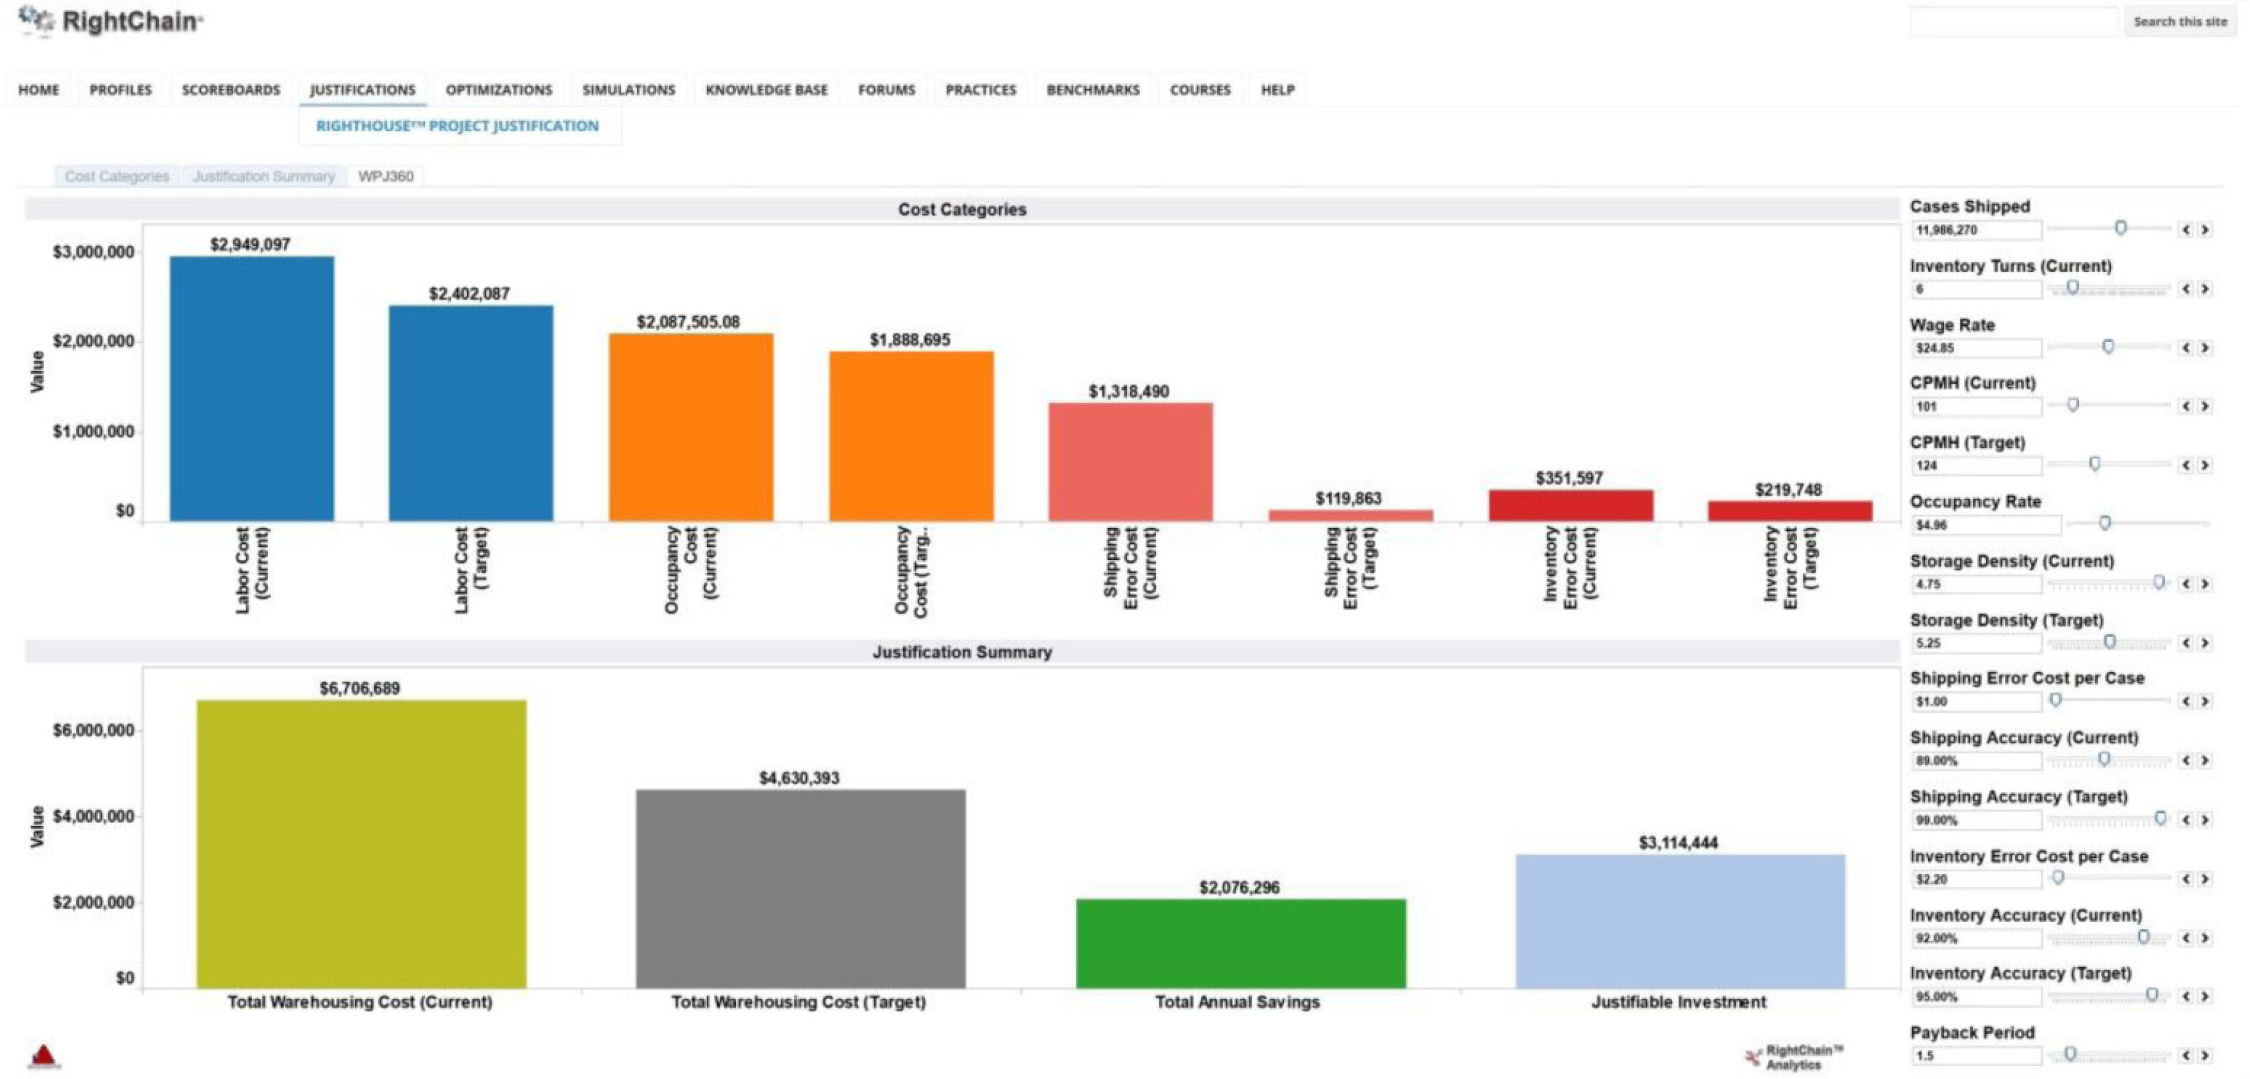
Ideally, these cost categories will be analyzed across the activities of the warehouse in a warehouse activity-based costing program (Figure 3.14). In the example (Figure 3.15), a cost for each warehousing activity (i.e., receipt, put-away, store, pick, ship, and load) is established. The activity costs become the basis for comparing third-party warehousing proposals, budgeting, measuring improvement, and menu-based pricing for warehousing services.
Figure 3.14 RightHouse activity-based costing allocates the cost of personnel, space, systems, supplies, and fees to each warehouse activity. Activity costs then may be allocated to product lines and/or business units.

Figure 3.15 RightHouse activity-based costing example.
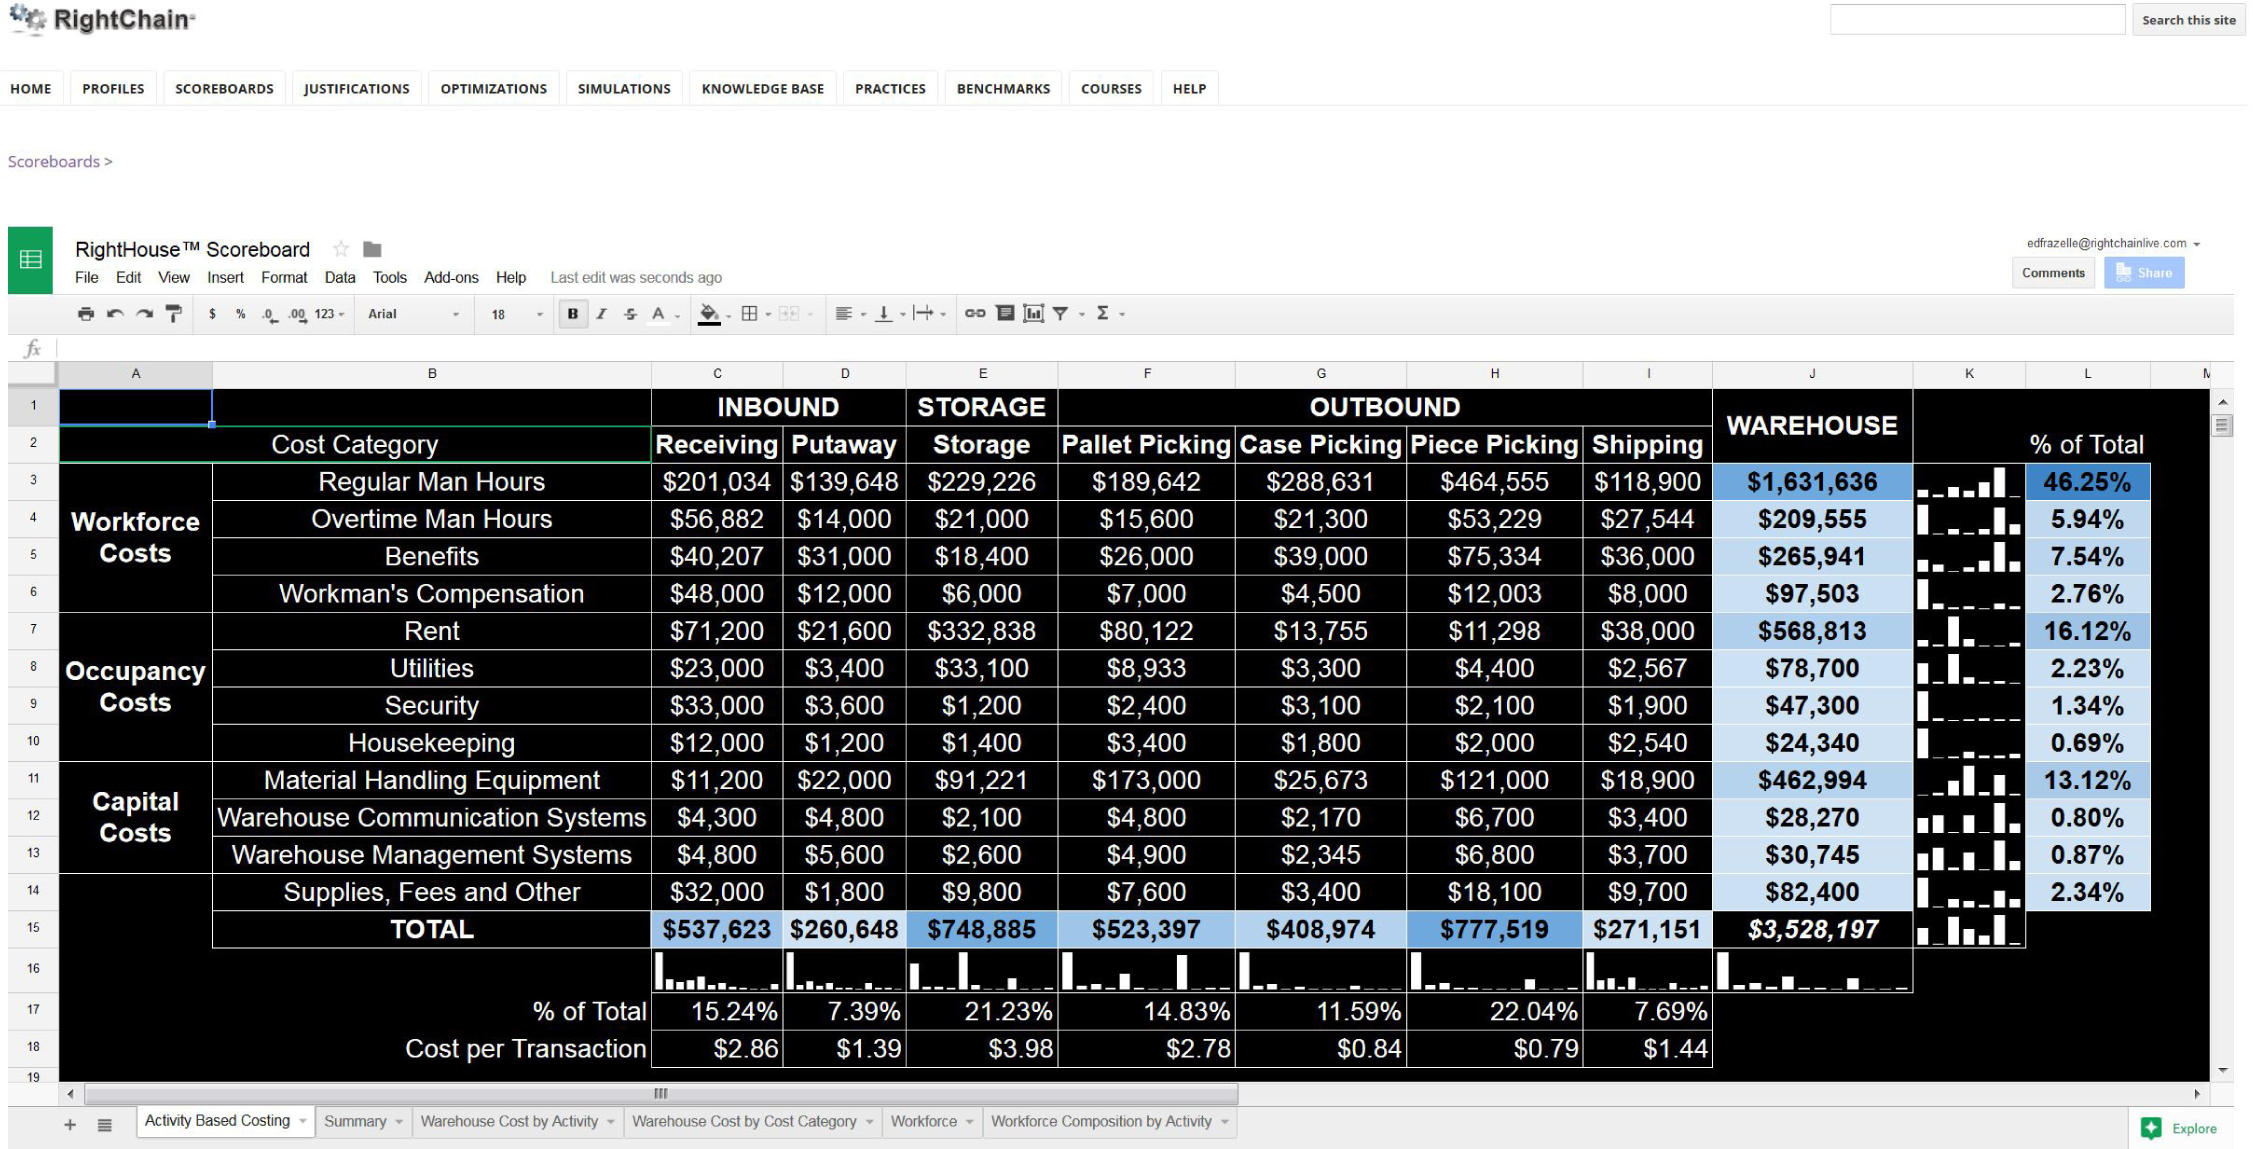
In this particular analysis, the cost of storing and handling an item in the warehouse for a year was estimated to be $340.37. This warehouse managed over 70,000 items, 40,000 of which did not yield $340.37 in sales per year—not even enough to cover their storage and handling costs. Needless to say, the finding was taken up with the marketing area, and a SKU reduction ensued.
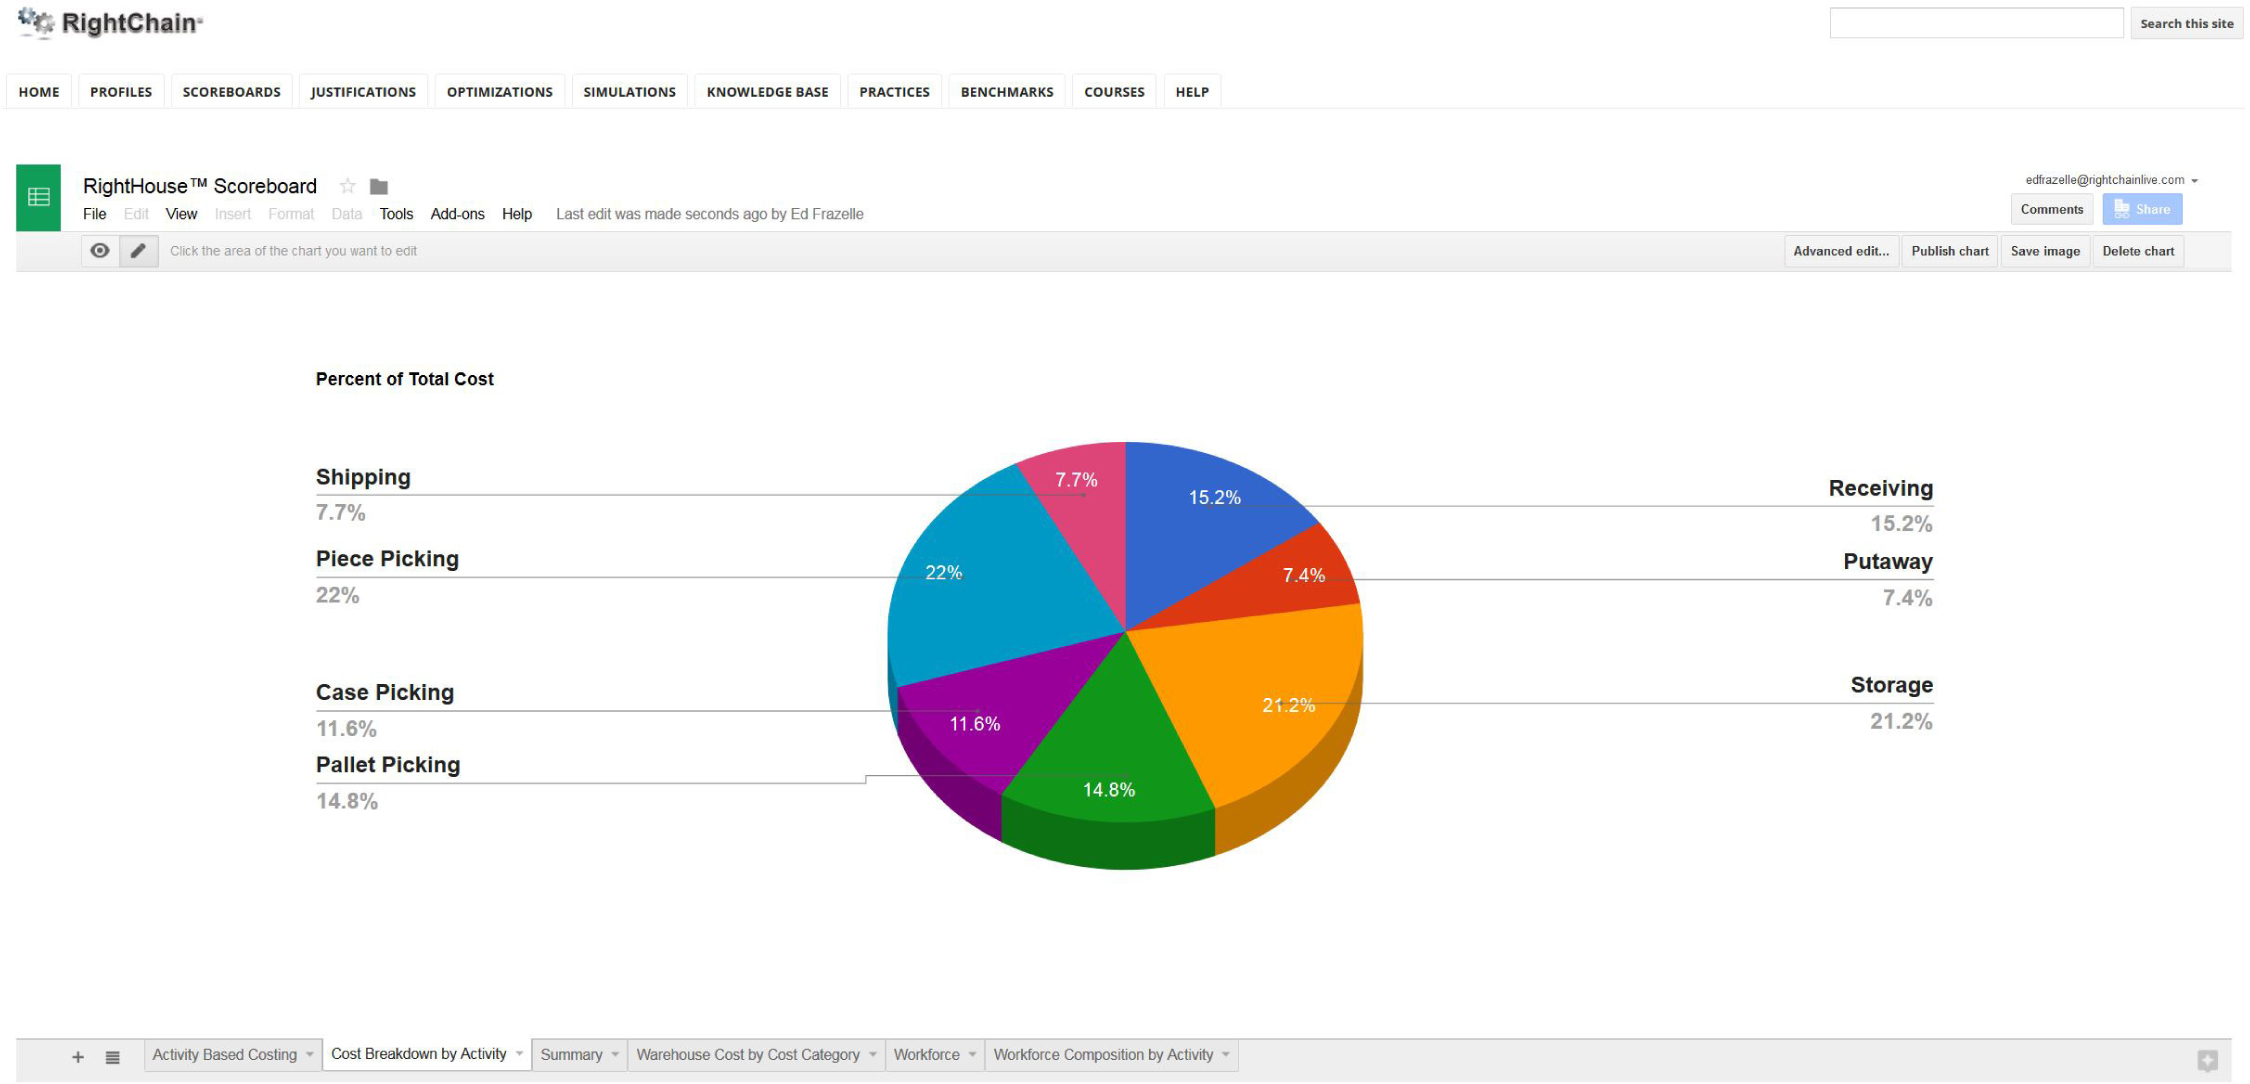
Once a warehouse activity-based costing analysis has been completed, it is not unusual to find that most of the warehousing costs are labor costs (Figure 3.16) and that outbound activities make up the majority of costs by activity (Figure 3.17). Outbound costs dominate because a single-pallet put-away may require many trips to that pallet to deplete its contents in case picking, or a single-carton put-away may require many trips to deplete its contents in broken-case picking.
Figure 3.16 Typical warehouse cost allocation by cost category.
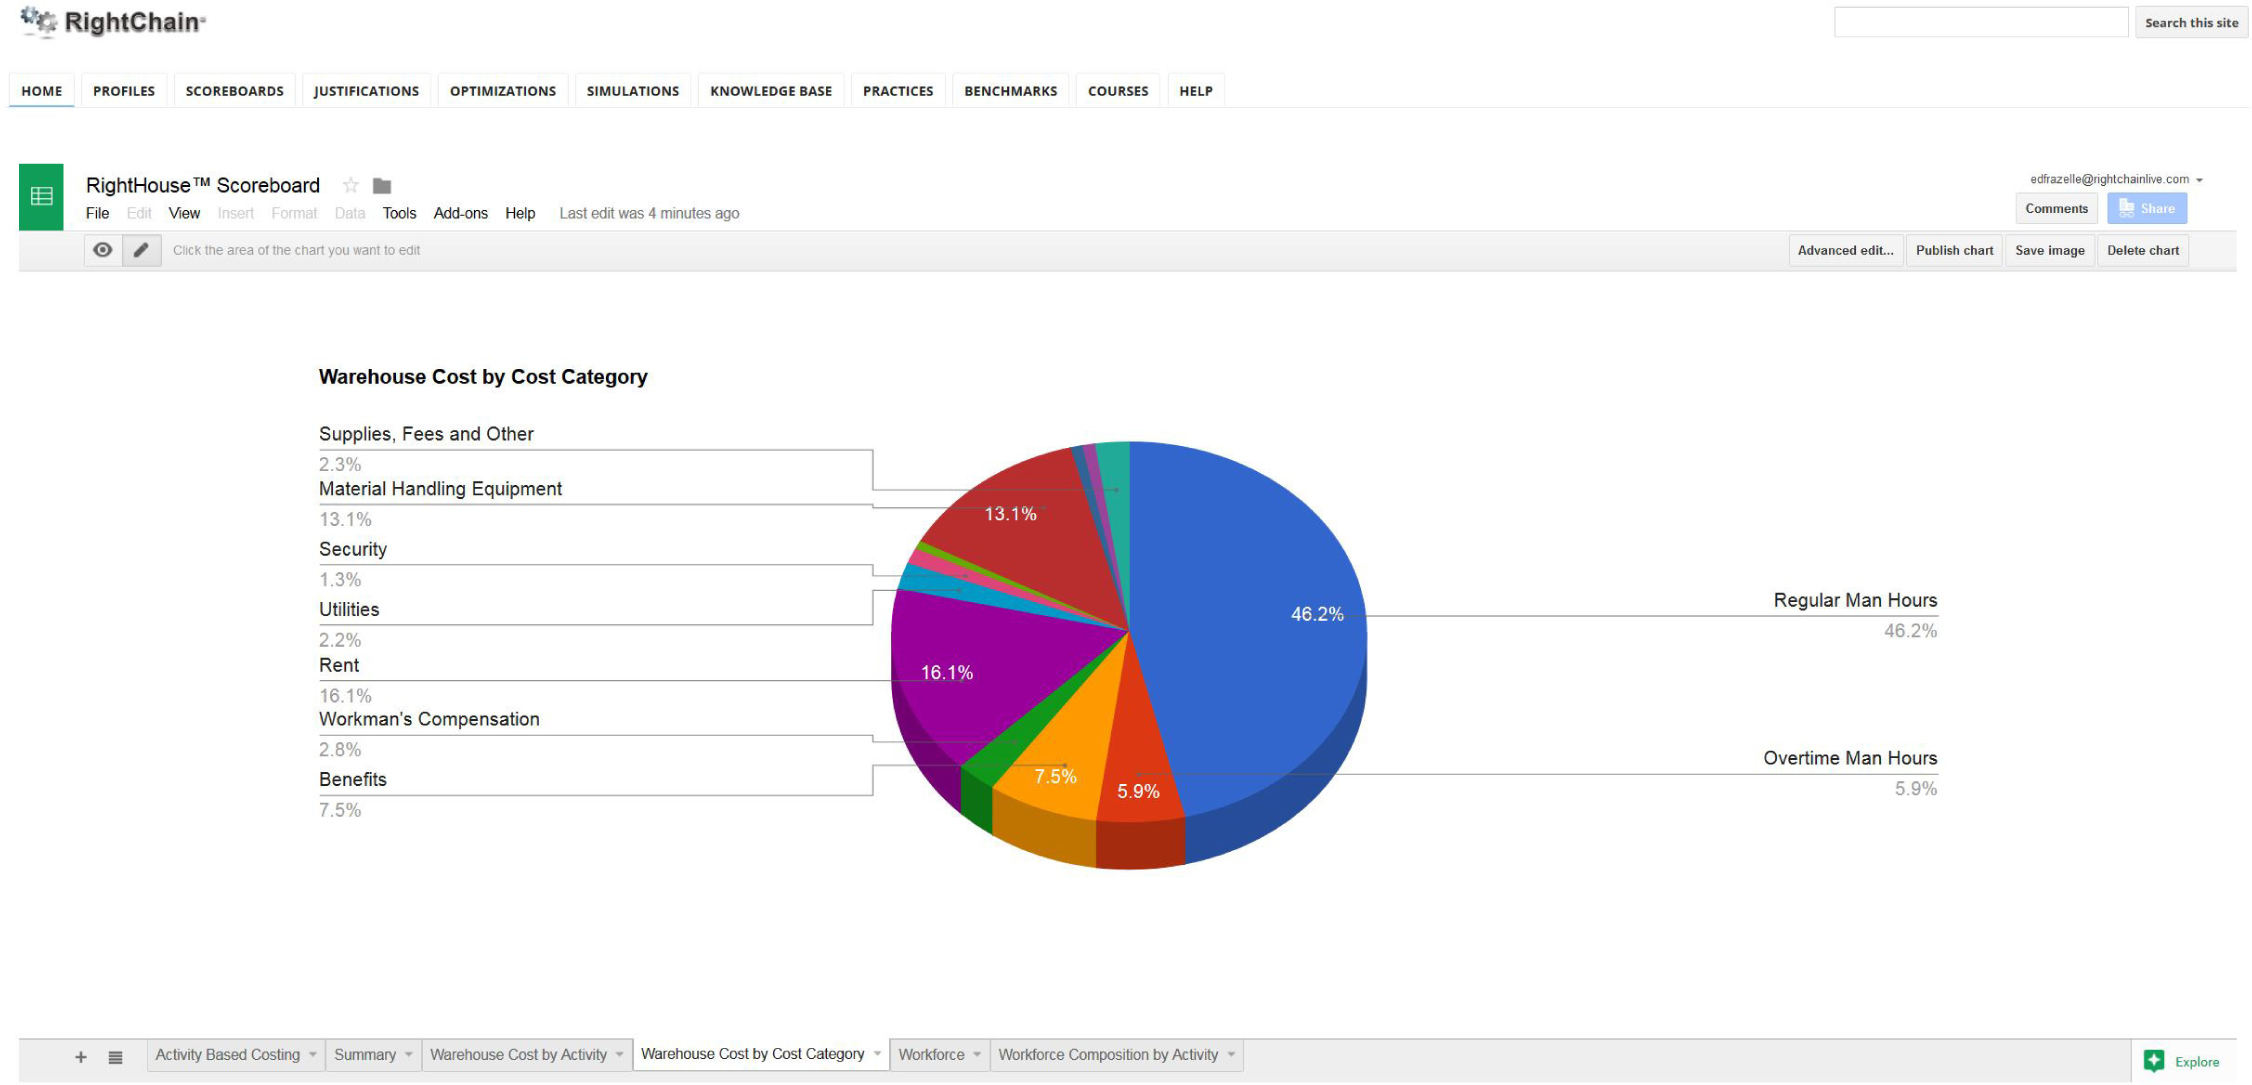
Figure 3.17 Typical warehouse cost breakdown by activity.
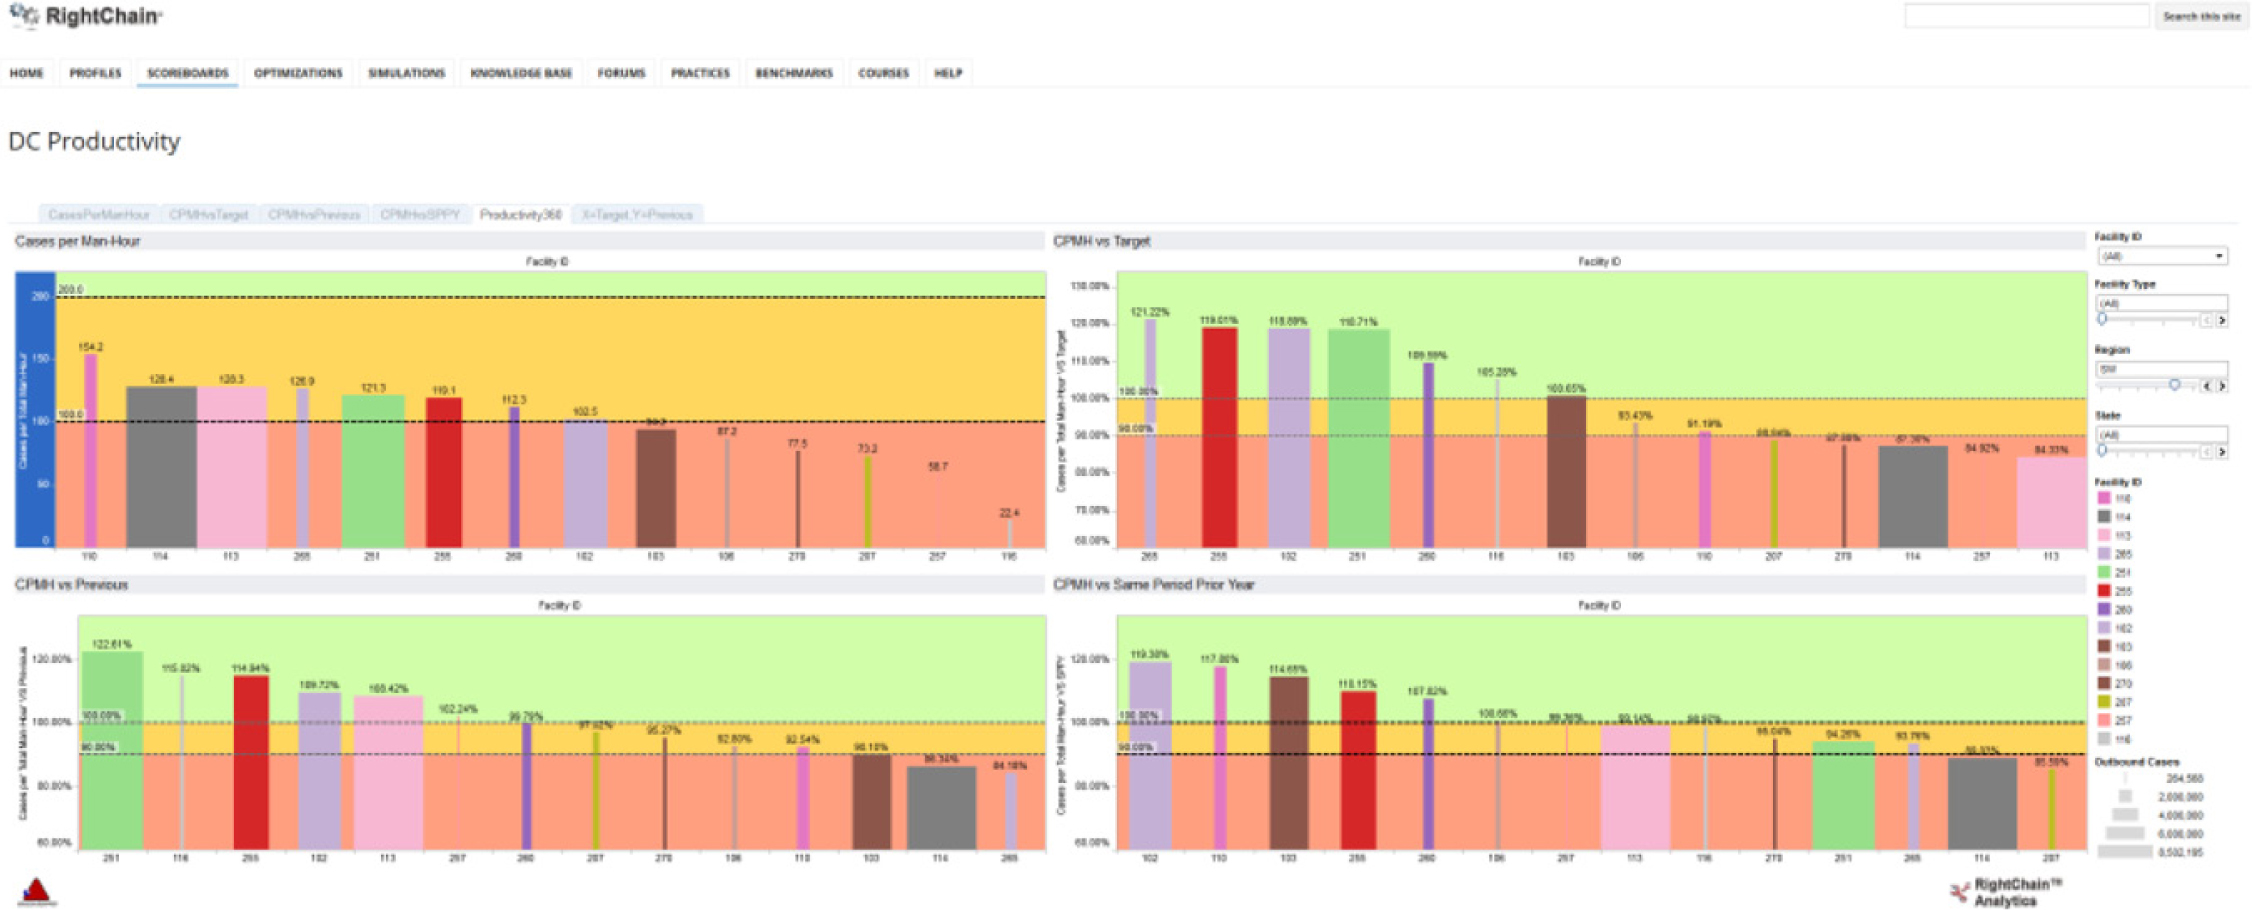
Warehouse Productivity Performance
The most popular and traditional warehouse performance measure is productivity (Figure 3.18). The formal definition of productivity is the ratio of the output of an entity to the resources consumed achieving that output. We recommend that our clients monitor the productivity and utilization of all key assets in the warehouse—labor, space, material-handling systems, and warehouse management systems. We typically measure overall labor productivity as the ratio of units, orders, lines, or weight shipped out of the warehouse to the number of person-hours spent in operating, supervising, and managing the warehouse. We typically measure overall space productivity as storage density, the ratio of the amount of inventory storage capacity to the square footage in the warehouse. It is normally expressed as the value, cube, pieces, or positions of inventory that can be accommodated per square foot.
Figure 3.18 RightHouse Scoreboard facility productivity screen
Warehouse Asset Utilization
Whereas the productivity of a resource is the ratio of output to consumption, the utilization of a resource is the ratio of consumption of the resource to the capacity of the resource (Figure 3.19). One typical warehouse resource utilization measure is labor utilization, usually expressed as the ratio of the actual units processed per hour to the theoretical maximum units per hour. Another common utilization measure is the storage-location utilization, expressed as the ratio of the number of occupied warehouse locations to the available warehouse locations. Equally important to monitor is the warehouse cube utilization, expressed as the ratio of the occupied cube to the total available cube (Figure 3.20).
Figure 3.19 RightHouse Scoreboard utilization 360 screen.

Figure 3.20 RightHouse Scoreboard storage-location utilization versus storage-cube utilization.
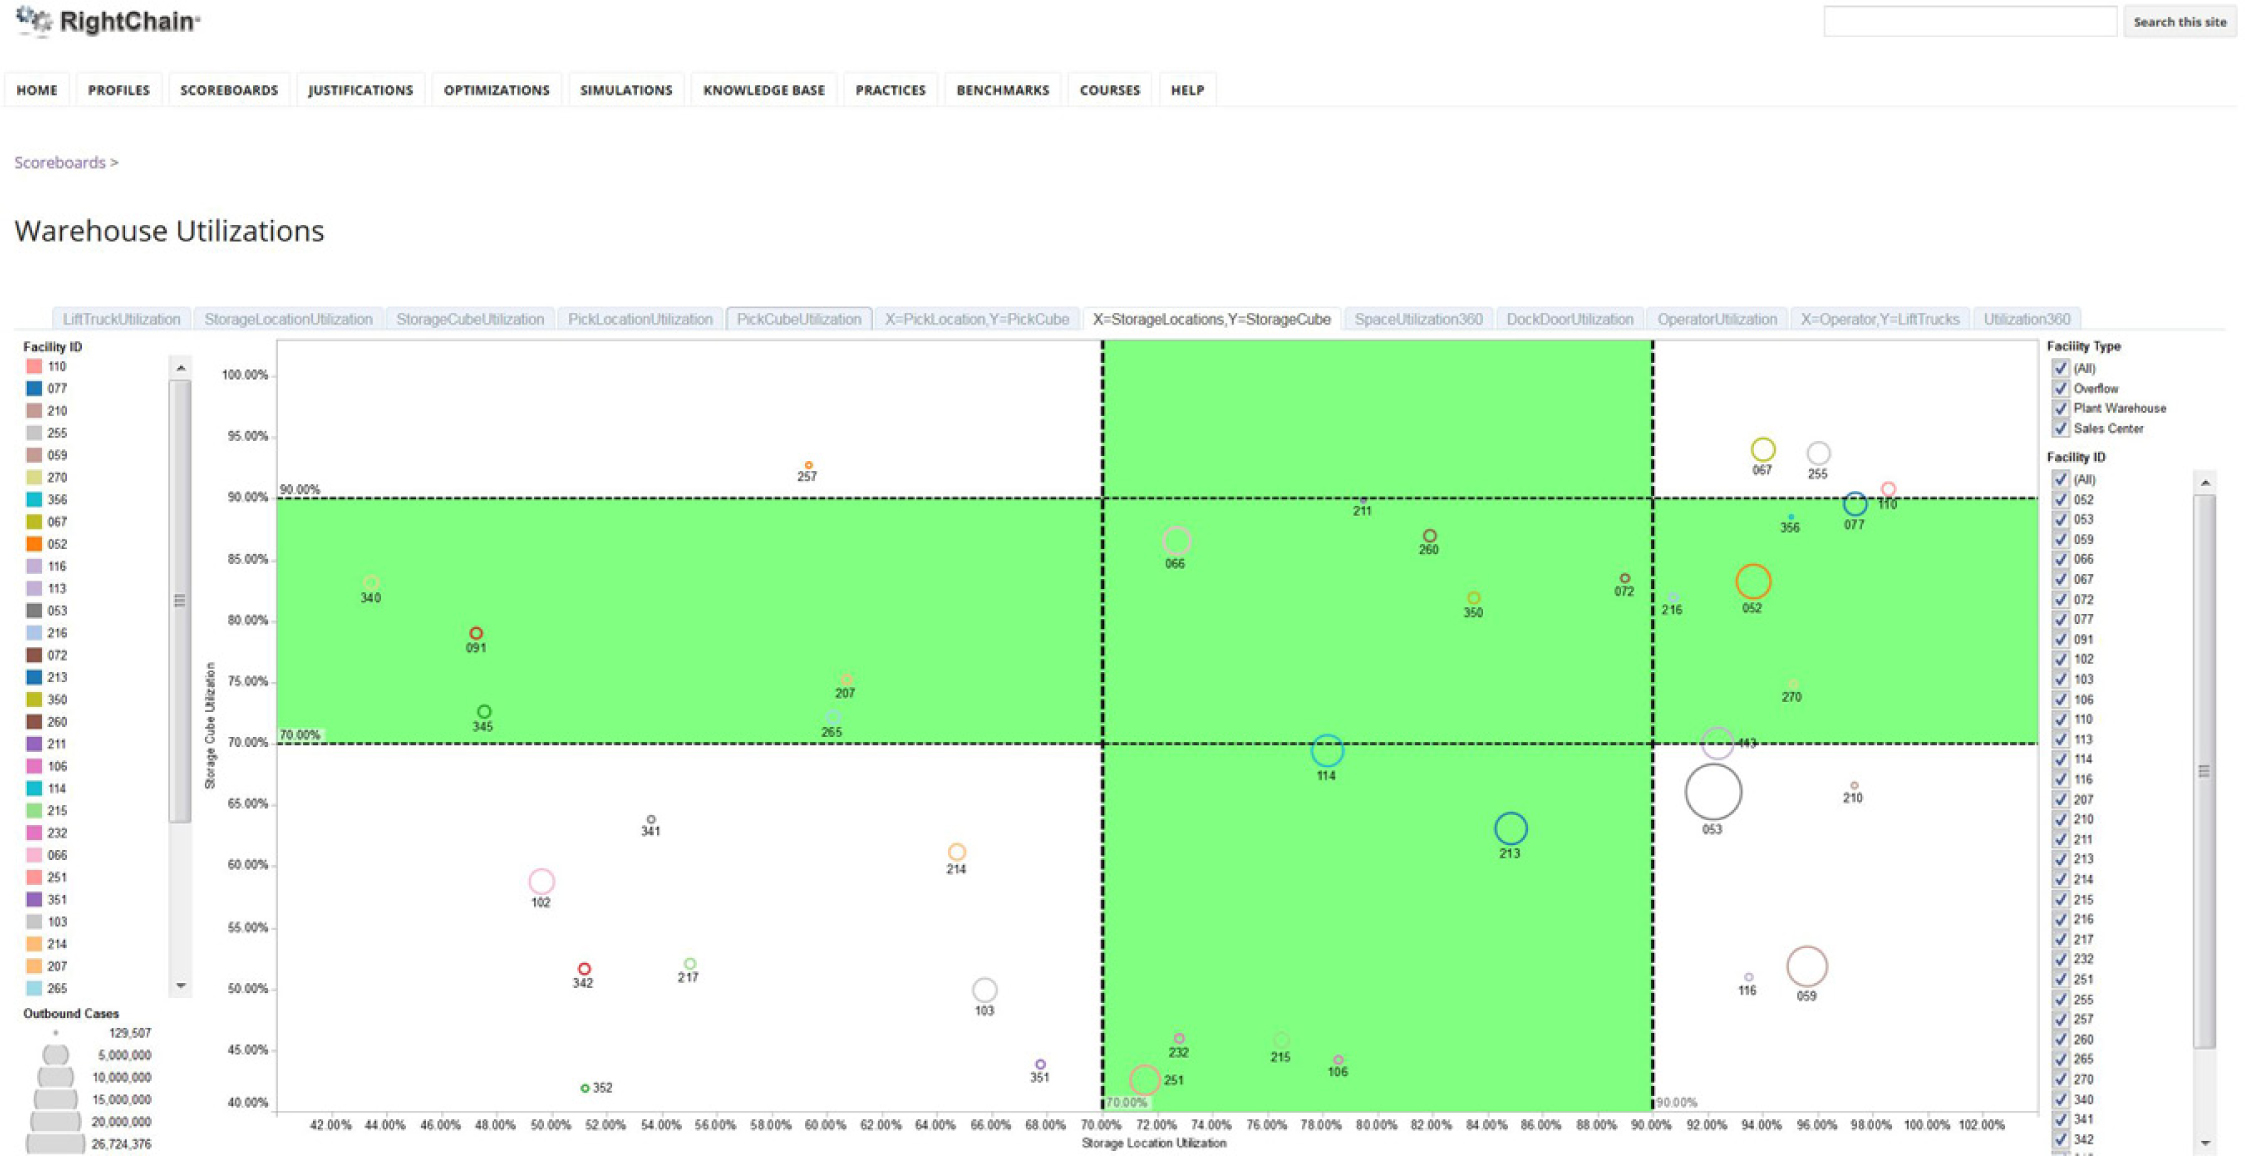
A major difference between productivity and utilization is that we always want to maximize productivity, whereas there are appropriate control limits for utilization. For example, we always want to maximize storage density, the number of storage positions available per square foot, but the utilization of storage space should range between 70 and 90 percent on a consistent basis (Figure 3.21). Storage location utilization that is higher than 90 percent inhibits productivity and creates potential safety problems. Utilization that is lower than 70 percent suggests excessive storage capacity.
Figure 3.21 Example warehouse performance gap analysis.
Maintaining healthy storage utilization helps to enforce healthy inventory management. In our early work with Honda, the company’s warehouse space utilization was in excess of 98 percent. When it came time to implement a new warehouse management system, the warehouses were so full that there was no room to move product to create the space needed to relabel and reconfigure racking to accommodate the new system. I suggested that the company delay implementation and reset the storage-utilization capacities to 85 percent, what it should be for most warehouses. The managers asked me what they would do with their excess inventory. I half-jokingly suggested that they rent a warehouse in a remote location where space was especially cheap. Any product occupying space over and above 85 percent should be shipped to that remote location. When the 85 percent occupancy had been established, the company could install the warehouse management system.
I was a bit surprised to learn later that the company had accepted my recommendation. The remote warehouse occupied more than 500,000 square feet. The company president received the monthly bill and dispatched an associate to look at the operation. It turned out that the material was essentially excess safety stock generated by the company’s forecasting system. Previously, the excess had been stuffed into the company’s facing distribution centers. Pulling the material out of the forward distribution centers helped them understand just how much excess safety stock its inventory plan was producing. The visualization and the bill from the third-party warehouse helped to motivate a highly successful makeover of their forecasting process and system.
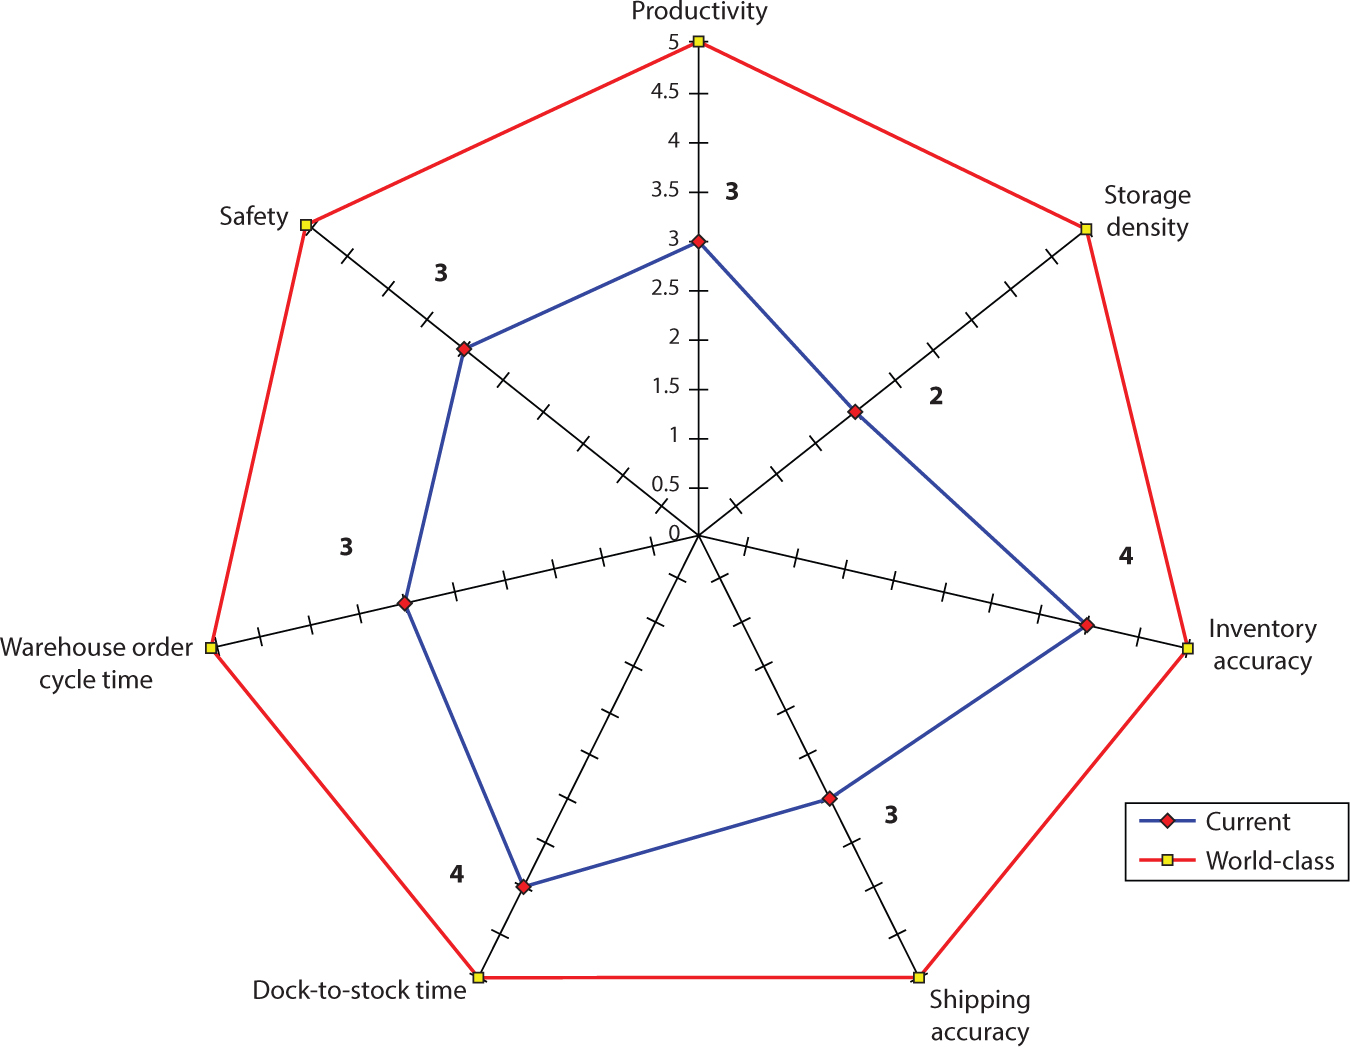
3.5 Warehouse Performance Gap Analysis
We often assess our clients’ performance with our warehouse performance gap analysis (Figure 3.21). The analysis indicates to the client their standing versus world-class norms. The (spokes) represent the key performance indicators for the operation. The outer ring defines world-class performance.
In the example, the warehouse performance indicators are productivity (lines per hour), storage density (case storage capacity per square foot), inventory accuracy, shipping accuracy (percent of lines shipped in error), dock-to-stock time, warehouse order cycle time, and safety. The annual savings opportunity for attaining world-class warehousing is $1.7 million per year, leading to a justifiable investment in a RightHouse initiative of $857,000 (Figure 3.24).
The value in the gap analysis is the single-page, graphical presentation of the multi-performance profile. The analysis quickly points out weak and strong points in the performance of the operation. The gap chart also can be used to establish project goals. For example, in Figure 3.21 the inner ring may represent the current performance of an operation. Another ring may represent the goals of a reengineering project.
The gap analysis also can be used to justify capital expenditures for new information- and/or material-handling systems. Because the chart quantifies the gap relative to world-class metrics, we can compute the annual financial benefit (i.e., cost savings, cost avoidance, and/or revenue increases) of closing the gap in each performance area. The estimated annual benefit in relation to corporate payback goals suggests an appropriate investment to close the gap.
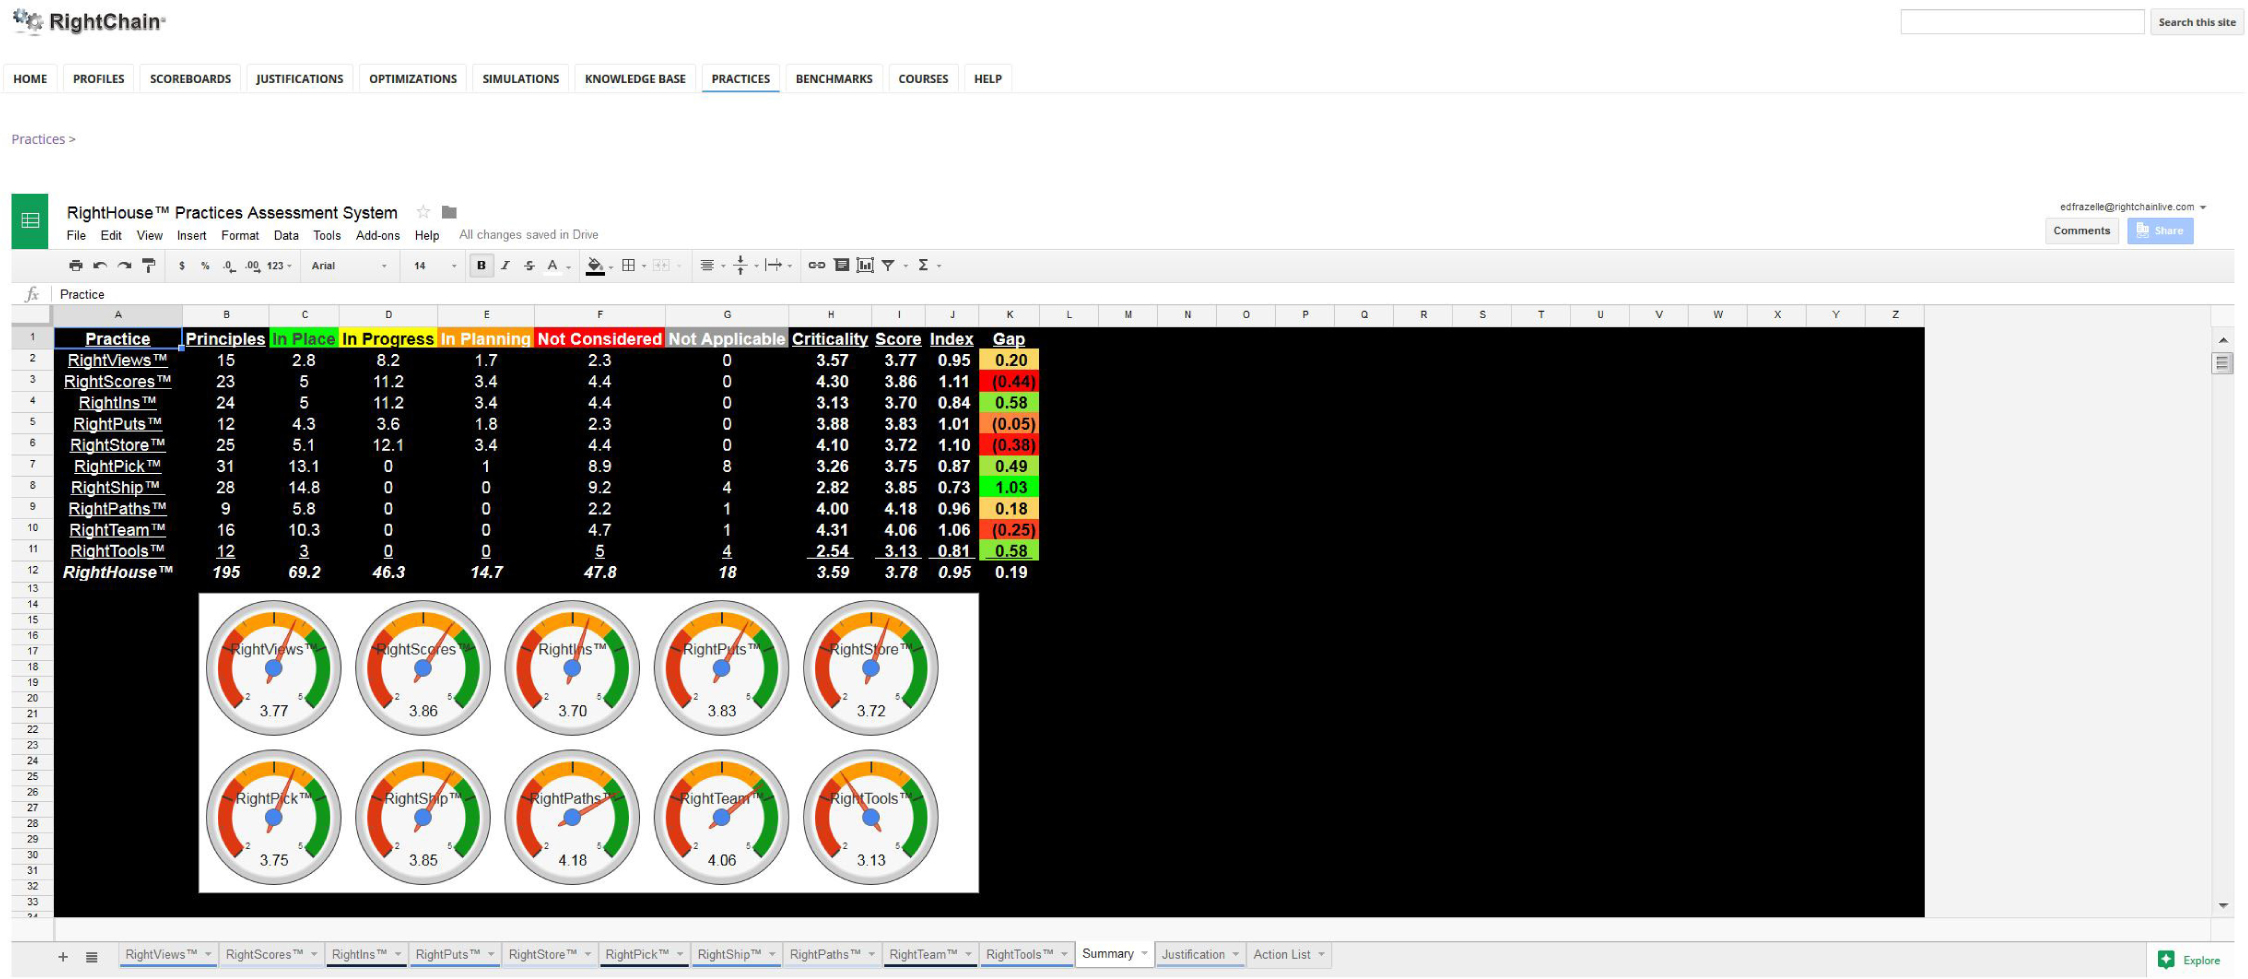
3.6 Practice Makes Perfect
After presenting all this analysis, I am often asked what separates world-class performers from the rest of the pack. After all is said and done, the distinguishing feature of world-class warehouses is their practices. You often hear coaches say that their teams perform the way they practice. It is the same in warehousing. The warehouse performs as a function of its practices.
I developed a warehouse practices gap analysis similar in concept to the warehouse performance gap analysis. As you may have guessed, it is called warehouse practices gap analysis. An example is illustrated in Figure 3.24. Each of the radials represents one of the functional areas in the warehouse. As before, the outer ring defines standards. The current warehouse practices RightHouse are plotted relative to the world-class definitions. As before, this technique can be used to set project goals, to assess benchmarking partners, and in this particular example to conduct a functional evaluation of a warehouse management system. The major difference is that practice descriptions are not quantifiable. Instead, we have defined for each functional area (i.e., receiving, put-away, storage, replenishment, slotting, order picking, shipping, communications, and work measurement), world-class (stage 5), middle-class (stage 3), and no-class (stage 1) practices. This book is essentially a journey through the world-class practices included in a RightHouse™ Assessment.
Figure 3.22 RightHouse financial opportunities assessment.

Figure 3.23 Warehouse performance simulation screen.