
Drivers of Sustainability in Design
Legislation and Perceptions of Consumers and Buyers
Abstract
This chapter covers the issues driving the designer to adopt a more sustainable approach to engineering design. This also covers in brief the thrust and effectiveness of current legislation in the key developed and emerging economies, before critically considering a number of tools currently used for measuring sustainability in industry and products, and closes with an analysis of nonlegislative drivers working toward the triple bottom line.
A number of studies conducted in the first decade of the twentieth century concluded that current growth rates in both human population and resource consumption were unsustainable and that “unfettered” or natural capitalism would not curb that growth. It followed that legislation should be introduced nationally and internationally to address the issues identified. Indeed, the Stockholm Conference of 1972 proclaimed that “The protection and improvement of human environment is a major issue which affects the well-being of people and economic development throughout the world and it is the duty of all government and people to exert common effort for the preservation and improvement of human environment, for the benefit of all people and their posterity” [1].
8.1 Legislation
Legislation to date has followed the “trends” of political pressure and popular science and has hitherto largely reflected the clear and present impacts on society of the extraction and use of natural, indeed, largely mineral resources. In the latter part of the twentieth century, legislation was focused first on pollution, then on fuel consumption and use, and finally on carbon emissions.
As the global economy began to grow, with a shift of the production of white goods and other domestic consumable goods together with some industrial machinery and equipment to cheaper Far Eastern producers, we also saw an increase in the use of nonrecyclable packaging materials and systems, designed to protect and preserve the product en route to market. At the same time, marketers were developing more sophisticated packaging to make their products more convenient, appealing, and attractive to the consumer. Under pressure from the environmental lobby, and led in the EU by Germany, some countries started to put pressure on the suppliers to take responsibility for the disposal of this packaging, in an effort to reduce the use of nonessential packaging and increase recycling of such packaging as was used.
Similarly, the developed world, driven by labor cost increases, has moved to a situation where
(a) domestic appliances have become uneconomic to repair and are therefore discarded after a relatively short working life;
(b) mobile technologies such as mobile phones and I-players are increasingly seen as a fashion item and discarded well before the end of their useful life;
(c) governments in the developed world put pressure on the automotive and other mobile equipment industries to discard old, less efficient machinery rather than repair it, as the older machinery is seen to be more “polluting.”
Thus, the reaction to the issue of carbon and other emissions and to the shift from disposal to recycling has been led by legislation on the one hand and by the adoption of positive reinforcement programs on the other: leading brands are demanding a “greener” appearance, and the richer market segments in both developed and developing world are often prepared to pay a premium for what are perceived to be greener products.
Although the broader arguments can be said to have been won, legislation has not been consistent across the globe. The subsections later in this chapter are intended to give a brief examination of the overall thrust of environmental and sustainability legislation in some of the world's key economies.
8.1.1 The United States
In the United States, the role of environmental protection falls to the EPA, which produces regulations based on the laws written by congress and presidential orders (EOs), issued by the president's office.
Thus, the basic laws include sweeping legislation such as the clean air and clean water, and environmental policy acts and the EOs include EO13211 Actions Concerning Regulations That Significantly Affect Energy Supply Distribution or Use.
In addition to the specific regulations on calculating and reporting fuel economy and exhaust gas emissions including the “gas guzzler tax” for vehicles, there have been a number of regulations passed on stationary power sources, including requirements for existing sources for pollutants to use best practice and prevent significant deterioration in their operational effects. More recent legislation has focused on water pollution and water resources development, including Underground Injection Control for Geologic Sequestration (or CCS)—the issue of using underground facilities (e.g., oil and gas wells) to store captured carbon as a carbon offsetting measure [2].
In the built environment, the emphasis is on energy use reduction, and the US department of energy has issued guidelines on such issues as insulation, and local or state building codes often exceed those basic requirements in terms of R values or insulation thickness [3]. Following a number of studies and surveys, including US Homebuilder survey in 2006 [4], observers have concluded that the demand for “greener” homes has increased, not the least because of potential cost savings. There has been some adoption of the UK's BREEAM and LEED certification systems via US Green Build Council, and corporate buyers are apparently prepared to pay up to 4% more for a LEED-certified building [5].
We will examine the BREEAM and LEED certification system and principles later in this section to draw any lessons that can be learned in applying these principles from the built environment into the mechanical engineering design environment.
Academics and engineering bodies such as ASME are lobbying hard to persuade industry in general of the economics of sustainable design [6] and to indicate that legislation in the EU and elsewhere is ahead of the United States in this field. Some work has been published in the United States on the use of whole life cycle analysis in engineering design and the benefit to the triple bottom line [7], and the concepts have been adopted by forward-thinking manufacturers.
There is, however, relatively little legislation affecting design and material choices, as focus has been on the effects of the production and use of products rather than the embedded issues engendered by design practice.
8.1.2 Canada
Environment Canada uses a number of acts, regulations, and agreements to fulfill its mandate to preserve and enhance the quality of Canada's natural environment. The key instruments are the regulations covering issues such as emissions and waste disposal on land and at sea and the use of toxic substances in manufacture and processing.
In addition, guidelines and codes are issued for environmentally sound practices and objectives for desirable levels of environmental quality. These provide a scientific basis for the development of environmental quality objectives and for performance measures for strategic options and risk management initiatives [8].
These guidelines cover emissions, waste, environmental quality, etc., but, as with the United States, do not yet cover the concept of sustainability by design.
8.1.3 Europe
As with other states and groups of states, the EU led first on pollution issues including SO2, NO2, and similar pollutants (1999/30/EC) and then considered waste issues (including WEE directives 2002/95/EC and 2002/96/EC, now revised as 2012/19/EU). This directive was specifically aimed at restricting the waste in electronic equipment, often exacerbated by the short life cycle and rapid obsolescence of this equipment. It also had the effect of driving a reduction in the use of hazardous substances in electrical and electronic equipment, promoting recycling and reuse of equipment and reducing the use of heavy-metal elements. The broader policy was aimed at reducing waste going to landfill and shifted the emphasis from waste as a burden to waste as a resource. Targets across domestic and industrial waste are to recycle 50% of municipal waste and 70% of building waste by 2020 [9].
More recently, the EU has recognized that “Over 80% of all product-related environmental impacts are determined during the design phase of a product” and in response created a directive (2009/125/EC), which is to form the framework for the setting of ecodesign requirements for energy-related products. Under this directive, it is argued that the production, distribution, use, and end-of-life management of energy-related products (ErPs) are associated with a considerable number of important impacts on the environment, namely, the consequences of energy consumption, consumption of other materials/resources, waste generation, and release of hazardous substances to the environment. It uses the directive to define conditions for setting requirements for key properties and characteristics of products and will be followed by “implementing measures,” which will act in lieu of firm legislation [10]. Compliance with this directive is nonetheless required for CE marking.
The Ecodesign Directive foresees two types of mandatory product requirements:
A Specific requirements, which
• set limit values, such as maximum energy consumption and minimum quantities of recycled material.
B Generic requirements, which
• do not set limit values;
• may require, for example, that a product is “energy-efficient” or “recyclable” (compliance with the relevant harmonized European standard gives presumption of conformity with the requirement);
• may entail information requirements, such as material provided by the manufacturer about best practices to use and maintain the product in order to minimize its environmental impact;
• may require that the manufacturer perform a life cycle analysis of the product in order to identify alternative design options and solutions for improvement.
The regulations are to be phased in based on specific groups of products: the ecodesign committee has identified a list of “high”-energy-consuming machinery and equipment that will form the first focus of design improvement regulations.
The following is an indicative list of product groups covered by this working plan:
• Air-conditioning and ventilation systems;
• Electric and fossil-fueled heating equipment;
• Food-preparing equipment;
• Industrial and laboratory furnaces and ovens;
• Machine tools;
• Network, data processing, and data storing equipment;
• Refrigerating and freezing equipment;
• Sound and imaging equipment;
• Transformers;
• Water-using equipment [11].
The EU has also been addressing the issue of waste reduction by considering the waste hierarchy. Directive 20008/98/EC sets out five steps for dealing with waste, ranked according to environmental impact—the “waste hierarchy” [12].
Prevention, which offers the best outcomes for the environment, is at the top of the priority order, followed by preparing for reuse, recycling, other recovery, and disposal, in descending order of environmental preference (Table 8.1).
Table 8.1
Waste Hierarchy [12]
| Stages | Include |
| Prevention | Using less material in design and manufacture. Keeping products for longer reuse. Using less hazardous materials |
| Preparing for reuse | Checking, cleaning, repairing, refurbishing whole items or spare parts |
| Recycling | Turning waste into a new substance or product. Includes composting if it meets quality protocols |
| Other recovery | Includes anaerobic digestion, incineration with energy recovery, gasification, and pyrolysis that produce energy (fuels, heat, and power) and materials from waste; some backfilling |
| Disposal | Landfill and incineration without energy recovery |
In addition to considering emissions and waste, EU directives have also reflected the EU's increasing attention on energy use and efficiency, covering efficiency of boilers, fluorescent lighting, household appliances, etc., and of course efficiency and emissions of passenger vehicles and construction equipment. In addition, there have been directives aimed at promoting sustainable and renewable energy generation.
The EU directives are adopted by the EU member states and enshrined in their local laws. The room for maneuver to transpose directives, especially the so-called framework directives into national law, is often substantial and can lead to large interpretation differences and subsequently in different environmental ambition levels.
It pays, therefore, to look at two key examples of legislation within EU countries.
8.1.4 The United Kingdom
The UK legislation is based on EU legislation and directives, and the Environment Act 1995 covers air, land, and water pollution and empowers the Environment Agency to intervene to ensure quality of air, water, or land. It also outlines a national waste strategy and defines responsibility for waste disposal between producer and consumer. The Waste and Emissions Trading Act 2003 was modified by the Waste (England and Wales) (Amendment) Regulations 2012, which came into force on 1 October 2012. The amended regulations relate to the separate collection of waste. From that date, it also imposes a duty on waste collection authorities, when making arrangements for the collection of such waste, to ensure that those arrangements are by way of separate collection. These duties apply where separate collection is “necessary” to ensure that waste undergoes recovery operations in accordance with the directive and to facilitate or improve recovery and where it is “technically, environmentally and economically practicable” [13].
DEFRA has also recently consulted on the waste hierarchy. The resulting report will amend the current guidance, which is based on life cycle assessment, by taking into account ecological footprinting and other evidence-based views, including
• high- and low-efficiency energy recovery;
• open-loop recycling, for example, of glass and plastics;
• plastics energy recovery versus landfill; and
• paper energy recovery versus composting.
The waste hierarchy has been transposed into UK law through the Waste (England and Wales) Regulations 208. The regulations came into force on 29 March 2008. The provisions relating to the hierarchy (set out in Regulations 12, 15, and 35) came into force on 28 September 2008. The regulations place a responsibility on businesses that produce or handle waste (including local authorities on behalf of the public consumer) to take all reasonable measures initially to prevent waste and then to reuse, prepare for reuse, recycle, recover, or dispose waste. The definitions of these categories are based on EU directive 2008/98/EC. Schedule I of the regulations sets out a nonexhaustive list of disposal operations [14] and includes the policy interpretation of the waste hierarchy.
8.1.5 Germany
According to the EU's Europe Web site, Germany has no specific legislative act covering sustainability, “but rather a sustainability strategy.”
This strategy is the responsibility of the federal government and contains 21 topics mapped to 35 goals [15].
The strategy is supported on four key pillars:
• Responsibility to future generations
• Quality of life
• Social cohesion
• International responsibility
The key priorities are as outlined in the succeeding text:
1 Sustainable business and commerce—today's business taking responsibility for tomorrow at an individual company level. Correctly formulated, such policies should lead to a competitive advantage.
2 Climate and energy—the key driver is the 50% reduction in 1990 level greenhouse emissions by 2050, to mitigate the predicted global temperature rise of 2C.
3 Sustainable water—access to clean water is a key basis of life on earth. The standard of German groundwater has improved markedly over the past years due to strict regulation of and high investment in wastewater treatment.
One of the key implementation rules is that the producer is responsible for environmental impacts of its processes and products. This includes issues relating to material selection and use. The remaining rules cover issues such as the (restricted) use of nonrenewable materials and energy sources, the need to build an inclusive society, and the need for public organizations to embrace sustainability in all its aspects [16].
The resultant legislation has included energy legislation, such as the Combined Heat and Power Act (KWKG) and Energy Conservation Act (EnEg) in 2008. Much of the legislative effort has been in the form of support and empowerment, rather than punitive. Thus, schemes such as Bürger initiieren Nachhaltigkeit (“Citizens Initiate Sustainability”) were launched to ensure the involvement of the population as a whole.
The Germans were early leader in the use and recycling of packaging and the introduction of the green dot (grüner Punkt) label. The legislation (Verpackungsordnung) is aimed squarely at the producer. In a B2C (business to consumer) transaction, the business (producer) has an obligation to participate in one of the nine recognized recycling schemes. The packaging in this case includes anything that is “unpacked by the consumer,” including transport packaging. The legislation applies to all B2C suppliers into the German market, regardless of country of origin.
In B2B sales, there is no such obligation, although companies are often obliged to account for their total packaging material usage and shipping pallet accounts are generally held between logistics companies and their clients, where the pallet has a fairly high monetary value, to encourage both the adoption of the standard “Euro”-pallet (1200 × 1000 mm 4-way entry) and their repair and reuse rather than wastage.
The result of this general approach to packaging has been a perception by the public and the producer that unnecessary packaging is to be avoided and the use of nonrecyclable packaging materials has declined sharply [17].
The German government also reports regularly on the effectiveness of their legislative approach. For instance, from the 2012 report by the Bundesamt für Statistik,
• indications are that although overall usage is down due to the world downturn, energy efficiency savings at just under 30% are not quite on target;
• in resource usage efficiency, however, they are much closer to target at 83% of 1990 rates of use;
• similarly, greenhouse gas emissions are reducing in line with target at just under 75% of 1990 levels.
It is clear from the internal reports that financial issues have been dominating the legislative mind over the last few years: the rate of introduction of specifically “green” measures has declined during that time [16] (Figure 8.1).
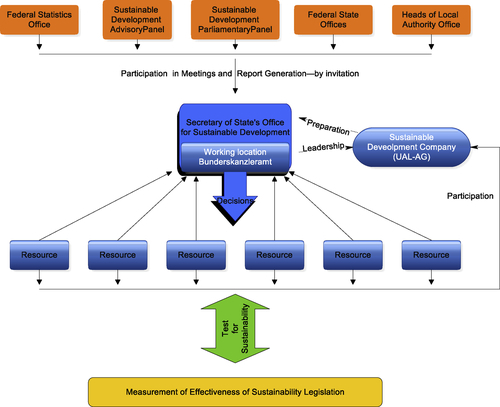
Figure 8.1Implementation of German Environmental Legislation [18].
8.1.6 BRICS Nations
8.1.6.1 Brazil
Despite Brazil's emergence as a global economic power, its massive environmental resources, and its environmentally conscious people, many Brazilian companies and politicians have still not fully taken onboard sustainable development as a strategic priority. The ongoing debate about a forestry law that could encourage deforestation has exposed deep divisions in Brazilian society. To date, there have been less emphasis on issues of energy efficiency and recycling and more on the protection of the natural environment. Recycling rates are only at around 26%, but about 50% of Brazil's energy supplies are from renewable resources (hydro and biomass).
Since 1981, Brazilian legislation has focused on environmental impact of industrial activity. There is no longer any environmental damage that is released from proper remediation: strictly speaking, pollutant emissions are no longer tolerated. The bottom line of this new legislation is that even a polluting waste tolerated under the established standards may cause environmental damage, thus making the polluter liable for redress. This entails the concept of strict liability, by which an industry undertakes all risks inherent to its activity: damages are no longer to be shouldered jointly with the community [19].
8.1.6.2 Russia
Russia does not currently have a well-developed system of environmental regulations and standards, and most notably, it lacks a procedural framework. Therefore, Russian environmental specialists, despite their deep professional knowledge, are not fully experienced with implementing international regulations for environmental assessments and environmental management. Without developing new methods adapted to national and regional characteristics, specifically addressing regional environmental issues on the one hand and a detailed approach incorporating international environmental procedures on the other, the sustainable development of the Russian economy appears difficult, if not impossible [20].
According to Russian official sources, the environmental situation typical of densely populated urban and industrial areas (constituting 10-15% of the country's territory) is “alarming.” Examples are as follows:
• Systems of industrial and domestic waste handling are inadequate in Moscow and other cities. 1.8 billion tons of toxic waste has accumulated and this increases annually by 108 million tons.
• The potential for energy savings in Russia is vast. For example, the potential for energy efficiency gains is estimated at 400 mtoe (compared with annual natural gas production of 490 mtoe).
• Industrial and vehicle emissions cause severe air pollution in many cities.
The current position is one of the unclear legislations applied inconsistently across the Russian federation. As the Russian economy grows, we expect new and tighter legislation on emissions and waste disposal [21].
Pressures on the state budget have, however, led to constraints on funding for environmental policy, institutions, and enforcement. Sovereign guarantees for environmental loans have been unavailable for several years. The rate of public and private investment in environmental projects is critically low. Massive technological and management modernization is needed—including in environmental technology, much of which will need to come from abroad [22].
8.1.6.3 India
Article 48-A of the constitution lays down the fundamental approach to environmental protection, namely, “The State shall endeavour to protect and improve the environment and safeguard the forests and wildlife of the country.” The constitution then goes on under article 51-G to indicate that all citizens are responsible for the protection of the environment. The 1974 42nd amendment of the constitution makes it the state's responsibility to actively protect and improve the environment [23].
The Union and State lists, under which Union and States, are empowered to make laws and both encompass the same subjects (industry, mines and minerals, and rivers and fisheries), with land and colonization an additional subject under the State list. The common list under which both may legislate includes wildlife and forest protection and population and social planning [24].
Consequently, laws have been enacted on some of the subjects such as the following:
• The Factories Act 1948
• The Insecticides Act 1968
• The Water (Prevention and Control of Pollution) Act 1974
• The Air (Prevention and Control of Pollution) Act 1981
• The Forest (Conservation) Act 1980
• The Wildlife (Protection) Act 1986
• The Environment (Protection) Act 1986
As with many other developed and developing economies, to date, there has been no specific legislation enacted dealing with sustainability in product design and manufacture. The emphasis is on the protection of the environment in terms of pollution and emission control and public safety.
Legislation alone does not guarantee sustainable development. The situation is made more difficult in India as enforcement and implementation are not straightforward. Rules can work as a driver toward conservation: for instance, those that are inbuilt in the permission system force industries to take environmental issues into consideration [25].
Also, India is a signatory to many of the international treaties bearing directly on environmental protection and sustainable development and takes an active role in prosecuting polluters.
8.1.6.4 China
The Chinese government recognizes that the current patterns of economic growth are not environmentally sustainable. As a result, they built a comprehensive regulatory and institutional framework for environmental management in the late 1990s. The set of five-year plans (FYPs) contains a number of quantitative, time-bound targets and is linked to project programming designed to meet these targets. The environmental regulatory framework expanded particularly rapidly between 2000 and 2004 when a number of new environment laws were enacted, such as the law on environmental impact assessment (EIA) and the law on cleaner production. In this period, a number of other legal acts were also amended, including the Environmental Protection Law (EPL) as well as the Air, Water, and Waste Prevention and Control Laws. The legal system is supported by a number of specific regulatory instruments for industrial pollution control, including environmental quality and emission/discharge standards, the discharge permit system (DPS), “three synchronizations” (“3S”), and EIA.
The national environmental agency has been strengthened since the turn of the century, leading to the creation of a State Environmental Protection Administration (SEPA) placed directly under the State Council.
As with India, sustainability in the built environment is beginning to gain ground as an issue, but there is still no impulse to drive sustainability in engineered products, except conformity with the legislation of the target markets for any exported product [26].
However, since 2007, there has been a joint initiative with the Environmental Protection Agency of the United States to strengthen the application of the law in China. The resultant pressures have improved compliance measures and allowed an information and best practice exchange and led to a joint US-Chinese statement on climate change in April 2013 [27].
It has also helped stir the debate in 2010 into the “unacceptable” pollution levels from Chinese industry, leading to operational activity such as China's Green Fence initiative, designed to halt dangerous goods scrap dumping in China by applying the existing rules under Article 12 more rigorously. Article 12 states “In the process of importing solid waste, measures shall be taken to prevent it from spread[ing] seepage and leakage or other measures to prevent pollution of [the] environment” [28].
8.1.7 Japan
Japan's approach to environmental legislation is to control pollution levels in
• air;
• water;
• soil and land, including ground subsidence;
• noise and vibration.
The Basic Environment Plan is based on the basic plan for environmental conservation Article 15, the Basic Environment Law, and was decided by the cabinet while consulting the Central Environment Council. It was approved on December 1994. It declared the basic idea for environment policy based on the principles of the Basic Environment Law and four long-term objectives of cycle, harmonious coexistence, participation, and international activities and looking to the mid-twenty-first century. It also indicated the direction for measures to be taken for the early twenty-first century, to be developed comprehensively and systematically [29].
The introduction of the basic laws in 1993 was backed by sizeable public support, and implementation of the basic plan has helped Japan tread a careful balance between economic growth and the maintenance of the environment. Unlike in Europe and the United States, the Japanese government has traditionally taken on the role of guardian of the environment, and lobby groups and NGO have enjoyed scant support. The law requires EIA for any major project, and local ordinances can often require EIA even for smaller projects. Waste management is also a key issue, and regulations are strict.
Following the early days of cleaning up ground and water pollution, there was a focus on regulating vehicle emissions and noise, and this has helped drive the growth in research into hybrid and electric vehicles.
Since the disaster at Fukushima, the government has been wrestling with balancing the issue of increased safety standards and increased use of fossil fuels.
There is, as yet, no legislation or guidance on design impacts for sustainability.
Nonetheless, the 2010 OECD review of Japanese policy remained broadly positive in terms of the effect of the legislation, but recommended that such legislation be updated, and also recommended the increased use of financial and commercial instruments to reduce emissions [29].
8.2 Effectiveness of International Environmental Regimes and Legislation
Measurement of efficiency or effectiveness of environmental legislation requires either empirical observation of alternative regimes for comparison or calculations based on theoretical models that do not abstract away determinants of efficiency that are critical in practice. According to OR Young [30], the former are generally absent, while the latter too restrictive to generate reliable guides. Indeed, there are still issues regarding the effectiveness of environmental impact assessment work in terms of
• the quality and veracity of data,
• the inability to compare with “control” or nonintervention situations,
• the lack of follow-up on EIAs.
All of which tends to lead to a “fit-and-forget” approach to expert interventions for specific projects [31].
Even the European Environment Agency (EEA) declared in 2001 that although there was no shortage of reporting obligations imposed on member state governments, there are often complaints about “reporting fatigue” from the more than 100 pieces of environmental legislation in force, and the majority of European Union measures require greater effort to demonstrate their effects on the environment [32]. “Evaluation should not be an afterthought,” said the report, outlining a number of measures, including explicit quantified objectives combined with timetables for their achievement:
• A preference for “evaluation-friendly” instruments over less quantifiable policies, for example, economic instruments rather than information and awareness campaigns
• A requirement for baseline monitoring prior to the implementation of measures, facilitating “before and after” comparisons
• Greater provision for pilot projects in order to facilitate fine-tuning
The UK DEFRA commissioned a report on enforcement of environmental legislation in the United Kingdom in 2006 and concluded that 70% of regulatory breaches were dealt with by the issuance of cautions and warning letters as a means of obtaining compliance, followed where required by enforcement notices. It is difficult to assess whether fines imposed are proportionate to the seriousness of the breach or effective as a deterrent. Similar views were expressed by Emma Bethell in the Plymouth law review of 2009, who also indicated that prosecutions had been made under the “polluter pays” principle, and reflected that the rules of strict liability allow for a relatively straightforward approach to prosecution. The downside, however, was that there was little differentiation under law between negligent and unintentional pollution [33,34].
According to the DEFRA 208 report, the push for higher recycling of domestic waste has resulted in over 40% recycling in 2010/208 compared to 8% a decade earlier. The improvement in commercial waste recycling has been less dramatic: from 42% to 52% over the same period. Of the 8.3 million tons of waste produced in the United Kingdom annually, currently, a vanishingly small proportion is used to generate power, whereas the potential is of the order of 3-5 TW h. Around 1 TW h is generated from anaerobic digestion of sewage sludge; however, more could be done by diverting waste from landfill to AD. Landfill rates at 50% are still higher than the EU average of 42%. Direct emissions from the waste management greenhouse gas inventory sector in the United Kingdom accounted for 3.2% of the UK's total estimated emissions of greenhouse gases in 2009 or 17.9 million tons CO2 compared to 59 million tons CO2 in 1990. Of the 2008 total, 89% arises from landfill, 10% from wastewater handling, and 2% from waste incineration [35].
The Chinese government has identified inadequate enforcement as one of the key factors in China's deteriorating environmental situation. The 9th, 10th, and 8th FYPs emphasized the need to strengthen environmental enforcement and compliance assurance. In this context, a number of enforcement activities have been carried out, closing down or penalizing most polluting industries. The legal system has been built up to fight against noncompliant firms, and the courts have been brought in to support the prosecution of environmental offenders. The public has been gradually engaged in noncompliance detection and compliance promotion [26].
In general, then, the effectiveness of legislation, local or international, is a subject much studied by social scientists and lobby groups but little understood by the lawyers and lawmakers [27].
Such studies, as are conducted, are often
• limited in scope to one effect of one piece of legislation (e.g., CO2 emissions as a result of legislation on vehicle exhaust emissions);
• conducted by public lobby groups to demonstrate a lack of progress in their specific area or to gain a specific and limited end;
• undertaken and reported by social scientists, whose papers and symposia are not necessarily followed by the legal and legislative professionals;
• undertaken by governmental bodies to demonstrate the success of their apparent or real adherence to international standards and laws;
• undertaken by industry-based specialists and lobby groups to militate against perceived adverse economic effects of following specific regulations and legislation;
• interpreted by specialists in legal or social fields rather than by those schooled in the science under consideration.
And cherry-picking results from specific surveys and studies are a potential hazard resulting from the plethora of such publications.
It is clear that the effectiveness of international standards and laws on environmental protection in any given country is also determined to some extent by the stage of development that country has reached. Empirical evidence is clear that there is a certain turning point in economic development, where increased economic welfare goes hand in hand with environmental improvements [36]. This raises important questions in relation to the level of development of the BRICs countries, whose potential to pollute far outweighs that of the currently developed world, due to demand-side pressures coupled with the fact that they may not have reached the critical point mentioned earlier.
In parallel with this argument runs the “race-to-the-bottom” argument, where heavy polluters choose deliberately to relocate their “worst” activities in those countries and states where economic development and technical development are not so advanced, and there is therefore less attention paid to the results of heavily polluting production and extraction processes. For example, Kolstad and Xing argued that the laxity of environmental regulations in a host country can represent a significant element in foreign direct investment decisions from the US chemical industry. The more lax a country's regulations are, the more likely the country is to attract foreign investment [37].
The conclusion we may draw from the wealth of literature available on the subject is that the trend toward the adoption of a positive and preventative approach to sustainable production and use is driven by a combination of the following:
• Reactions to existing legislation both at home and in other “target” markets
• Anticipation of further impending legislation or regulation
• Reaction to public perception and media pressure
• The desire to be seen as a leading exponent of environmentally sustainable production
• The extent to which sustainability can be built into a “total” product or service without making a significant impact on profitability
Thus, the pressures on producers of goods and services and examine at a high level some of the measurement and guidance tools.
8.3 Nonlegislative Measurement and Guidance Tools
Much of the regulation and legislation since the 1960s have involved determining compliance levels for pollution emissions. However, other environmental management tools have also been developed. These include environmental auditing, environmental accounting, environmental reporting, life cycle assessment, environmental management systems, risk assessment, and environmental impact assessment.
Most of these tools have been developed by research and educational institutions and are now used commercially to assist in the measurement by commercial enterprises of their environmental impact or that of their products. Some are focused on carbon fuel consumption or carbon emissions' equivalence, and others take a broader view of other resource depletions or a qualitative view of environmental impact assessment.
Current focus is largely on resource consumption or energy-based and carbon-based models, including EIA, Eco-Rucksack, and carbon footprint.
Some other systems, such as EAI and IDEA abacus, are more qualitative in nature and are intended to guide the design process and thinking, rather than to produce measurable outcomes on which to base material selection manufacturing process or other key design decisions.
The growth industry in the development of “eco” tools in the engineering sector has been the development of software applications that can measure or indicate the relative merits of materials and manufacturing methods. Allied to a database of such materials, to which carbon, toxicity, resource depletion, or other values have been assigned, and to a second database of production methods, to which typical carbon emission data, etc., have also been assigned, the resulting algorithm can give an indication of the relative merits of alternative components and design approaches when designing quite complex systems. One such algorithm has been developed by Granta at Cambridge University in the UK, and is described in 8.3.5.
There are a number of detailed reviews and critiques of the currently available models. A recurrent criticism is that the model needs to be simple in application in order to allow ease of use. At the same time, it must be robust enough to encompass data and information from many sources and produce a “typical” value for the component or item under consideration while being flexible enough to differentiate between embedded energy obtained in a sustainable way and that of nonsustainable energy. We also find that some of the models lean toward a simplistic calculation that does not take account of all stages of the total life of the product, from sourcing to reuse and disposal.
A further detailed review and comment on efficacy of the leading models, databases, and algorithms will form the basis of ongoing research and a future publication from the authors of this book and will lead to further research and the development of our own sustainability model, the SLV (sustainable life value) that is outlined in concept elsewhere in this book.
For the present, we will focus on the early models, such as EIA (environmental impact assessment), Eco-Rucksack, and carbon footprinting. We will then give a brief outline of outline some of the current LCA programs.
8.3.1 EIA: Environmental Impact Assessment
Environmental impact assessment (EIA) was introduced under the US Environmental Policy Act in 1969 to identify the possible impacts of a proposed construction project on the environment. A similar approach has been adopted by most developed and many developing countries, often embedded into their legislation program.
It is intended to provide decision makers with an understanding of the probable environmental consequences of a proposed project and thereby facilitate the making of more environmentally sound decisions [38].
The standard steps in a typical EIA process are shown in Figure 8.2.
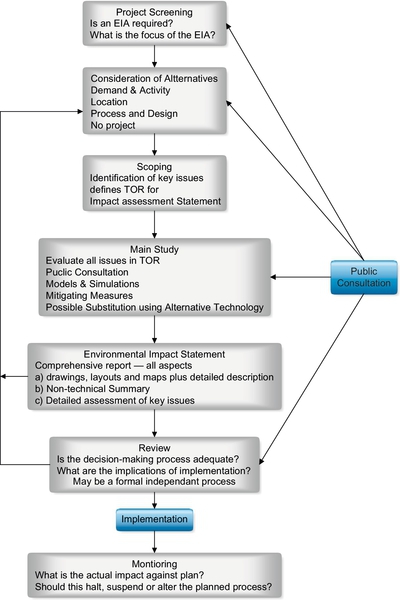
Since EIA is now widely used, there has been some debate as to its effectiveness as a mitigation tool. It is certainly seen as cost-effective on large projects, typically at less than 1% of total costs [38]. Initial concerns are centered on the fact that the institutional framework preceded any scientific basis for establishing EIA, leading to potential inaccuracies and poor decision. Overall, while EIA was seen to be an effective consultation tool, there was some concern about a “fit-and-forget” approach, focusing on the decision-making process and largely ignoring follow-up and the measurement of actual impacts; indeed, research conducted by C. Harmer concluded that greater and better use of follow-up is required to improve effectiveness [39]. The other main drawback to EIA is that it is generally impossible to make true comparison to either the status quo or an alternative strategy, although this may improve as predictive models are tested more robustly and improved in accuracy.
The built environment has been a key focus of carbon emission reductions along with (clearly) power generation and transport systems for goods, products and people.
What we have not seen is a serious review of the impact of broader engineering and product design on sustainability.
8.3.2 Eco-Rucksack
Eco-Rucksack is a tool based on the concept of NRE (natural resource efficiency), which seeks to decouple energy and material consumption in making a product from the economic performance of the product. The effect of NRE-based decisions has been to prolong in some cases the resource bank of finite resources and to slow consumption rates. Newer technologies, for example, tend to use resources more efficiently. However, the increasing demand created by and for these new technologies may result in the sheer volume of consumption outstripping any savings made in energy or resource terms, and this has informed much of the policymaking at national and international level. The finite levels of natural resources were addressed as long ago as already in 1972 at the UNCHE, albeit in broad terms. It was not until 2002 that the World Summit on Sustainable development (WSSD) sought to obtain general acceptance that current consumption patterns were unsustainable and that we should formally delink growth patterns from environmental degradation. However, it was also adopted without concrete targets, both from the lack of international will to agree to such targets and from a lack of usable scale of measure for any targets.
The Eco-Rucksack was then created as a measurement concept to address this lack. It seeks to measure the amount of materials used in relation to a products' entire life cycle, making some provision for issues of recycling and for “hidden flow,” that is, the indirect consumption associated with manufacture or production. A more accurate, less catchy term for this measurement is material input per unit of service. This is computed using a material flow analysis to give the total mass of material directly and indirectly used in making and using the product or item divided by its own mass. The inverse of this figure is the Eco-Rucksack ratio.
This can be a useful comparator when selecting, say, raw materials but must be used in conjunction with the other properties of those materials such as density, tensile strength, and fatigue resistance. It may well be that a material with a lower Eco-Rucksack ratio (RS factor) may be inferior in other ways. Nor can the RS factor take into account the importance of a product or service to human sustenance (using, for example, Maslow's hierarchy of human needs), which again may disallow judgments and decisions made simply on the basis of RS factor.
The RS factor will increase when one component of the materials used in its production process becomes less easily extractable or accessible, and this factor will decrease with enhanced material recycling. Sometimes, a simplified methodology is used without full life cycle approach, that is, for the assessment of the hidden material flows only for the production of a commodity without taking into account the extra materials (and energies) used for the extraction or disposal.
The term virtual material (VM) is also used in specific context, and it means the total amount of a particular material or substance used directly or indirectly for producing a commodity. The most frequent application of the latter concept can be met in relation to water resources, especially for the demonstration of virtual water transfer coupled with international trade of food, etc. It also applies to other “hidden” resource use such as overburden removed to allow access to mineral deposits or residuals from harvest in agriculture.
There are international aspects of this problem as well. When new technologies are installed and the older, less efficient (but still usable) technologies are transferred to less affluent partners, it may lead to an international rebound effect, where larger volumes of cheaper product are produced with greater ecological inefficiency and consequent adverse environmental impacts of the “country of origin.” Thus, the make-or-buy decisions to be sustainable must be decoupled from simple economics. This may also apply to old vehicles and equipment exported from the developed world due to fiscal and other pressures and legislation. Such technologies or products can contribute to well-being, relatively higher standards of living, or even poverty reduction of the recipient community (e.g., in terms of energy poverty), but in a global sense, such a transfer will increase the overall ecopressure. At least, this secondary RB effect should also be taken into account together with relative RS-factor gain achieved in the country of origin [40].
Many examples could be mentioned for the Eco-Rucksack, including any form of mining (e.g., digging large rock tunnels in order to mine coal, where the rest of rocks do not directly enter the production process and the product itself), bottled or canned mineral water, timber or other furniture, rare earth, and modern infocommunication technologies, to name a few obvious examples. One of the more frequently quoted cases is that of platinum and the catalytic converter: “In order to extract one gram of platinum from a platinum mine, for example, we must displace and modify 300,000 grams of rock. Without platinum we would not have the catalytic converter in our automobiles. Two to three grams of platinum are found in one such catalytic converter, in addition to high-quality steels, ceramics and other materials. Thus, the ecological rucksack of the catalytic converter, i.e. the total amount of material translocated for the purpose of constructing it, amounts to about one metric ton of environment. This means in effect that the catalytic converter burdens the automobile with as much matter as the car itself weighs” [41].
8.3.3 Carbon footprint
Carbon footprint is a measure of the impact that our activities (by a person, organization, event, or product) have on the environment and in particular climate change. By creating a relative index, consumers can make an informed choice as to what products and services they may buy and consume, mindful of the environmental impact of the choice. A carbon footprint considers all six of the Kyoto Protocol greenhouse gases: carbon dioxide (CO2), methane (CH4), nitrous oxide (N2O), hydrofluorocarbons (HFCs), perfluorocarbons (PFCs), and sulfur hexafluoride (SF6).
The main types of carbon footprint for organizations are the following:
• Organizational carbon footprint—emissions from all the activities across an organization, including buildings' energy use, industrial processes, and company vehicles.
• Value chain carbon footprint—includes emissions that are outside an organization's own operations (also known as Scope 3 emissions). This represents emissions from both suppliers and consumers, including all use and end-of-life emissions.
• Product carbon footprint—emissions over the whole life of a product or service, from the extraction of raw materials and manufacturing through its use and final reuse, recycling, or disposal.
Life cycle assessment provides the existing and internationally agreed basis for calculating carbon footprints of goods and services in a robust way.
Data are generally collected throughout the entire life cycle at a consistent level of detail as in an ISO LCA, although not all emissions, resources consumed, and impact categories are evaluated. This limitation in scope raises the prospect of burden shifting—solving one problem while creating another. This can unfairly promote products that do not necessarily have a better overall environmental performance or environmental footprint.
In recent years, the carbon footprint has gained recognition as an indicator of the contribution of goods and services to climate change. It is often based on a life cycle approach but focuses only on the emissions linked to a product that contribute to climate change [42].
8.3.3.1 Carbon footprint initiatives
Retailers are becoming increasingly aware of the opportunities to improve the environmental performance of products and influence purchasing decisions. There are currently various activities to capture and record life cycle data on a range of household products and pass this information on to customers. This offers consumers a better understanding of the environmental impacts of their purchasing choices.
Some initiatives display carbon footprinting information on a wide range of products from potatoes to light bulbs. Retailers are beginning to present this kind of information on product labels. Some carbon labels are directly linked to the commitment of actively working to reduce greenhouse gas emissions. In addition to reducing their own carbon footprint, the benefit to retailers is that they are being seen as national and international leaders in engaging consumers on climate issues and helping them reduce their carbon footprint. In the case of one multinational retailer, more than 500 product lines have been or are in the process of being footprinted [42].
A number of private consultancy companies have been set up to offer a carbon footprinting calculation services or software to industry, indicating that the concept has a strong position as a unit of measure in the B2B and B2C market place. Some of these, including www.carbonfootprint.com, also offer offsetting programs, largely in the form of tree planting [43].
8.3.3.2 Pros and Cons of carbon footprint
• It allows measurement for services as well as goods and product.
• If computed accurately, it can allow make-or-buy and grow-or-import decisions to be decoupled from purely economic decisions.
• It tends to be the preserve of the well-meaning consumer in developed economies and does not inform choices of the developing world.
• It can lead to half-understanding the problem and incomplete systems measurement.
For example, the happy concert goers, who travel miles to a venue in their cars to attend an ecoevent where the sound and lights are solar or even pedal-powered, without realizing that the on-site energy savings are dwarfed by the energy consumed in travel, preparations, cleaning, etc.
• Carbon footprint calculation is based on an arbitrary or at least nominal sequestration rate and may lead to miscalculation of the effectiveness of offsetting measures.
• Different calculation tools often produce wide variations in the results [44].
• Carbon footprinting is only one measure of impact.
For example, some environmental impacts, notably those related to emissions of toxic substances, often do not covary with climate change impacts. In such situations, carbon footprint is a poor representative of the environmental burden of products, and environmental management focused exclusively on CFP runs the risk of inadvertently shifting the problem to other environmental impacts when products are optimized to become more “green” [44].
8.3.4 ECO-IT
ECO-IT as a simple tool concept was developed by Mark Goedkoop an industrial designer specializing in “ecodesign.” It came out of work undertaken on developing SimaPro life cycle analysis software in the 1990s. It is now managed by Pré Consulting. According to their Web site, “ECO-it allows you to model a complex product and most of its life cycle in a few minutes. ECO-it calculates the environmental load and shows which parts of the product's life cycle contribute most. With this information you can target your creativity to improve the environmental performance of your product.”
The program includes over 500 environmental impact and carbon footprint (CO2) scores for commonly used materials such as metals, plastics, paper, board, and glass as well as production, transport, energy, and waste treatment processes. These scores are like predefined building blocks to model product life cycle. The database can be edited and expanded to include client-specific materials [45].
This is one of several similar LCA programs. The keys to their use and efficacy appear to be the following:
(a) Ease of use and simplicity—if the application is overcomplex, designers will be less likely to use it.
(b) Veracity of database—the software needs to access well-established and creditable data on “environmental load.”
(c) The environmental load must be broader than carbon rating and should include issues such as resource scarcity and efficiency of primary resource production, including overburden and ore percentage issues in mining.
(d) The data for each item may not or indeed cannot easily differentiate between individual sources—for example, the difference between sourcing a drop forged component in Germany, India, or China would require and intimate knowledge of the specific equipment employed by the specific potential suppliers in each case.
(e) Their use should be seen as a guide or indicator rather than a definitive impact statement. The objective is then to compare alternative materials and methods of production to guide the designer in their choices at an early stage of the design process.
8.3.5 Granta
From detailed and extensive research applied to a good understanding of the issue facing production engineers, Granta has developed a comprehensive and interactive “material intelligence” design aid tool at Cambridge University. Granta was formed by Professors Mike Ashby and David Cebon at the Cambridge University Engineering Department.
The Granta research and development team became aware of the limitations of many LCA systems and specifically five key issues:
a. Sustainability improvement in design requires the designer to understand when and where the environmental impacts occur across the product life cycle.
b. Many of the commercially available LCA software packages have been developed with LCA practitioners in mind, requiring an expert knowledge of the methodology for both analysis and interpretation. Most designers and engineers do not possess this knowledge.
c. LCA software is unsuitable for use during the early stages of the design process as the requisite detailed knowledge of manufacture and use is not yet available to designers at that stage.
d. Designers' time is limited, and LCA can become another extraneous demand on that time.
e. The use of in-company or external consultants and specialists divorces the LCA analysis from reality in the designers' minds, preventing it from being integral to the design process.
In consequence, they have developed a series of simple tools that can be used early on in the design process, on the basis that “imprecise data can guide good decisions” during the design process. By allowing early evaluation of the alternatives, the systems enable changes to be made at a point in the design process where the positive impact of those changes on product cost and performance outweighs the negative impact of additional redesign and process engineering costs (see Fig. 8.3).

Figure 8.3Ecoimpact Dashboard [46].
Their tools are available to both academic users and private companies and corporations.
Their Eco Audit Tool produces a graphical representation of the key issues (such as CO2 footprint or embedded energy) across the life cycle stages of the item under consideration, with a focus on speed and ease of use, setting the confidence interval for the data accuracy at “sufficient” to guide decision making rather than pinpoint.
In addition, they have a CES Selector that allows the designer to compare, for example, Young's modulus against embodied energy or material mass for a range of materials, which, together with the restricted materials database, aids initial material selection for critical components.
The software has been designed to integrate with the more common CAD software programs, where the user can search and browse a database of materials and processes, apply these two parts within their model, and instantly generate an ecoimpact “dashboard”—see Figure 8.3. This allows interactive exploration of the effect of material selection changes [46].
8.3.5.1 EMIT consortium
The University of Cambridge has launched a collaborative project building on Granta's ecosoftware and data, with a goal of embedding ecodesign into routine engineering workflows.
The consortium includes many internationally renowned engineering companies and organizations, including Rolls-Royce, Boeing, NASA, Emerson, Honeywell, and Eurocopter. Two key focus areas are as follows:
• Restricted substance regulations (such as REACH)
• Ecodesign to meet objectives such as reduced energy or carbon footprint
The members of the consortium ensure feedback to Granta to improve and prioritize development of the design audit tools and to promote the use of these and similar tools throughout industry.
As these tools develop in both ease of use and integration with commonly used design software packages, their impact on design decisions will become more pronounced, and most forward-thinking companies will use them as standard practice.
8.4 Other Drivers of Sustainable Design
Apart from legislative drivers and the increasingly ubiquitous measurement tools, the chief drivers to sustainable design are financial and social.
8.4.1 Social drivers
In social terms, there is a segment of the market in the more affluent, developed world that has identified global temperature rise, growing demand on limited resource from a growing global population, and the need reduce waste to landfill as key problems facing their and their children's future. Since the majority recognize the benefits offered by the technologies of the developed world, including increased life expectancy, increased leisure and wealth, and improved communication, they are unwilling to reject technology altogether as the route to a reduced footprint and seek out instead those producers and manufacturers who have demonstrably engaged with the process of improving sustainability.
These aware consumers are led by the young, the “millennials” (18-32 year olds), and this group is as strong in Asia as in Europe or in the United States. According to Keeble, from Accenture's research, they are less interested in the view that sustainability in a product is gained by sacrificing performance or value for money and are more interested in positive impacts claimed by manufacturers and marketers. There is some indication from sources, such as TerraChoice, that these consumers are not given reliable information on which to base those decisions, and later on in the book, we examine some of the pro and con arguments raised by the debate on these issues [47].
Indications are that there is a good public awareness of energy savings, also spurred on by high energy costs. This has led, for instance, to the widespread adoption of low-energy lighting products and the phasing out of filament bulbs or to changed habits of switching equipment off rather than leaving it on standby and conservation of water and other resources by fitting lower-use equipment.
In Europe, at least, and driven by German activism and the legislation that followed, there has been a reasonable degree of success in tackling some of the problems and issues associated with packaging, especially second- and third-tier packaging.
Some consumer product suppliers have taken the opportunity to supply refill packs for product ranging from coffee to printer inks, reducing the cost of production and/or transport and increasing margins into the bargain.
Concern for carbon emission reduction has fueled a drive toward more efficient energy production. This is evident not just in large-scale power generation such as the move from coal to gas and renewables, but in the consumer goods arena from domestic boilers and space heating systems to mobile equipment and vehicles.
In the same vein, there is concern for energy efficiency, as this benefits the consumer not only in the longer-term more abstract manner by reducing carbon emissions and thereby impacting on climate change but also in the shorter term by reducing the cost of usage. As an example, we have selected the Dyson Airblade™ hand dryer. The hand dryer uses a highly efficient motor and high-velocity air “blades” to shear water from the hands, eliminating the need for air heating. The short cycle time also reduces energy use [48]. The unit has been designed to be robust in use, giving it a long working life, and is easy to dismantle to allow repair and recycling at the end of its normal working life, thereby allowing it to rank well at all points along the life cycle (Figure 8.4).
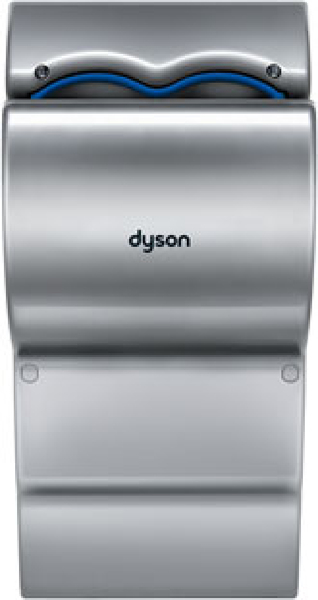
Figure 8.4Dyson Airblade Hand Dryer [48].
The brand of JCB, established in 1945, stood originally for robustness and durability. Like many responsible and growing global businesses, JCB has embraced the need for it to “realign its responsibilities in line with the changing world” [49]. These responsibilities cover the three elements of the triple bottom line:
• To respond to the threat of climate change
• To improve workplace health and safety to an even higher level
• To rise to the challenge of rebuilding global prosperity in the wake of the financial crisis
As an organization, JCB decided to make energy efficiency part of its strategic planning process. Working with the Carbon Trust, they have reduced their direct emissions by 27% since 2007, reduced their accident potential rate by 50%, and improved fuel consumption on their backhoe loaders by 16% [49].
The direct emission reductions have been obtained through a mixture of measures including the following:
• Increasing the recycled content of their water usage in their Indian facility to 40%
• Tracking energy consumption in real time and identifying waste in lighting and heating
• Monitoring air leaks and thus reducing compressor demand and output
• Raising staff awareness and integrating energy-saving measures into shutdown and PMS maintenance procedures and processes
The following are savings at a glance:
• Total project cost: £300,000
• Projected annual cost savings: £1,500,000
• Projected annual CO2 savings: 7800 tons [50]
Apart from looking at their own emission levels as an organization, JCB has focused on meeting and exceeding the increasingly stringent Stage IIIB/Tier 4i emission regulations for their own off-road vehicle engines. These emission regulations limit emissions from off-road vehicle engines and cover the EU and Japan and North America, respectively.
Using sophisticated design, including electronic fuel injection, variable geometry turbocharger, diesel particulate filtration (DPF), and selective catalytic reduction (SCR) in their engines, makes them fully compliant with Stage IIIB/Tier 4i and fully in tune with a cleaner world. The exact technology used on each product range is matched to the machine and application using sophisticated modeling techniques [51] (Figure 8.5).

Figure 8.5JCB Ecomax Engine [50].
8.4.2 Financial drivers
Basically, energy cost is a driver, so any low-energy product or “free” energy source looks attractive. Nonetheless, the high investment cost has driven government subsidies on renewable energy sources at an industrial and domestic level.
A reduction in material consumed (optimized component weights, bottle weights, etc.) should also lead to a cost reduction, as does a simplification of the design. Furthermore, the careful selection of material may also allow a more efficient manufacturing process, moving increasingly away from traditional machine removal-based manufacturing of milling and turning to the increased use of precision casting, stamping, cold forming, and most recently 3D printing, coupled with microremoval technology such as spark erosion and polishing. All of these developments have reduced embedded energy in a number of components at the same time as reducing production cost.
As we have mentioned earlier, the move from skilled bespoke fitting process to less skilled assembly has also saved cost and energy. Few machine tools these days require hours of scraping-in on bedways, and fewer engine and gearbox systems require shimming and the extensive use of marking blue much beloved of the author's time in the fitting shop as an apprentice. These changes have reduced assembly times and hence production cost. Furthermore, as part of a package including advanced seal technology and the use of sacrificial sleeves, they improve the sustainable life value (SLV) of a product by increasing operating life and improving ease of maintenance and repair. This approach was taken in the design of the rock drill gearbox as discussed in Chapter 3.11 earlier in the book.
Packaging improvements have been shown to benefit costs. These improvements are often about better design of packaging to allow reuse, reduction in weight thickness, etc., particularly of secondary and tertiary packaging, and the intelligent integration of the supply chain system to standardize the use of multiway secondary and tertiary packaging.
Examples of how this can be achieved include the following:
(a) Reduce packaging via elimination of a layer—see example in the succeeding text.
(b) Redesign to reduce volume, thickness, and hence weight of material, or substitution of one outer packaging type for another.
(c) Reuse.
Examples
(a) Elimination
A small spinning/weaving company in Lancashire used to pack a number of individually wrapped cloth “pieces” in a single polypropylene bale. Pieces are now only wrapped individually in polyethylene. The benefits of this change include the following:
• Polypropylene is no longer purchased and has been eliminated as a waste stream.
• Wrapped pieces can now be carried by hand (the bales had to be moved using a crane).
• Bales do not have to be sewn, thus reducing both labor costs and expenditure on bale hooks.
• More efficient use is made of container and aircraft hold space.
• Reducing transport costs and permitting a lower export price.
This process shows a cost and ecological benefit.
(b) Redesign/substitution:
banding for shrink-wrap. This not only reduces the amount of material used but also replaces a nonrecyclable material with a recyclable one.
(c) Using standardized reusable transport crates, sized to interlock on standard Euro-pallets, has allowed a major supermarket chain to eliminate one-way packaging altogether from its fresh produce supply chain [52].
In the author's direct experience, a pallet account was held by a company he managed in Germany with their main supplier of logistics services. By putting a monetary value on the standardized reusable Euro-pallets, their reuse and refurbishment were assured.
8.5 Conclusion
There are both positive and negative drivers pushing designers into embracing the concept of sustainability in design.
The negative drivers or in the classic “stick-and-carrot” approach are those coming from current and impending legislation, which drives manufacturers and producers to seek to produce ever more efficient, quieter, and sustainably produced equipment, machinery, and consumer goods. In the past, this has been seen as a burden on industry, where meeting increasingly stringent regulation would add cost, reduce efficiency, and ultimately reduce consumption of energy and resources by pricing them out of the market [53].
However, it appears that more recent trends in marketing and consumer demand are leading to positive drivers, the “carrot” where environmentally aware customers are increasingly demanding a more sustainable approach, not only to the design and production but also to the business model and the whole pattern of human consumption.
The challenge for the designer is to embrace the concept of truly sustainable design while ensuring that profitability is improved. Remember, we are seeking to improve the triple bottom line.
The second challenge is to avoid damage shift, where improvements in the developed world are offset by unfettered unsustainable growth in the developing world.
In our view, these challenges are to be met using one of the increasingly well-thought-out models measuring sustainability impact at an early stage in design to help guide decisions on make or buy, optimize material use, and focus on the greatest impact saving across the full life cycle.
Sources and references
[1] Declaration of the United Nations Conference on the Human Environment (UNEP), 1972.
[2] EPA United States 2012, www2.epa.gov/laws and regulations, accessed July 2013.
[3] Green building advisor. www.greenbuildingadvior.com. Taunton Press Inc.
[4] Staying Competitive in Today’s Homebuilding Industry, McGraw Hill & Deloitte & Touche, US Homebuilder Survey, 2006.
[5] Green Building Drivers, Green Building Insulation a 2009 white paper by Greenguard.org.
[6] Sustainable Manufacturing the Road Forward, ASME article by Marion Hart March 2012, www.asme.org.
[7] Symposium on Sustainability and Product Development IIT, Chicago, August 7 and 8, 2008, Beyond the 3R’s: 6R Concepts for Next Generation Manufacturing, Dr. I.S. Jawahir, University of Kentucky, 2008.
[8] Environment Canada, 18/07/2012. www.ec.gc.ca.
[9] Being Wise with Waste, Europe’s approach to waste management ISBN 978-92-79-14297-0.
[10] EU Commission Energy Web Site 2012.
[11] Source EU Commission Ecodesign, your future brochure, 2012.
[12] Directive on Waste 2008/98/EC summaries of European legislation. www.europa.eu/legilsation.
[13] DEFRA 2012 “Legislation and Regulation Frameworks.”
[14] The Waste (England and Wales) Regulations 208, UK Government legislation. www.legislation.gov.uk.
[15] Sustainability in Germany. www.europa.eu/yourbusiness/.
[16] Nachhaltigkeitsstrategie. www.bundesregierung.de.
[17] German Packaging Regulation (Verpackungsordnung) 2009 IHK Siegen.
[18] Nationale Nachhaltigkeitsstrategie Fortschrittberich 2012, Presse -und Informationsamt der Bundesregierung, Berlin 31 Oct 2012, translated by A.G. Gibson.
[19] Pinheironeto Advogados, Legislação Ambiental2007leg ambiental-ing2007.doc São Paulo, January 2007.
[20] Review of Russian Environmental Legislation ICF International 2012. http://www.icfinternational.ru/english/environmental-regulations.asp.
[21] State Report “On Condition and Protection of Environment of Russian Federation in 2003.”
[22] Communication from the Commission on EU-Russia environmental cooperation of December 17, 2001 [COM (2001) 772 final—not published in the Official Journal].
[23] Environmental Regulations And Legal Framework In India SJVN web publication 2007. http://sjvn.nic.in/projects/environmental-regulations.pdf.
[24] Comparative Study of the Environmental Laws of India and the UK with Special Reference to Their Enforcement, Govind Narayan Sinha, 2003.
[25] Environmental legislation in India, FinPro Public Document, January 2008.
[26] Krzyztov Mychalak, OECD report, 2006.
[27] EPA-China Environmental Law Initiative, United States Environmental Protection Agency. http://www.epa.gov/ogc/china/initiative_home.htm.
[28] ISRI Convention, China’s Green Fence Recycling Today, April 23, 2013.
[29] Information site from the Ministry of the Environment, Japan. http://www.env.go.jp/en/coop/pollution.html (accessed July 2013).
[30] Effectiveness of International Environmental Regimes, OR Young, MIT, 1999.
[31] Is Improving the Effectiveness of Environmental Impact Assessment in the UK Dependent on the Use of Follow-up? Views of Environmental Consultants Clare Harmer University of East Anglia, August 2005.
[32] Reporting on environmental measures—towards more ‘sound and effective’ EU environmental policies European Environment Agency report, 2001.
[33] Departmental Report, Department for Environment Food and Rural Affairs 2006. http://archive.defra.gov.uk/corporate/about/reports/documents/2006deptreport.pdf.
[34] Environmental Regulation: Effective or Defective? Assessing whether criminal sanctions provide adequate protection of the Environment, Emma Bethel, Plymouth Law Review, vol. 2, Autumn, 2009.
[35] Departmental Report, Department for Environment Food and Rural Affairs 2008. http://webarchive.nationalarchives.gov.uk/20130123162956, http://archive.defra.gov.uk/corporate/about/reports/annual.htm.
[36] Barbier Edward B. Introduction to the Environmental Kuznets Curve Special Issue. Environ. Dev. Econ. 1997;369:369–370.
[37] Xing Yuqing, Kolstad Charles D. Do lax environmental regulations attract foreign investment? Environ. Resour. Econ. 2002;21(1):1–22.
[38] Peter Nelson/International Institute for Environment and Development (IIED), London, Autumn, Profiles of Tools and Tactics for Environmental Mainstreaming No. 1 EIA, 2007. www.environmental-mainstreaming.org.
[39] Claire Harmer, Is improving the effectiveness of Environmental Impact Assessment in the UK Dependent on the use of follow-up? Views of Environmental Consultants, Thesis paper, School of Environmental Sciences, University of East Anglia, 2007.
[40] Dr. Tibor Faragó, hon. prof. of St. István University (Hungary), former state secretary for environmental and climate policies, Critical factors and processes counteracting to resource efficiency enhancement efforts, ESDN Conference, 28 June 2011.
[41] Prof. Dr. Schmidt-Bleek, Wuppertal Institute, MIPS, The Fossil Makers, 1993.
[42] What is carbon-footprinting, Carbon-Trust Web site: www.carbontrust.com/resources (accessed June 2013).
[43] Laurent, Olsen, and Hauschild, Technical University of Denmark, Paper 2012 Environmental Science and technology, Limitations of Carbon Footprint as Indicator of Environmental Sustainability.
[44] Soil Association Producer Support Sheet, Soil Association, South Marlborough St., Bristol.
[45] Mark Goedkoop, SimaPro web-site, operated by Pré Consultants bv Amersfort, NL, June 2013. http://www.pre-sustainability.com/ (accessed June 2013).
[46] J. O’Hare, E. Cope, S. Warde, 208, FIVE STEPS TO ECO DESIGN. Improving the Environmental Performance of Products through Design. Granta Design, Cambridge, UK.
[47] Justin Keeble, Young Consumers Hold the Key to Sustainable Brands, MD of Accenture writing in the Guardian, April 18, 2013.
[48] Dyson Airblade “why it’s better”, Dyson Web site. http://www.dysonairblade.co.uk/handdryers (accessed June 21, 2013).
[49] JCB main Web site: http://www.jcb.co.uk/About.aspx (accessed June and July 2013).
[50] Carbon Trust Website: Our clients JCB Case Study downloaded pdf file Simon Appleby JCB Environmental Advisor & carbon Trust 2009 published http://www.carbontrust.com/our-clients/j/jcb.
[51] JCB Product Information site about tier4 emissions control. http://www.jcbtier4.com/en-gb/about-tier-4 (accessed July 2013).
[52] Examples from Packaging reduction saves money: industry examples Envirowise brochure April 2004 Harwell International Business Centre, Oxford, UK.
[53] Effectiveness of Environmental Law: What Does the Evidence Tell Us? Michael G. Faure, University of Maastricht—Faculty of Law, Erasmus University Rotterdam (EUR), October 23, 2012.