Strategic Sustainable Design
Abstract
This chapter details and evaluates the triple bottom line, and then goes on to examine the benefits to buyers and producers of designed-in improved sustainability. This also reviews briefly the sustainability measurement industry and poses the question Quis custodiet ipsos custodies?
9.1 Triple Bottom Line—The 3P Approach
Early industrialists, the architects of the industrial revolution, were driven by the need for increased output to satisfy the demands of the growing markets within the Empire. Their focus was thus on improving the methods of production, designing machinery that could harness the emerging power sources to automate and speed up the manufacture of goods, and designing products that could more easily be made on this increasingly automated machinery. As a result, they were able to derive a greater return on investment in fixed and current assets—and became rich.
This was the first bottom line—profit.
Some of these industrialists such as Titus Salt and George Cadbury had or developed a social conscience, seeking to improve the “lot” of their workers, housing them in model villages, educating their children, and even investing money in improving safety in the manufacturing process.
More recently, leading companies have strived to distinguish themselves from their competitors as being more people friendly, either in terms of how they treat their employees, suppliers, and customers or in terms of how they interact with their external stakeholders.
This became the second bottom line—people or society.
As we have become aware of the depletion of the earth’s resources and the challenges set by increased use of fossil fuels and consequent production of potentially harmful by-products of combustion, Western society has identified the need for a third element to be accounted within the industries of extraction, production, manufacturing and distribution, namely the environmental impact.
This is the third bottom line—planet or environment.
So where early capitalists focused on return on investment, which continues to be essential to the long-term prosperity of any nation and its citizens, their successors sought increasingly to benefit not just themselves but their wider “stakeholders” through a socially responsible approach to their company. Modern successful entrepreneurs and industrialist are increasingly mindful of the impact their activity will have on their environment.
9.1.1 What It Is and What It Does
This was called by Elkington and others the triple bottom line [1].
At first sight, it would appear counterintuitive for a company to focus on their environmental impact, particularly where this could have an apparently detrimental effect on their bottom line or profit, which was the first and still most important of the “3Ps.”
However, changes in public attitudes certainly in the developed world have begun to manifest themselves in the form of legislation and market pressure. Thus governments, adopting a typical stick and carrot approach, have penalized high-energy users through high tax takes on fossil fuels, while allowing carbon credit trading to benefit the more efficient and effective production processes. Consumers increasingly review energy efficiency ratings for domestic appliances or fuel efficiency for vehicles and make purchasing decisions based on recycled material content or end-of-life destination for product packaging. It therefore behooves any good company to ensure that it is seen to follow or exceed these demands, not the least as a way of capturing a share of the most lucrative market segments.
The premise of triple bottom line approach to management of companies assumes that in order to manage an aspect of the business it must be measured. Thus, the financial health and profitability of an organization is measured using P&L accounts, balance sheet, and cash-flow forecasts. Similarly, an organization seeking to demonstrate its commitment to its key stakeholders, such as its employees, its community, customers, and suppliers will proudly display its attainment of ISO 9000 quality systems, Investors in People, Fair Trade, and other awards and demonstrations of good practice. It therefore seems logical to extend this idea to the third element of a successful company’s output, namely the accountability of a company in its interaction with and effect on the immediate and broader environment.
In Cannibals with Forks, Elkington argues that the move from “pure” capitalism, in which companies instinctively seek to consume or devour their competitors, is giving rise to a more civilized form of business where enlightened self-interest demands a more sustainable, cooperative approach [1]. In Enter the Triple Bottom Line [2] published over 10 years later, Elkington argues that the process of “silo busting” to allow integration of 3BL into the corporate structure is already taking place, although not universally and not without some internal problems and issues.
Savitz and Weber [3] also look at how really successful companies are increasingly those embracing best practice in all three elements of the triple bottom line. They contend that those companies that embrace and adapt to society’s emerging trends will tend to prosper: those that do not may have short-term success, but not survive in the long term. They also use a number of case studies to provide concrete examples of how corporations might turn the idea into profitable reality.
Not everyone agrees. Norman and MacDonald [4] challenge the notion, declaring that much of what is behind the concept is not novel, and that what is novel is unsound. Further, they argue that to attenuate the demands and claims of the concept in order to rescue the paradigm is pointless. They are supportive of the aspirations of 3BL, but unconvinced of its practical application and use.
Moses L. Pava in his article [5] challenges their argument, indicating that there is no simple single measure of a company’s financial performance: P&L “bottom line” on its own is not an adequate measure, and needs to be viewed in context with balance sheet, cash-flow, and a risk analysis of assets and liabilities. In the same way, one cannot expect a single simple catch-all measurement of sustainability bottom line. He is, however, wary of the misuse of the term 3BL by many to promote their own company’s interests.
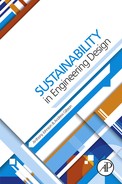
Nonetheless, empirical evidence suggests that the nay-sayers are wrong. A sustainable business it seems is more likely to remain successful tomorrow and on into future generations. It is interesting, for instance, that companies applying for the prestigious Queens Awards for Innovation and Export in the United Kingdom are expected to show a sustainable responsible and profitable growth curve over a period of 3-6 years. Sales growth or bright innovation is not enough; we are demanding that companies act responsibly both socially and environmentally. Thus increasingly, companies are expected to become part of the solution rather than part of the problem, and where the interests of all three elements of society, environment, and shareholders can be made to overlap, we have a win-win-win situation as shown in Figure 9.1.
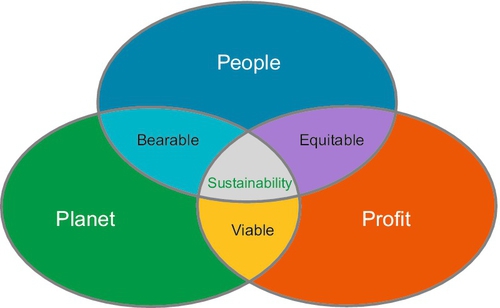
Figure 9.1Venn-Diagram, Mapping 3BL [6].
9.1.2 Measurement systems for 3BL
So the key issue is now that having defined the triple bottom line or 3BL, we need to measure it.
The three elements of the 3BL—people, planet, and profit—do not share either a common system or a unit of measure.
One approach would be to assign financial value to the environmental and social elements of the 3BL. This gives rise to issues such as how to assign agreed values to environmental or social impact. Embedded energy or carbon can be measured or estimated in manufactured objects or manufacturing processes, but how does one set a cash value to this? Equally, the cost of restorative work or contribution to social projects can also be measured, but is this a true measure of a company’s social responsibility? Ethics in dealing with customers and suppliers must surely also pay a big role.
Another approach might be to set up an index system, which compares the performance of any given company with that of an idealized organization on a series of indices. This system, while being simpler to devise and operate, is potentially heavily subjective, and would require a good deal of thought into the weighting of the key elements, or indeed subcategories with the 3Ps.
Certainly, a 3BL calculation could include such elements as:
• The classic elements of profit calculation referred to above (P&L, B/S cash-flow)
• Environmental sustainability—percentage of end-of-life to recycle as opposed to landfill
• Durability and repair—life cycle prolongation by repair or replacement of wearing or failing elements
• Packaging efficiency and recyclability
• Relative consumption of energy over the working life cycle, using product or industry norms or standards
• Stakeholder satisfaction rates
• Transparency levels in dealings with stakeholders
• Impact on employment levels and rates
• Application of equality of opportunity to internal and external stakeholders [7]
This would also be in accordance with the EU Accounts Modernization Directive [6], which introduces requirements for (large) companies to include a balanced and comprehensive analysis of the performance of the business in their Directors’ Report. This analysis must include “both financial and, where appropriate, non-financial key performance indicators relevant to the particular business, including information relating to environmental and employee matters.”
There have been a number of recent studies outlining potential measurement concepts. These include the “3-E” concept of Isaksson and Garvare, representing a modified version of 3BL, where ethics replaces social responsibility as a better and broader criterion. The project is in early stages of development, and intends to use indicators of organizational performance split into four “drivers”: input, enablers, output, and outcome. The concept is to develop similar approaches to those used already in quality audit systems such as ISO 9000 [8].
Foran et al. use output units of measure per dollar of GDP to review the performance of specific sectors of the Australian economy. Their argument is that this gives a measurement system that can be understood in terms of current accounting practices and can allow a comparison performance of any sector against the norm. By extension, a similar approach could be used to compare individual organization performance against (international) industry norm. Thus, financial aspects of performance can be expressed, for example, as dollars of export earnings per dollar of GDP. Social aspects such as employment can be portrayed as minutes of employment generated per dollar. Greenhouse issues can be portrayed as kilograms of carbon dioxide emitted per dollar.
The outcome can be displayed as a spider diagram, where the industry standard is represented as an average line. Thus, positions inside the line represent a better than average performance, and those outside the line represent worse than average (see Figure 9.2). This has been further developed as the basis of a software program by the ISA group at the University of Sydney, termed BottomLine3 (“BL-cubed”). Outputs are rankings and breakdowns of economic social and environmental indicators, together with sector benchmarking and supply chain analysis [9,10].
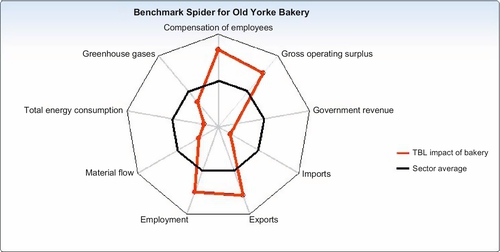
Figure 9.2Spider Diagram Mapping 3BL Using BL3 Software [9].
Yet another way of thinking about the triple bottom line framework is as three-dimensional triangular planes where each axis reflects economic, social, and environmental objectives. This was first outlined by Munasinghe [11] and developed by Roberts and Cohen (2002).
Plotting the three key values of the triple bottom line on the three axes of Figure 9.3. At time t1 in this example, indicated by the chain-dotted green line, the organization appears to place about equal value on profit and social objectives and a lower value on the environment.
Figure 9.3Three-Axis Representation of 3BL Influences. Modified from Munasinghe [11].
Sometime later, at t2, indicated by the solid black line, the profit and sustainability motives have increased in importance, while the social objectives lag behind. This could, for instance, be due to recessionary pressures, where restructuring and cost saving have had a negative impact on social objectives relating to the organizations stakeholders, but have helped maintain profitability and coincidentally a focus on waste and efficiency have improved the sustainability aspects.
At time t3, indicated by the dotted red line, it is clear that the financial performance has remained unchanged but, possibly now in a growth phase, the organization has focused more clearly on social and sustainability issues [11].
9.1.3 Are manufacturing companies embracing the triple bottom line?
Early exemplars of the 3BL approach include Unilever, General Electric, Proctor & Gamble, Pepsico, and Cascade Engineering. The last of these has issued 3BL (or TBL in their parlance) reports since 2003 (see below). In the United Kingdom, Southern Energy have embraced the concept, and according to Ric Parker, Director of Research and Technology at Rolls Royce, all products are assessed for environmental impact at the development stage a part of their commitment to 3BL [12]. EON also now produce a “Sustainability Report” rather than the previously titled CSR report. The new report covers all the three bottom line ingredients. The environmental aspects are measured under the GRI index, with detailed reporting on emissions, waste, and water management. The social issues cover gender, labor, and accident and incident statistics, and the financial reporting is covered only by a few KPI (key performance indicator) figures [13].
JCB do not refer to the triple bottom line as such, but recognize the potential impact they have on:
• The welfare of the communities in which we operate
• The health and safety of our employees
• The environmental footprint we generate
According to a survey in 2005 by KPMG, as reported in Professional Engineering, engineering companies were not the quickest to sign up to 3BL reporting. At the time, just 25% of companies were formally reporting performance against sustainability targets, ranking 9th out of 14 sectors, and well behind the utilities with 61%. James Stacey, KPMG Global Sustainability Advisor, did recognize the difficulties associated with 3BL reporting for complex organizations, but insisted that increasing professionalism in reporting standards was necessary to ensure that CSR was “fully integrated into the strategy and operations of complex organisations operating in a global economy” [14].
9.1.4 Case study example: Cascade Engineering Inc
Cascade Engineering manufactures a range of products for industrial use throughout the world. Their products include injections molded components and interior and exterior frame and body parts for the automotive industry, as well as materials handling, office furniture, and waste handling and recycling equipment. Since 2003, they have been reporting to their stakeholders and shareholders on their performance in all three elements of the triple bottom line. These reports cover key elements that make up the 3BL for cascade, including recycling and waste levels both in production and end-of-life or their products, improvements in production and product use efficiencies, corporate and local community investment projects, health and safety measures, and of course company profitability and shareholder returns [15].
In the foreword, CEO Fred Keller confirms that while some may think that a “focus on people and planet takes away from profits…if you do it right the opposite is true.” As “B” is a registered company, by committing to and gaining commitment from internal and external stakeholders, there is a common goal and a proven motivation to work harder and with greater innovation [15].
The scorecard at the end of the report measures:
• Sales year on year (in $M)
• Energy consumption (in sales$/kWh consumed) year on year
• Greenhouse gas emissions (in tons of CO2 equivalent)
• Use of recycled material (by weight)
• Landfill costs (as a percentage of sales)
• Employee training (average h/employee)
• Incident rate (per 200,000 h worked)
• Lost or restricted workday rate (per 200,000 h worked)
• Welfare to career retention rate
9.1.5 A critical review: is it an unacceptable, sensible, or imperative measure of a company’s success?
There have been a number of papers examining the triple bottom line. The general consensus is that the concept is sound, but that since an acceptable standardized method of calculation has yet to be found, the use of TBL as a comparator or absolute indication of an organization’s performance for public decision-making is not yet feasible.
Skouloudis studied the Global Initiative guidelines and concluded that they were more qualitative than quantitative, and that their study had revealed gaps in the reporting practices. The result was that an organization could improve its score by including issues for discussion in its reports rather than taking firm action [16].
A similar criticism is leveled in a report by Trucost for DEFRA into the FTSE 100 companies’ reporting in the United Kingdom. They concluded that there was a lack of quantification in most reporting, certainly not any “single, quantifiable measure that companies can use as a KPI (key performance indicator) for the effect of their upstream supply chain on the environment” [17].
Tullberg concurs, stating that the triple bottom line is potentially a missed priority model, and suggesting another “sketchy” set of measurement criteria [18]. Similarly, Hubbard’s paper of 2009 also proposes a scorecard system, noting that as sustainability concepts change this makes performance measurement even more difficult [19].
The key to triple bottom line is, it seems to us, that the lack of an agreed or standardized unit of measure should not detract from the validity of the overall concept. As with the development of other units of measure and systems of measurement, it will take time for one or two to be devised that gain universal currency.
So, we should not look upon 3BL as a rigid compartmentalized box, and use it as the “elastic tool” it can clearly be [20]. Most organizations could find an image of the concept and a system of measurement that will resonate with their circumstances and their stakeholders and use that in their internal assessment and their external communications with stakeholders.
Clearly, this raises a challenge of “Greenwash” creating the illusion of commitment to sustainability, but there are a large and increasing number of lobby groups and consultancies developing tools to control and measure sustainable activity that will expose the greater part of these illusions. Indeed, we will look at some of these in Chapter 10, as they are certainly a part of the future of our commitment to sustainability.
However, the key is that organizations and specifically in our view manufacturers of products must evaluate the performance of their products, their production methods, and their downstream materials distribution and upstream supply chains to optimize their sustainability performance, in terms of:
• embedded energy in their products
• efficiency of use of resources including optimized materials sourcing
• simplicity of design, including minimizing materials use, minimizing material removal-based manufacturing processes, and simplified assembly processes
• longevity and ease of life extension through prioritizing repair and reuse over recycling and waste
• minimizing or eliminating the impact on the local environment in terms of water use and pollution and air and ground pollution levels, without simply displacing these problems to earlier or later stages of the total supply and use chain
• optimizing packaging to ensure that it meets the needs of product protection and marketing without generating excessive waste
These issues can all be measured as indices using (possibly refined versions of) current modeling techniques and reported in the annual statement as part of the TBL reporting.
9.2 Benefits to Producers and Buyers of Designed-in Sustainability
The benefit to the environment of designing in sustainability is quite clear. If we improve fundamentally our approach to sustainability within the field of engineered and manufactured product, we reduce our impact on the environment while simultaneously continuing to offer a maintenance of or even improvement in the standard of life or living of the inhabitants of the planet.
But what is in it for the buyers and consumers of these better-engineered and more consciously sustainable products? Will they be inferior in some way? Will they mark a step backward toward some imagined bucolic utopian past? Will they simply be another means of marketing ever-increasing consumption to those who already overconsume?
And what of the designers, manufacturers, and producers of these products, machines, and equipment? Will they trade in their hair shirts for the silk or satin garments of smugness and superiority? Will they use the illusion of a fundamental shift in the design paradigm to continue on down the path of unsustainable growth?
9.2.1 Benefit to buyers
The buyers and consumers of manufactured goods and product will potentially benefit both directly and indirectly from designed-in sustainability.
The direct benefits are described in the following subsections.
9.2.1.1 A lower running cost, due to improved energy efficiency, or the in-built use of sustainable energy sources
Exemplars of improved efficiency designs include domestic appliances such as dishwashers and washing machines, which are now designed to use less water and consume less power by washing at lower temperatures, and by improving insulation systems, etc. The benefits of these designed-in features are clearly demonstrated using the EU rating system for appliances, and using consumer buyers guides, such as Which and Energy Star. Indeed Which, for instance, offers not only a guide to energy efficient machines but also a guide on how to optimize their use for environmental impact and cost reduction. They calculated annual energy costs of 198 washing machines and found they vary between £9 and £47 per year for four loads a week at 40 °C [21].
The Bosh Machine below occupied 15th place in terms of a combination of cost/year, cost/kg, cost/cycle, and CO2 emissions according to ratings by the UK web site Sust-It. Apart from having a good rating in terms of water and energy use, it allows the user to decide whether to operate the machine for fast results on a quick cycle, or to optimize energy use on an Eco-cycle (Figure 9.4) [23].
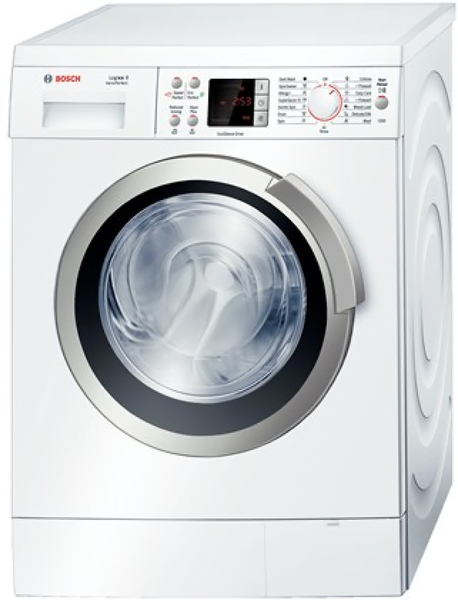
Figure 9.4The Bosch Logixx WAS24461GB Washing Machine [22].
Built-in renewable energy sources for sustainability are increasingly being seen in areas such as street lighting, street signs, and GSM masts. For street lighting, for instance, the concept is that PV-generated energy is stored during the day and released at night to give a self-sustaining product that can be installed without the need for grid access. The lighting unit uses LED lighting to reduce power consumption. This solution is proving popular in Sub-Saharan Africa and the Middle East, but it has been used in the United Kingdom (Hackney borough among others) (Figure 9.5).
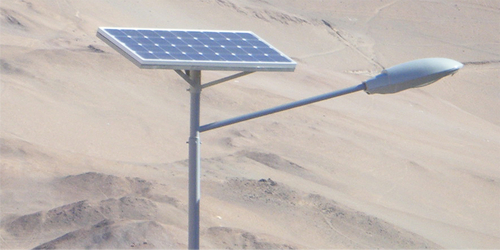
Figure 9.5Street Lighting with Built-In PV Solar Power Unit—Carey Glass Solar [24].
Typical features and benefits for PV solar/LED street lighting include:
• Over 10-year LED lamp life
• Immediate lighting without preheating
• Cool white light without flickering
• LED lamps retain luminosity for their full life span
• In case of a single LED breakdown all other LED modules continue to work
• LED lamps are nontoxic
• Safe 24 V dc circuit with reduced risk of electric shock
• Simple installation and low to no maintenance [22]
9.2.1.2 Lower overall cost due to improved longevity or reparability
The net cost-benefit argument will not always win customers, as some are working to limited budget and cannot afford to pay more now for savings over the longer term. However, as new and more efficient technologies become more widely adopted, the premium price charged by the early producers of these technologies is eroded, and they become available to a wider market.
From a long experience in developing and marketing internationally engineered products from advanced lubricants to mechanical handling components and equipment, the author can confirm that offering features that relate to an identified need clearly gives the client a benefit. The skill is in identifying the future needs of the client base, developing products that fulfill those needs, and finally making the client aware of the solutions offered.
Thus, for the example of the Dualit toasters mentioned in Chapters 3 and 10, it is clear that the initial cost is typically 30% above that of other comparable products. However, the extended life generated by the option to replace failed elements or the timer, etc., allows the unit to outlast its competitors by a factor of 3 or more. Thus, over its total life, and including the cost of replacement parts, such a toaster might offer a 50% saving.
In a similar vein, the rock drill design also found favor with clients in Sub-Saharan Africa, where simple robust design offering ease of maintenance and longevity is placed above sophistication and complexity of design offering what are often regarded as unnecessary labor-saving features. The rigs currently in use, whether sourced cheaply from China or at greater cost from Europe or USA, would succumb sooner or later (respectively) to the ravages of the hostile environment in which they were operating. Replacing work shafts was an expensive and difficult operation, involving high costs stocks or long procurement delays. Replacing a sacrificial sleeve, kept as an inexpensive stock item in the central depot is quicker, easier, and cheaper, and allows the working life of the drill to be extended by a factor of two to three times.
9.2.1.3 Intangible benefits
These direct benefits have hitherto largely translated ultimately to time, trouble, and money. There are other benefits to the user, which are more intangible. These include:
• Status—owning a “greener” motor vehicle or domestic appliance could enhance a consumer’s statue among their peer (conspicuous consumption); similarly, a company operating with a low environmental impact may improve their status within their clientele.
• Satisfaction—the owner of a more sustainable product may derive direct satisfaction and pleasure simply form the knowledge that they are reducing their impact on the environment. This is often the motivation for the “early adopters” to make purchase decisions in favor of, for example, hybrid or electric cars, long before these are easy to use or indeed tried and tested in the market.
• Aversion—the possibility of legislation or taxation measures being imposed in the future may also influence the purchasing decisions of both domestic and industrial buyers. As an example, since vehicle road tax in the United Kingdom is now based on CO2 emissions, many consumers have been influenced in their buying decisions by the emissions performance of a car, rather than just fuel consumption, style, or engine or road performance.
• Altruism or enlightened self-interest—those who place a great importance on sustainable living will seek out products and services that reflect that importance (Figure 9.6).
Figure 9.6Modern Environmental Message from “Green Is Sexy” Web Site [25].
It is our view that these intangible benefits will play an important role in driving forward the sustainability agenda, but ultimately, many buyers and consumers will look first to cost and other direct benefits.
9.2.2 Benefit to producers
The prevailing view is that there are increasing financial incentives and benefits to the producers of demonstrably sustainable products and services. The evidence of this is limited, according to Blackman and Rivera [26]. Where the manufacturer is able to gain market share or to charge a premium price for a demonstrably sustainable product, the profit benefit is clear. However, this needs to be weighed up against any potential additional cost from sustainable materials sourcing, for instance.
It can be argued that sustainable sourcing and intelligent design, resulting in reduced materials usage, reduced metal-removal in manufacture, and optimized embedded energy will all contribute to the traditional bottom line in terms of materials costs and materials flow management benefits. Similarly, optimizing packaging will also lead to reduced cost in the downstream logistics chain, giving a competitive advantage in the market.
The market does not always respond positively toward sustainability as an argument: Perkins Diesel, for instance, found that the Chinese market was reluctant to pay a premium price for an engine with fuel-efficient performance, designed-in longevity, and ease of repair, but the markets of Europe and USA responded very well to the same product marketed with precisely that message. Evidently, those markets where there is sufficient available income for buyers and consumers to make choices based on the medium-term returns and long-term effects of a product will offer a more attractive market in the short term to the sustainable producer or manufacturer.
Nonetheless, for an SME manufacturer, the extra burden imposed by the increasing requirements to certify their sustainable credentials either for the product or the company as a whole may be seen by some to appear on the liability side of the balance sheet.
Clearly, there are also intangible benefits for manufacturers, distributors, and retailers of sustainable products in terms of their increasingly important obligations under corporate responsibility toward sustainable growth, and these can be clearly seen by the way many larger organizations are rushing to ensure their environmental credentials at a corporate level are seen by their customers.
Any benefit to the manufacturers of sustainably engineered products must be demonstrable, if those companies are to embrace the concept of designed-in sustainability.
At the product or component level, this means that we need to develop further the current tools and models that allow the designer to make decisions on materials sourcing, selection, and manufacturing method to include a cost-benefit calculation.
At the company or corporate level, it means using one or more of the many certification schemes to verify the company’s commitment. Of course, some of these schemes also apply at the product level: indeed, the EU is currently consulting on standardizing measurement systems and measures in both categories.
Two methods have been put forward by the Commission to measure environmental performance throughout the product lifecycle. They are called Product Environmental Footprint (PEF) and the Organisation Environmental Footprint (OEF). The use of these methods would be voluntary for Member States, companies, private organizations, and the financial community [27].
9.3 The Sustainability Measurement and Certification Industry
As outlined earlier, in order to benefit commercially from a shift to engineered sustainability, manufacturers of machines, equipment, and components must be able to show the market that their products are offering the key feature of designed-in sustainability, and demonstrate the benefits this will bring to the client, user, or buyer.
Currently, companies wanting to highlight the environmental performance of their products face must choose between a multiplicity of methods, standards, and labels each promoted by governments, private consultancies, and lobby groups, leading to extra costs for multiple verification schemes and customer confusion as to the validity of any given scheme.
Much of the research carried out so far has been focused on food-based sustainability labels, such as Fair Trade, Rainforest Alliance, and Organic status. In Germany, pioneer country in the EU on such issues, the earliest labels such as Der Grüne Punkt were based on the recyclability of first and second tier packaging. In this book, we are more interested in those labels that can be applied to a broad spectrum of products, and which try to encapsulate the whole life cycle. This is not to say that there is no value in specific industry-based labeling, but rather that these labels impinge less on the world of the design engineer, especially where they refer to food and other natural products (Figure 9.7).
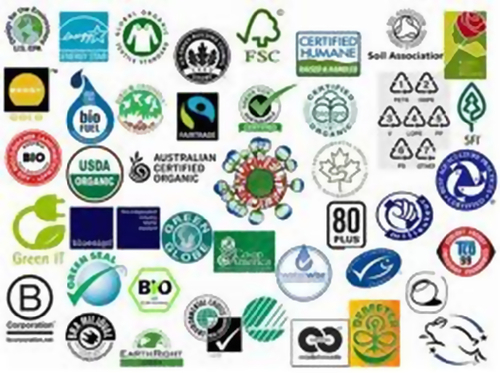
Figure 9.7A Selection of Sustainability Labels [28].
The US-based research carried out by the Hartman group [29] has indicated that many consumers do not currently place a high value on sustainability in the selection of supplier or manufacturer of household goods. Indeed many of the people surveyed, including those nominally interested in the subject had no clear concept of sustainability. Typically, it seems, those who have, to look for “green” labels to reassure them of a product’s credentials. It is also apparent that there is a decline in the recognition of strict definitions of sustainability (Figure 9.8).
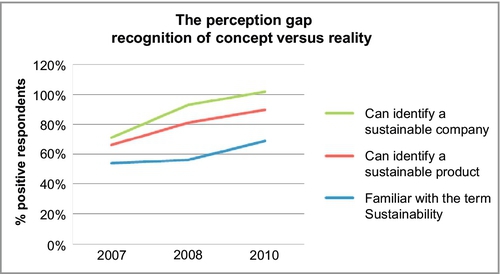
Figure 9.8THE GAP! Consumers Do Not Yet Make the Connection Between Sustainability and Sustainable Companies and Products [29].
In their 2009 paper, Delmas et al. held that the increasing number of eco-labels could lead to information overload, consumer confusion, and skepticism. They give the example of the fact that there were currently more than six coffee eco-labels and that consumers apparently have difficulties recognizing the differences between them [30].
Their conclusion is that any successful and effective label must fulfill a number of criteria under the headings of increasing awareness and confidence in the consumer, and stimulation of a willingness to pay (Figure 9.9).
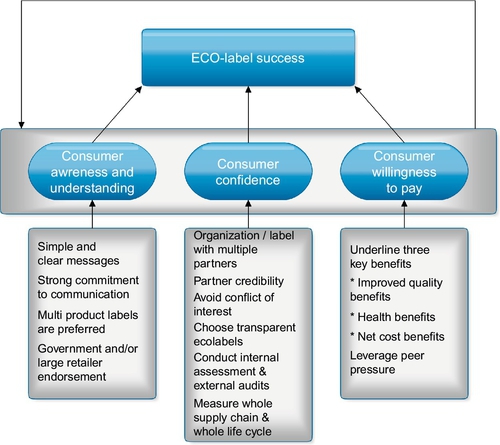
Figure 9.9The criteria Affecting Success of a Sustainability Label. Modified from Ref. [30].
For the manufactures too, there is risk associated with the choice of verification or audit entity and concomitant label, as a poor label may not carry recognition with the consumers, and indeed may mislead or confuse the customer, becoming a nonbeneficial cost.
The key then for producers is to align themselves with one or more of the recognized labels confirming the status of the company or its products as sustainable. There are currently a large number of such rating and grading systems across the developed world; so, it is important to have some understanding of the main ones and discuss some of the reviews of those systems. This will enable the designer to decide which systems, standards, and labels offer a real, concrete unit of measure, and which could be classified as potential “Greenwash.”
These could be standards imposed by government, such as the EU requirement for energy rating under their D to AAA rating system or the US Governments Energy Star label. Or it could be a rating or seal of approval from one of the many so-called independent institutes. The consultancy and lobbying group Terrachoice produced reviews in 2009 and 2010 of the wealth of “green standards and labels” adopted by US companies, and concluded in principle that many of these labels were “Greenwash,” but that “legitimate green standards help fight Greenwashing” [31].
9.3.1 ISO 14000 series
Building on the experience of the ISO 9000 systems, which fulfilled the need for quantifiable systems and audit procedures in quality management, the ISO 14000 series of standards were derived from the need for environmental protection. As with ISO 9000 series, the standards measure the creation and maintenance of audit systems and the systematic adoption of an organization of a consistent approach to sustainability and environmental protection,
They are not a guarantee of sustainability in the products designed or made by an organization. Indeed, when the author was leading the drive for ISO 9001 certification by one German company, a simple grammatical error in the forward indicated that it was the intention of the company to produce poor quality goods. The TüV Rheinland assessors queried the error, but remarked that had it been our genuine intention to produce rubbish, as long as we achieved this goal systematically and within the remit of the audited ISO system, then the system itself would still be awarded ISO 9001 certification!
Nonetheless, it does form a good basis for other organization-wide certification systems, as it prescribes best practice for minimizing pollution risk, and establishes that a company must start the process by creating an environmental policy to identify all potential risks and effects of their production activity [32].
It also covers the issue of waste management, seeking to minimize waste and maximize reuse and recycling. It has been estimated that an average manufacturing company produces waste to the value of approximately 4.5% of turnover. Reducing this waste by 25% would thus save over 1% on turnover, making a direct contribution to the improvement of the bottom line.
9.3.2 Carbon neutral
This is an example of the CO2-based certification schemes. It was developed by the Carbon Neutral Company in 1998 to measure the carbon impact of organizations, with a view to improving their performance. Clients’ greenhouse gas emissions are assessed using external assessors, and strategies are developed to reduce or offset these emissions.
The carbon neutral certification is then awarded on the basis of credible action to reduce emissions to zero [33].
Some of the key product or service-based systems and labels are outlined and reviewed below.
9.3.3 The Energy Star label
The Energy Star Programme is a voluntary partnership of the U.S. Department of Energy (DOE) and the U.S. Environmental Protection Agency (EPA). An agreement, signed in 2000, partners the European Union in the labeling scheme, placing the European Commission in charge of the program. The label is well-established in both the USA and Europe, with thousands of products for home and office use across more than 40 product categories. The logo typically appears on office equipment such as monitors, printers, etc. [34].
Recognition levels have grown in the USA from 30% of consumes in 1999 to over 60% in 2005. Although recognition is one issue, action is another. There are apparently a number of factors militating against an increased uptake in the purchase of products carrying this label:
(a) According to Ward et al. in 2011, the offer of a direct monetary saving over the life of an appliance is a strong positive motivator. However, as energy costs decrease relatively, this net cost-benefit is eroded and take up is smaller [35]
(b) The target audience is also critical: those in the lower income brackets will be less concerned with ecology in their purchasing decisions, and often not in a position to pay a premium investment price for a net cost-benefit [36]
(c) Public pressure to improve the environment: the energy star label explicitly promises benefits both to the consumer and the planet. “Money Isn't All You're Saving” or “Save Energy, Save Money, Protect the Environment” [35]
9.3.4 The Blue Angel (Blauer Engel)
The Blue Angel (Blauer Engel) is a German certification for products and services that have environmentally friendly aspects. The first and one of the most well-known eco-labels worldwide, Blue Angel promotes the concerns of both environmental protection and consumer protection [37]. The fact that it is owned by the Federal Ministry of the Environment means that consumer confidence levels are high.
The label specifies that the product or service focuses on one of four different protection goals:
• Health
• Climate
• Water
• Resources
According to their own web site, they have achieved 76% brand awareness in their home market of Germany, and 39% of buyers are influenced by the label when shopping. They have over 1750 licensees with over 11,000 approved products across the spectrum of consumable goods from abrasives through floor coverings to domestic equipment [37].
9.3.5 The EU Ecolabel
This is an EU-wide standard, which is administered by officially designated “competent bodies” in each EU country. As with the other labels considered above, the EU Ecolabel covers a broad range of products from household appliances, TV and home entertainment, furnishings, etc., through clothing, DIY, and gardening equipment and supplies to cleaning chemicals lubricants.
Products that carry the Ecolabel have been independently assessed to be less damaging to the environment than some equivalent brands over their whole life cycle. They must meet a set of published environmental criteria agreed upon by EU member states after consultation with relevant interested parties.
The assessment covers the full life cycle of the product under consideration, broken up into four sections:
• Extraction: The environmental toll caused during mining, crop cultivation, petroleum extraction, forest management, and other activities
• Manufacturing, packaging, and distribution: Pollution emitted and resources used to construct or produce the products and get them to market
• Use by consumer: Consumption of energy and water resources during the working life of the product
• End-of-life: The ease of recovery and recycling [38]
Since the EU Ecolabel was established, the number of companies receiving the label has increased each year. At the beginning of 2010, more than 1000 EU Ecolabel licenses were awarded in nine established product groups. The United Kingdom currently has 31 Ecolabel holders. However, Delmas et al. remain unconvinced by the label, stating that while the Flower label indicated a “general message of sustainability,” it does not communicate well the criteria by which the products are judged, and thus has a lower impact and recognition score than one might expect [29].
9.3.6 The Carbon Reduction Label
The Carbon Label Company was set up by the Carbon Trust in 2007 to help meet the needs of both businesses and their customers. In 2009, the Company became the Carbon Trust Footprinting Company to reflect the breadth of services it provided.
A product bearing this label indicates that the carbon footprint of the product (or service) has been measured and certified, and that the producer or manufacturer of the product or service is committed to a further reduction of that carbon footprint over a 2-year period. The calculations made across the whole life cycle, and are based on the relevant British Standards PAS 2050, using the organization’s own dataset. This gives a consistent basis of calculation and allows easy comparison between similar products and services.
The system is not without critics; however, as the United Kingdom’s leading supermarket chain, Tesco, have dropped the process after committing considerable resource to the process, citing prohibitively high costs and poor consumer recognition as the reason for doing so [39].
9.3.7 The Energy Saving Trust Recommended
Energy Saving Trust Recommended is a best-in-class product certification and labeling scheme that covers 32 product categories on the UK market. Manufacturers, suppliers, and retailers can join the scheme to help their customers identify the most energy efficient products in their ranges. The Energy Saving Trust, which manages the certification, is an independent, nonprofit organization backed by the Government.
Product categories range across seven sectors:
• Appliances
• Consumer electronics
• IT
• Lighting
• Heating
• Insulation
• Glazing
Under the Energy Saving Trust Recommended scheme, only products that meet strict criteria on energy efficiency can carry the label. For example, only fridges which are A + can be certified, and the washing machines on the scheme must be AAA—that is A for energy, A for wash quality, and A for spin. The criteria are set by an independent panel and reviewed annually to ensure that they always reflect development and changes in the market and technology. Not all the products certified by the trust will already carry an EU label: glazing, boilers, and TV, for instance, are not certified under the EU scheme [40].
All certification criteria go through a planning, consultation, and peer-reviewing process before they are implemented. This means that to be Energy Saving Trust Recommended products must be top in their class at energy efficiency.
9.3.8 The reviewers—Quis custodiet ipsos custodies?
There have been a number of learned articles and studies into the nascent industry that eco-labels and standards are becoming fast. Some of those reviews and studies have been referred to in the short descriptions above. The majority of these studies have concentrated either on the technicalities and effectiveness of one or more labels or standards or on the apparent effect that these labels are having on buyer behavior and hence the strategy adopted by manufacturers and retailers in tapping that changing behavior profitable. Some, like Murray and Mills [36], mention in passing the net effect that this might have on reducing carbon emissions.
To date, we have found relatively little in the way of studies that look at these standards and labels from the perspective of the 3BL benefits that they ultimately need to generate in order to promote sustainability improvements though technological change—which itself, as we argue, is brought about via the hands and minds of the designer.
There is, naturally, a wealth of web-based criticism and review of the labels and standards so eagerly embraced by some manufacturers and retailers. Indeed, the term “Greenwash” was coined to describe the use of such labels to mislead and confuse. Typically, advertisements often claim that a product is made from “only natural ingredients.” And this means what, precisely? In these circumstances, we can apply the famous “Ja und?” or so what test. An unsubstantiated claim such as the one above means little or nothing, and is merely part of advertising copy.
Much of the criticism and discussion of the subject is anecdotal and online, often in the form of blogs and public rating systems, such as the Greenwashing Index [41]. On this site, members of the public are encouraged to look out for and rate claims by companies and organizations as to their sustainability credentials or those of their products. On the web site of the Stop Greenwash web site of Greenpeace, they claim that “green is the new black,” and point out that while some businesses are “genuinely committed to making the world a better place,” some are cynically using a convenient slogan to hide the inconvenient truth [40]. While these sites are serious-minded organizations offering an interesting means of raising awareness, and possibly keeping check on the gap between PR and reality, they are hardly scientific or objective.
Since 2007, the TerraChoice organization has produced a series of reviews of “the sins of Greenwashing.” In their latest review in 2010, they noted a general improvement in the way companies were approaching the sustainability agenda: it seems that those more practiced at reviewing their own products, or by extension using external bodies to review their products, became better at avoiding the pitfalls of making exaggerated or misleading claims [31]. Nonetheless, an overwhelming 95% commit one or more of their “sins” of Greenwashing. These are:
1. Hidden trade-off—using a narrow set of criteria to claim sustainability and ignoring other aspects of sourcing, production of consumption. An example given for this is paper, which may well be made from sustainably sourced wood, but using an inefficient high-energy process.
2. No proof—where claims cannot be easily substantiated by supporting data or third-party audit.
3. Vagueness—where generic claims are made. The all-natural example is referred to, pointing out that lead, mercury, and uranium are natural, but their use is possibly not sustainable.
4. Irrelevance—where the claim is true but unimportant. The example given is CFC-free. Since the 1970s, CFC use has been illegal, so we would hope that the claim were true!—but irrelevant nonetheless.
5. Lesser of two evils—where the product is a less-polluting product than others in the same class, but the class itself performs poorly.
6. Fibbing—claims that are based on misleading information or telling downright lies.
7. Worshipping false labels—claiming third-party endorsements that are untrue.
In our view, while this system has some merit, any review needs to be based on firm evidence, including embedded energy of the product, a review of the full supply chain and the life-cycle, and other tangible, clearly defined criteria. This view was shared by Joel Makower in 2010 [42]. In his view, TerraChoice were guilty of at least three of their own sins, in that proof was rarely advanced or made available, and high-level unsubstantiated findings are given. A more important issue is one of vagueness: is it “Greenwash” to cry “Greenwash” where a company has made a valid marketing claim but failed to back it up,” when the term was originally defined as the deliberate dissemination of misleading or false information to make the organization appear more environmentally friendly than it is in reality. And while Makower admits to subjectivity, his basic point is that, like many other green watchers, TerraChoice reports are also largely subjective, and the company itself is seeking to market their consultancy services to potential clients seeking to avoid being branded as Greenwashers.
This was also the conclusion of M.A. Delmas and V.C. Bulbano, for example, writing in 2011, who concluded that a comprehensive analysis of the drivers that lead companies to engage in the practice of Greenwashing was lacking. Hitherto, most reviews had been empirical, and focused on identification of the culprits, rather than promotion of best practice. Their paper aimed to address that gap [43].
In their analysis, a company that engages simultaneously in poor sustainability performance and positive media communication about their performance is Greenwashing. This may also be a little simplistic. For example, where the case against LG Electronics allegedly committing the sin of Greenwashing by mislabeling some of their domestic appliances as meeting Energy Star ratings may be clear-cut, a similar company some of whose products reach the required standards where others should not be so labeled in our view. It may well be that the more sustainably engineered products are available at a premium while the less so are marketed by the same company under a budget label to access that part of the market who cannot afford the more sophisticated product. In such a case, we would seek to encourage improvement in the sustainability of the budget range by better design rather than castigate the manufacturer.
The “Divers of Greenwashing” paper posits the concept of “green” and “brown” firms, where environmental performance is the differentiator, and focuses on the motivations that lead poor performers to claim better than actual levels of performance. They identify a number of internal and external drivers, which relate well to our earlier discussions about the benefits of adopting a sustainable approach to the consumer, the manufacturer, and society as a whole. These drivers are well represented by their figure on page 5, reproduced here as Figure 9.10.
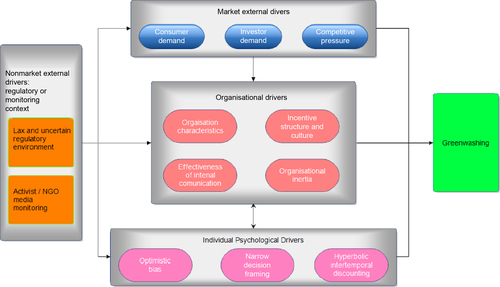
Figure 9.10The Drivers of Greenwashing. Modified from Delmas and Bulbano [43].
This chapter avoids a careful definition of good and poor performance. This was a deliberate choice, justified on the basis that it was easier to change the market communications strategy for a “brown” organization than to change their sustainability strategy. To that end, they produce a template for improved communications and advocate a top-down commitment to transparency and accuracy. Our contention is that while this may represent a positive step forward, sustainable progress is made only when the whole company engages with a positive approach to sustainability, seeking to design it in to their products and services to give a long-term, sustainable future.
As regards, labels and quality management systems such as the Soil Association’s Organic status, or Globalgap and Fair Trade, the author’s own anecdotal experience can serve to indicate potential weaknesses in the system. When leading the renovation of a mango pack-house in Guinea, the small-scale producers lacked the financial means to invest in soil improvement products, herbicides, and insecticides. The product was therefore nominally organic. However, poverty, the very reason why these products were “organic,” prevented them from buying in the skilled and seasoned consultants and auditors required to demonstrate the organic nature of the products.
It is clear that just as with quality management systems such as ISO 9000, people management systems such as Investors In People, the “green” or sustainability industry, including the ISO standard 14000 series has created a “monster” in that some of these systems and labels become an end in themselves, giving rise to a lucrative consultancy industry, rather than a means to an end.
That end should be to allow the designers and manufacturers of product to assess objectively their products against meaningful standards, and to allow the buyer, user, or consumer to evaluate the relative merits of individual products within a given class in terms of their impact on global ecology or lifetime sustainability.
In the words attributed to Juval, the Roman poet, quis custodiet ipsos custodies?
References and information sources
[1] Elkington J. Cannibals with Forks: The Triple Bottom Line of 21st Century Business. The Conscientious Commerce Series. Gabriola Island, BC, Canada: New Society Publishers; September 1, 1998.0865713928.
[2] J. Elkington, Enter the Triple Bottom Line. On-line publishing by KMH Associates ES_TBL_7/1, August 17, 2004.
[3] Savitz A, Weber K. The Triple Bottom Line: How Today's Best-Run Companies Are Achieving Economic, Social and Environmental Success—and How You Can Too, E-Book. 2006.0470534664.
[4] Norman W, MacDonald C. Getting to the bottom of “triple bottom line”. Bus. Ethics Q. 1052-150X2003;14(2):243–262 2004.
[5] M.L. Pava, A Response to “Getting to the Bottom of ‘Triple Bottom Line”, Paper to Harvard I-Site, 2007.
[6] Segelocum Ltd training materials, Retford, UK, 2012.
[7] Directive 2006/46/EC of the European Parliament and of the Council of 14 June 2006. http://eur-lex.europa.eu/LexUriServ/LexUriServ.do?uri=OJ:L:2006:224:0001:01:EN:HTML Available from eur.lex.europa.
[8] Isaksson R, Garvare R. Measuring sustainable development using process models. Manage. Audit. J. 2003;18(8):649–656.
[9] Wiedmann T, Lenzen M. Triple-bottom-line accounting of social, economic and environmental indicators—a new life-cycle software tool for UK businesses. In: Paper Presented to Third Annual International Sustainable Development Conference Sustainability—Creating the Culture, 15–16 November, Perth, Scotland; 2006.
[10] Foran B, Lenzen M, Dey C, Bilek M. Integrating sutainable chain management with triple bottom line reporting. Ecol. Econ. 0921-80092005;52(2):143–157.
[11] Munasinghe M. Environmental Economics and Sustainable Development. In: World Bank Environment Paper; Washington: World Bank; 1993:0821323520.
[12] R. Parker, Technology Investment and Shareholder Value Lecture at the Imperial Business Insights Series, February 9, 2013, see http://www3.imperial.ac.uk/business-school/programmes/innovation-and-entrepreneurship/.
[13] A. Bickmeyer, M. Hansch, EON 209 sustainability report, May 2013.
[14] Stacey J. KPMG global sustainability advisor engineers are way down the ‘responsible list’. J Professional Engineer Journal. 2005;18(9):8.
[15] Cascade Engineering Triple Bottom Line Report 2012, Cascade Engineering, Grand Rapids Michigan.
[16] A. Skouloudis, K. Evangelinos, F. Kourmousis, Development of an evaluation methodology for triple bottom line reports using international standards on reporting, April 5, 2009, Environmental Management, Springer Science + Business Media.
[17] Incentives for greening UK business, Bus. Environ. ISO 14000 Updates 16(9) (2005) 7–8.
[18] Tullberg J. Triple bottom line—a vaulting ambition? Bus. Ethics. 2012;21(3):310–324 Article first published online: June 18, 2012.
[19] Hubbard G. Measuring organizational performance: beyond the triple bottom line. Bus. Strat. Environ. 09644733(18):2009;177–191.
[20] B. Vivian, Blog, 2009. http://www.vivianpartnership.co.uk/is-triple-bottom-line-a-misguided-principle.
[21] Which report on washing machines: washing energy costs, 2009. http://www.which.co.uk/home-and-garden/laundry-and-cleaning/guides/washing-machine-energy-costs/published.
[22] Bosh Web-site. http://www.bosch-home.co.uk/our-products/washers-and-dryers/washing-machines/ (accessed August 2013).
[23] Sust-It. http://www.sust-it.net/energy-saving.php, published on-line by Sust-It Trurnaround Lts, of Cheltenham UK (accessed August 2013).
[24] Carey E. Carey Glass Solar Power-Point Presentation 2011. Dublin, Ireland: Carey Glass Solar; 2011.
[25] Green is Sexy Website, blogs published online by Canadian actress Rachel Macadams, 2007.
[26] Blackman A, Rivera J. Producer-level benefits of sustainability certification. Conserv. Biol. 2011;25(6):1176–1185.
[27] Initiative for Green Products, announcement published on-line by Enterprise Europe Yorkshire, 2013. http://www.ee-yorkshire.com/yf/news/newsid=773 (accessed June 2013).
[28] A selection of “Green” labels—open sourced via Google Images, June 2013.
[29] L. Demeritt, Understanding the sustainable consumer: lessons learned and upcoming research, Presented by The Hartman Group on-line sustainability webinar notes, 2013. www.hartman-group.com/pdf/sustainability-webinar-2013.pdf (accessed August 2013).
[30] M. Delmas, N. Nairn-Birch, M. Balzarova, Lost in a Sea of Green: navigating the eco-label labyrinth, Abstract 209 paper, published UCLA, January 11, 2009.
[31] The sins of Greenwashing, Home and Family Addition, A report on environmental claims made in the North American consumer market, Terrachoice, www.terrachoice.ca, www.sinsofgreenwashing.org/ (accessed July 2013).
[32] Morris AS. ISO 14000 Environmental Management Standards: Engineering and Financial Aspects. Chichester, UK: Wiley & Sons; 2003.978-0-470-85128-9 Oct.
[33] Carbon Neutral Certification, the Website of The Carbon Neutral Company, London and New York. http://www.carbonneutral.com/our-services/carbon-neutral/ (accessed August 2013).
[34] Bateman L. The Green Label Guide. London: The Sixty Mile Publishing Company; 2013. http:www.greenwisebusiness.co.uk/.
[35] Ward DO, Clark CD, Jensen KL, Yen ST, Russell CS. Factors influencing willingness to pay for the energy star label. Energy Policy. 2011;39(3):1450–1458.
[36] Murray AG, Mills BF. Read the Label! Energy Star appliance awareness and uptake amongst US consumers. In: Paper Presented to Annual Meeting, Agricultural and Applied Economics Association July 24–26, Pittsburgh, Pennsylvania; 2011.
[37] Der Blaue Engel Umwelzeichen mit Markenwirkung web-site of RAL GmbH, D53757 Sankt Augustin, http://www.blauer-engel.de/ (accessed August 2013).
[38] EU Ecolabel, The European Commission, published by Office for Official Publications of the European Communities, 2006. www.eco-label.com (accessed August 2013).
[39] Quinn I. Frustrated Tesco ditches eco-labels. The Grocer. 2009. http://www.thegrocer.co.uk/companies/supermarkets/tesco/frustrated-tesco-ditches-ecolabels/225502.article (accessed July 2009).
[40] About Energy Savings Trust, website. http://www.energysavingtrust.org.uk/Take-action/accessed (accessed August 2013).
[41] Greenwashing Index: help keep advertising honest promoted by Enviromedia Social marketing, supported by University of Oregon School of Journalism and Communication. www.greenwashingindex.com/ (accessed August 2013).
[42] J. Makower, Is TerraChoice Greenwashing? Greenbiz Website Blog November 1, 2010. www.greenbiz.com/blog/2010/11/01/terrachoice-greenwashing (accessed July 2010).
[43] Delmas MA, Burbano VC. The drivers of Greenwashing. Calif. Manage. Rev. 2011;54(1):64–87.