
It is also possible that N2O3 is produced. The kinetic reaction and equilibrium constant are given as:
(6.25)
where (Thiemann et al., 1998):
(6.26)
Example 6.5
Plot the figure for the decomposition of N2O4 into NO2 as a function of pressure and temperature. Develop the equation for the equilibrium assuming the presence of inert in the gas stream.
Solution
The equilibrium constant is as follows:
where:
We use as a base for our computations 1 kmol of N2O4.
The mass balance to the equilibrium is presented below. d represents the dissociation degree for the dimer.
| Inters | |||
| Initial | 0 | 1 | a |
| Equilibrium | 2d | 1-d | a |

The molar fraction of each species and the partial pressure are computed as follows:

Substituting both into the equilibrium constant equation it becomes:

From the definition of equivalent NO2:

For a total pressure of 1 atm, and different equivalent NO2 compositions and temperatures, we compute d. In Fig. 6E5.1 we see that dissociation increases with temperature and with the amount of equivalent NO2. In Fig. 6E5.2 we present the effect of pressure. N2O4 dissociation decreases with pressure, as expected based on Le Chatelier’s principle.


6.2.3.2.4 Absorption of NOx
Absorption–oxidation towers are used to completely oxidize NO to NO2. The design of such columns depends on the kinetics. The global reaction that takes place is the reaction between the NO2 and N2O4 with water to produce nitric acid and NO. There are reactions in both phases: liquid and gas.
The unit is a tray reactive column with intercooling. Water is fed from the top and is put in countercurrent contact with the rising stream of nitrogen oxides. Typically, a stream of 60% nitric acid is produced and exits the column from the bottom. NO2 is soluble in the product acid. Therefore, a stripping column, working as a bleacher, is used to remove the NO2 from the liquid product. The model for the tower can be found in Holma and Sohlo (1979).
Reactions in the liquid phase:
The gas–liquid equilibrium for a particular tray is computed based on the equilibrium conditions and the reaction stoichiometries as follows:
where:
(6.27)
 (6.27)
(6.28)
(6.29)
As a result:
(6.30)
 (6.30)
Reactions between trays:
These reactions have been analyzed in a previous section. The first reaction is slow, and almost irreversible below 150°C. Dimerization is quick; therefore the equilibrium concentrations between the NO2 and the dimer can be computed with the equilibrium constant. In this case, inside the reaction tower, the following expression is used:
(6.31)
When the oxides rise (as the conversion increases), the partial pressures of the species decrease, and therefore the residence time should be larger, resulting in a larger separation between trays. We can assume that space between trays behaves as a plug flow reactor. The kinetics of the reaction are given by the following equation:
(6.32)
As a result, the global reaction is the following:
with an equilibrium constant of this:
(6.33)
where the pressure for liquids is their vapor pressure; for gases it corresponds to their partial pressure. Fig. 6.12 shows the vapor pressures of water and nitric acid as functions of the acid concentration. The value for the equilibrium constant is provided in the literature, either referred to NO2 or to equivalent NO2:
(6.34)
(6.35)

Another one:
(6.36)
These constants are given referred to gas phase. As the gases react and their partial pressures decrease, the tray distance required needs to increase. As a result, the product gases still have nitrogen oxides. Among them, NO2 provides a yellow color to the nitric acid. Furthermore, if released to the atmosphere, it is responsible for acid rain. Fig. 6.13 shows the mechanisms of the reactions taking place inside the column from the gas bulk to the liquid. The dissociation of the dimer decreases with the concentration of the acid.

Example 6.6
Determine the distance between the first two trays of an absorption column assuming that the kinetics are given as:
Solution
Assuming an isothermal plug flow reactor between trays we have:

Assuming ideal gases:

Dividing both:
Then, the concentration of the species i is as follows:


Thus the partial pressure of component i is calculated as follows:


The MATLAB code for solving the problem is shown below. For details on how to use MATLAB for reactor modeling we refer the reader to Martín (2014).
[a,b]=ode45(‘TorreOxidaNO’,[0 0.3],[0]);
plot(a,b)
xlabel(‘Height (Z)’)
ylabel(‘x’)
function Reactor = TorreOxidaNO(t,x)
%UNTITLED Summary of this function goes here
% Detailed explanation goes here
Temp=30+273.15;
Ptotal=15;
k1=0.2166*exp(1399/Temp);
PO2ini=0.06*Ptotal;
PNOini=0.1*Ptotal;
FNO=1; %kmol/s
A=1;%m2
Reactor(1,1)=A*(k1/FNO)*PNOini*(1−x)^2/( (PO2ini/PNOini−0.5*x)*(1-0.5*x*(PNOini/Ptotal)));
End
At 15 bar we get more than 90% conversion after 10 cm (Fig. 6E6.1).

Example 6.7
Perform the mass and energy balances to a dual-pressure plant of nitric acid. The feedstock consists of liquid ammonia and enriched air with oxygen, both at 1.5 atm and 25°C. The ammonia is evaporated and mixed before entering the converter. Table 6E7.1 shows the feed information. A two-stage compression with intercooling is used to reach 10 atm. The compressed gas is cooled down to 30°C from the temperature exiting the converter. Water condenses, producing nitric acid 3.5% w/w. This stream is mixed with weak acid to feed the absorption column. The mass ratio between the liquid and gas phases is 0.25, and the composition of the liquid is 2.5% in nitric acid w/w before the condensation. Assume isothermal operation of the columns. The product is nitric acid 60% w/w (Fig. 6E7.1).
Table 6E7.1
| T (°C) | 25 |
| Pv (mmHg) | 23.57 |
| Pt (mmHg) | 1140 |
| Humidity | 0.35 |
| Rel Air/O2 added | 12 |
| Rel O2 total/NH3 | 2 |

Solution

To evaporate the ammonia, the energy provided to the heat exchanger is as follows:
The mixture enters the reactor at the same pressure and temperature, 1.5 bar and 25°C. The summary of the mass and energy balances is presented in Fig. 6E7.2.

The reaction taking place in the converter is as follows:
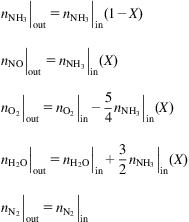
As presented in the description of the process, ammonia is expensive, and so is the platinum. Therefore, a conversion of 100% of ammonia is assumed. Based on the stoichiometry, we compute the flows of NO, H2O, oxygen, and nitrogen:
The temperature of the gases is computed by an adiabatic energy balance to the reactor where:

The summary of the results can be seen in Fig. 6E7.3.

The gases are compressed up to 10 atm using a two-stage compression system with intercooling. The pressure ratio at each compressor is (P2/P1)0.5=2.58. Assuming polytropic behavior of the compressors, the temperature and energy required are computed as follows:

Furthermore, the cooling requirements in between the compression stages so that each compressor receives the gas at the same initial temperature are as follows:

During the cooling to 30°C, we assume that the conversion of NO to NO2 is 100% since it is favored at high pressure and low temperature. In this condensation, we assume that nitric acid 3.5% by weight is produced with the water that condenses. Furthermore, there is an equilibrium between the NO2 and the N2O4. The composition of the gas exiting the cooler is computed in three stages:
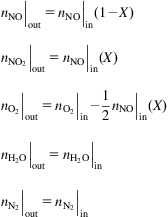
1. Determine the gas composition after the oxidation:
2. Compute the amount of HNO3 produced. Although the moment we have NO2 the equilibrium to N2O4 can be established (as long as nitric acid is produced), the N2O4 will decompose to provide for the NO2 that has been consumed. Thus, we first compute the acid production. The stoichiometry of the reaction is as follows:
During the cooling, there is also water condensation. This water is the one that is forming the weak nitric acid solution. Thus, the water remaining in the gas is the humidity that can be handled at 30°C. The rest condenses. Therefore, the acid produced is computed using the stoichiometry of the reaction as follows:

where

Thus, the amount of water that accompanies the gas is determined as follows:
The energy involved in the water phase change is included in the global energy balance as:
3. Finally, with the gas phase computed in the previous stage, we determine the equilibrium concentration as the final gas phase to be sent to the absorption tower,
where:
For the sake of argument, allow y to be the moles of N2O4 and x the moles of NO2 at equilibrium. Thus the equilibrium constant is given as follows:

The energy involved is computed as (Houghen et al., 1959):

where

For the products, remember that nitric acid is produced and diluted and that energy is also involved in that stage. Water leaves partially as liquid and partially by saturating the gas, thus we have both formation energies for the different aggregation stages:

The summary of the compression and cooling stages is presented in Fig. 6E7.4.

The exit gases are fed to the absorption column. The tower operates at 30°C and 10 atm. The liquid-to-gas mass ratio of operation is 0.25 and the nitric acid produced has a concentration of 60% by weight. To compute the mass of liquid added, the gas phase fed to the tower is used as follows (the liquid fed to the column is nitric acid 2.5%):


The gas phase is determined from the coupled balances. Again, the equilibrium between the NO2 and the N2O4 is to be recomputed after the production of nitric acid at the pressure and temperature of operation. The reaction is also highly exothermic, and therefore requires cooling.
An energy balance to the tower is performed as follows (Sinnot, 1999):

When computing the energy balance, beware of the different aggregation stages of water, fact that the solution of the concentrated acid has a specific heat capacity while the liquid in flow is mostly water and dilution energies as a function of the concentration (Houghen et al., 1959, Sinnot, 1999):

The summary of the mass and energy balances is given in Fig. 6E7.5.

6.3 Emission Control and Building Issues
NOx species are a hazardous waste responsible for acid rain. Therefore, tail gas must be properly processed to avoid or reduce those emissions. There are four typical approaches that nitric acid plants use:
• Improving column performance by careful control of the operating pressure and temperature.
• Chemical washing using ammonia, lime, or hydrogen peroxide.
• Adsorption in molecular sieves.
• Catalytic reduction of tail gas using a fuel below the flash point so that nitrogen oxides decompose over their surface. We can also use ammonia as reductor. This can happen at different stages:
• Optimization of the oxidation stage.
• Catalytic decomposition of N2O, just after the oxidation.
• Optimization of the absorption stage.
• Combined catalytic reduction of NOx/N2O using ammonia before the tail gas enters the expansion turbine.
Stainless steel has excellent resistance against weak nitric acid. Those with a lower concentration of carbon are preferred since they are more resistant to corrosion in the welding points. However, better quality materials such as high chromium alloys (20–27%) are needed across the process in sections where the temperature reaches 900°C, and in points where there is contact with liquid nitric acid, such as the condenser and the preheater of the tail gas. On the other hand, for the production of strong nitric acid (98–99% by weight) the most appropriate materials are aluminum, tantalus, borosilicate glass, silicon molted iron, and high-silicon stainless steel. Stainless steel is typically used for storage up to 95% weight, but above that aluminum is required, as long as the temperature is below 38°C. High-silicon stainless steel (4.7% by weight) is highly resistant to corrosion against concentrated nitric acid. However, it is not comparatively better than other alloys at lower concentration. High-silicon melted iron is appropriate for columns and pumps. Titanium is resistant to strong nitric acid from 65% to 90% and weak acid below 10%, but stress may be a problem if dealing with concentrations above 90%. Tantalus, although resistant in a wide range of conditions, is expensive, and its use is restricted to temperatures close to the nitric acid boiling point.
6.4 Problems
P6.1. A gas mixture contains nitrogen peroxide at 1 atm. The equivalent NO2 is 30% and the dissociated fraction of N2O4 is equal to 0.4. Determine the value for Kp in the equilibrium
and the temperature of operation. The equation for the equilibrium constant is given as follows:

P6.2. In the production of nitric acid, the oxygen proportion of the air is increased by mixing atmospheric (humid) air with oxygen so that the molar ratio between both is 4:1.
This stream is at 760 mmHg, and before mixing it with ammonia, the dew point is 11.24°C and the relative humidity is 0.42.
Ammonia is fed to the converter at the same temperature as that of the rich air. The oxygen fed to the converter is in 20% excess with respect to the stoichiometry of the reaction:
a. Composition and temperature of the product gases.
b. Maximum concentration of the acid produced if there is not stream separation and the required oxygen for the oxidation from NO to NO2 is provided.
P6.3. Determine the exit temperature for the product gases of an ammonia converter. The feed to the converter is 65.6°C, and the conversion is a function of the final temperature as given in Fig. P6.3. Assume no secondary reaction, adiabatic operation, and an excess of 10% oxygen with respect to the stoichiometric one.
P6.4. Perform the mass and energy balances for the production of HNO3 via catalytic oxidation of NH3.
Atmospheric air (see Table P6.4.1) is mixed with oxygen so that the ratio of oxygen to ammonia becomes 2.15. The ratio of air to added oxygen is 11.5. Assume 1 kmol of atmospheric air for the calculations.
The converter is fed at 36.5°C and 699 mmHg. Assume 100% conversion. Compute the temperature and composition of the gases exiting the converter assuming adiabatic operation. The gases are cooled down to 25°C at 699 mmHg. In the process, NO is oxidized to NO2 with a conversion of 15%. Nitric acid is also produced with a composition of 3.5%. The gas is next fed to an oxidation tower. Determine the temperature of the gases exiting the tower assuming adiabatic operation. The gases are cooled down to 30°C and fed to the absorption–oxidation tower that operates isothermally. A solution of nitric acid 2.5% is put into contact with the gas. The L/V mass ratio is 0.2. The product gas is expected to reach 60% concentration. Compute the flow of acid solution required (Table P6.4.2).
Data:

P6.5. A sphere of 10L is filled with a mixture consisting of 25% NO and the rest dry air at 20°C and 1 atm. We allow equilibrium to be reached.
Determine:
a. The total final pressure and the partial pressure of the species in the equilibrium.
b. The total final pressure and the partial pressure of the species in the equilibrium if the temperature becomes 10°C or 40°C (A.F. Tena).
P6.6. Compute the exit temperature and the gas composition of an oxidation tower. Assume 100% conversion of NO to NO2. The operating pressure is 10 atm and the feed properties are given in Table P6.6.
P6.7. Determine the exit temperature for the product gases of an ammonia converter. The feed to the converter is 65.6°C, and the conversion is a function of the final temperature as given in Fig. P6.3. Assume no secondary reaction, and the excess of air to reach 90% conversion:
P6.8. Determine the time it takes to reach 90% conversion in the production of NO2 from NO for a range of temperatures from 30°C to 100°C and 1 atm (Table P6.8):
P6.9. Compute the composition of the HNO3 solution fed to an absorption–oxidation tower to obtain a concentrated acid at 65%. The mass ratio L/V is 0.25 and the conversion of the equivalent NO2 is 90%. The gas stream is fed to the tower at 30°C and 10 atm and the composition is given in Table P6.9.
Determine the composition of the product gas assuming isothermal operation.
P6.10. Determine the tray separation required in an absorption-oxidation tower to reach a conversion of 85% assuming the following reaction rate for an operating pressure of 15 atm and 30°C. The composition of the feed is 6% molar of oxygen and 10% molar of NO, and the rest nitrogen. Assume a flow of NO of 1 kmol/s and an area of 1 m2.

Table P6.4.1
| T air (°C) | 15 |
| Ptotal (mmHg) | 699 |
| Relative humidity | 0.25 |
| Ratio Air/O2 added | 11.5 |
| Ratio O2 total/NH3 | 2.15 |
Table P6.4.2
Absorption Tower Operating Data
| T in tower (°C) | 30 |
| Pt (mmHg) | 699 |
| Conc liq abs (%) | 2.5 |
| Conc HNO3 prod (%) | 60 |
| L/V | 0.2 |
Table P6.6
| In | ||
| kmol | kg | |
| N2 | 0.78357048 | 21.9399735 |
| O2 | 0.10798747 | 3.45559896 |
| H2O | 0.00244144 | 0.04394591 |
| NO | 0.11752368 | 3.52571029 |
| NO2 | 0.0076061 | 0.12930368 |
| N2O4 | 0.00546848 | 0.34451412 |
| T (K) | 293.6 | |
| P (atm) | 10 | |

