
Nitric acid
Abstract
This chapter focuses on the evaluation of nitric acid production. Apart from presenting the different methods used over time, and the technical and historical reasons for using the various technologies, the complete analysis of current processes is presented based on mass and energy balances. Furthermore, the performance of the units involved in the process is also evaluated using a unit operations approach and reactor engineering analysis, including kinetics, and chemical and phase equilibria. Examples in MATLAB are provided for the oxidation of NO in a reactor tower, and the study of the equilibrium of phases allows analysis of the performance of nitric acid concentration.
Keywords
Nitric acid; ammonia; extractive distillation; process analysis
6.1 Introduction
History: Nitric acid was already known by alchemists in the Middle Ages. However, it was not until the 12th century that its preparation was described in the “De Inventioni Veritatis.” Nitric acid was produced by distillation of a mixture consisting of 1 g of vitriolum cyprium (CuSO4·5H2O), 1.5 g of potassium nitrate KNO3, and 0.25 g of potassium alum (KAl(SO4)2·12H2O). It was again described by Albert the Great in the 13th century and by Ramon Lull, who prepared it by heating niter and clay and called it “eau forte” (aqua fortis). A few centuries later, in 1776, Lavoisier showed that it contained oxygen. Cavendish, in 1785, was able to produce it by an electric discharge in humid air, proving that it contained nitrogen and oxygen. Finally, the complete composition was determined by Gay-Lussac and Bethollet in 1816. The actual use only expanded when sulfuric acid became commercial.
Production: The industrial process developed by Glauber in 1698 was used for centuries. It consisted of the distillation of a mixture of potassium nitrate (KNO3) and sulfuric acid (H2SO4). Potassium nitrate was substituted by NaNO3 (Chile saltpeter) during the great war. Although it had been produced from NO obtained in air combustion, the current method based on the catalytic oxidation of ammonia was patented in 1902 by Wilhem Ostwald. Nitric acid must be kept from light and heat since NO2 gases are produced, giving it a yellow color. The major world producers are Germany, France, the United Kingdom, Belgium, Canada, and Spain (Ortuño, 1999).
Uses: In 2013 fertilizers used 80% of the total nitric acid produced. Among them, 96% was ammonium nitrate. Nonfertilizer use represents around 20%. The main products are nitrobenzene (3.6%), dinitrotoluene (2.8%), adipic acid (2.7%), and nitrochlorobenzenes (1.8%). The total world production is around 55 MMt/yr. Fig. 6.1 presents the major products obtained from nitric acid (Clarke and Mazzafro, 1993).

6.2 Production Processes
6.2.1 From Nitrates
In this production process, sodium nitrate and sulfuric acid are mixed in a smelter. The sodium sulfate obtained remains in the vessel while the nitric acid is distilled.
Since sulfuric acid is used in excess, up to 60–70% of sodium bisulfate is also produced. The advantage is that it is easier to handle.
Furthermore, sodium pyrosulfate is also produced. This chemical is undesirable because it is a foaming agent that requires large vessels to contain it.
In the distillation, impurities such as HCl and nitrosyl chloride are removed first.
6.2.2 Air as Raw Material
The advantage that this method exploits is its cheap and widely available raw material: air. However, it exhibits a major drawback too—the large amount of energy required, which is provided by an electric arc. Therefore, although the method is technically interesting, it has not been developed industrially due to its high cost. The Nernst equation can provide an estimate of the production of NO as a function of the working temperature (see Table 6.1). The Birkeland and Eyde electric arc was installed in Norway in 1905 and was operated for 35 years. The energy consumption added up to 14,000–17,000 kWh per ton of nitric acid produced.

6.2.3 Ammonia-Based Processes
In 1839, a German technical chemist named Kuhlman discovered the role of platinum in the oxidation of ammonia. He predicted its commercial application, but at that time there was no commercial necessity. As the demand for fertilizers and explosives increased, the Germans realized that local production of nitric acid was a need. The first plant based on the Ostwald process was allocated in Westphalia, Germany, in 1909. Soon after, in 1918, the first one in England started its production. The process itself consists of five stages:
1. Oxidation of NH3 to NO (catalyzed with platinum). The high cost of ammonia and platinum requires a high conversion of the reaction.
2. Oxidation of NO to NO2 (no catalyst). It is a slow reaction.
3. Absorption of NOx in water for the production of nitric acid. There is also a reduction of NO2 to NO. In the column both absorption and reaction take place.
4. Tail gas purification. This stream is also used as a cooling agent.
6.2.3.1 Process description
Nitric acid production processes are classified by their operating pressure. Apart from early designs that worked at atmospheric pressure, currently they work at medium (1.7–6.5 bar), high (6.5–13 bar), or dual pressure. These processes try to make the most of the chemical principles governing the operations. Oxidation, as will be explained later, is favored at lower pressure, while the absorption of a gas in water has higher yield at high pressure. Dual process can work at low–medium pressure so that the oxidation occurs below 1.7 bar and the absorption from 1.7 to 6.5, or medium–high pressure, in which case the oxidation occurs from 1.7 to 6.5 bar while the absorption takes place at 6.5–13 bar (Ray and Johnson, 1989, MMAMRM, 2009). Table 6.2 shows typical operating parameters used in industry.
Table 6.2
Typical Operating Parameters of Different Basic Processes (Thyssenkrupp Uhde, 2015)
| Plant Type (per t of HNO3) | Medium Pressure | High Pressure | Dual Pressure |
| Operating pressure (bar) | 5.8 | 10 | 4.6/12 bar |
| Ammonia (kg) | 284 | 286.0 | 282.0 |
| Electric power (kWh) | 9.0 | 13.0 | 8.5 |
| Platinum (primary losses (g)) | 0.15 | 0.26 | 0.13 |
| With recovery (g) | 0.04 | 0.08 | 0.03 |
| Cooling water (ΔT=10 K) (t) | 100 | 130 | 105 |
| Process water (t) | 0.3 | 0.3 | 0.3 |
| LP heating steam, 8 bar, saturated (t) | 0.05 | 0.20 | 0.05 |
| HP excess steam, 40 bar, 450°C (t) | 0.76 | 0.55 | 0.65 |
| N2 yield (%) | 95.7 | 94.5 | >96 |
| HNO3 conc. (%) | Max. 65 | Max. 67 | >68 |
| Tail gas (ppm) | 500 | 200 | 150 |

In Table 6.3, examples of industrial process plants recently built are shown with the company that runs them and the main operating conditions. We see that by operating at constant pressure we rarely go beyond a concentration of 65%. Somehow, the advantage achieved by operating at the optimal conditions for one of the stages, ammonia oxidation or NO2 absorption, mitigates the performance loss in the second one. However, dual pressure optimizes the operation, reaching concentrations around 68%.
Table 6.3
New Plant Operating Conditions (Thyssenkrupp Uhde, 2015)
| Year | Company | Location | NH3 Oxidation Pressure (bar) | Absorption Pressure (bar) | Acid Concentration% | Capacity mtpd 100% |
| 2005 | Rashtriya Chemicals and Ferlilizers Ltd. | India | 7.5 | 7.5 | 60 | 352 |
| 2003 | Namhae Chemical Corporation | Korea | 4.6 | 12 | 67 | 1150 |
| 2001 | BP Koln GmbG | Germany | 4.6 | 12 | 68.25 | 1500 |
| 2001 | Radice Chimica GmbH | Germany | 10 | 10 | 65 | 250 |
| 2001 | ACE Pressureweld | Singapore | 4.4 | 4.4 | 60 | 12 |
| 2000 | Queensland Nitrates Pty Ltd. | Australia | 10 | 10 | 60 | 405 |
| 1999 | Enaex SA | Chile | 10 | 10 | 60 | 925 |
| 1999 | Namhae Chemical Corporation | Korea | 10 | 10 | 65 | 300 |
| 1998 | SKW Stickstoffwerke Piesteritz GmbH | Germany | 5.6 | 5.6 | 62 | 500 |
| 1998 | CF Industries Inc. | United States | 4.6 | 11 | 57.5 | 870 |

Based on the information on real processes presented in the tables above, the different operating modes and the corresponding flowsheets will be described below.
Some medium-pressure process examples are Montecatini (1.7–5 atm), Chemico (4–4.5 atm), Stamicarbon (4.5 atm), and Uhde (4.5 atm). The main advantage of these processes is the reduced consumption of catalyst. Furthermore, the energy consumption is lower, as well as the risk that explosive mixtures will be formed. However, the construction materials are expensive, and typically the acid concentration is lower, requiring distillation. Note that the azeotrope water–nitric acid occurs at 68% concentration. This method is appropriate when nitric acid is to be devoted to fertilizer production.
Fig. 6.2 shows Uhde’s medium-pressure process flowsheet. Ammonia is evaporated and filtrated. On the other hand, the air to be used in the combustion is purified using a two- or even three-step filtration system. The filters are expected to remove all the particles in the ammonia and air streams to avoid interferences with the catalyst during the oxidation of NH3. Next, the flow is pressurized. The air stream is split in two. One stream is sent to the catalytic converter, the other to the bleaching section of the absorption column.

1. Reactor; 2. Process gas cooler; 3. Tail gas heater 3; 4. Economizer; 5. Cooler condenser and feed water preheater; 6. Absorption; 7. Bleacher; 8. Tail gas heaters 1 & 2; 9. Tail gas reactor; 10. Ammonia evaporator & superheater; 11. Turbine steam condenser. With permission from Thyssenkrupp Uhde, 2015. http://www.thyssenkrupp-industrial-solutions.com/fileadmin/documents-/brochures/uhde_brochures_pdf_en_4.pdf.
The first air stream is mixed with ammonia in a ratio of 10:1, with careful consideration to avoid an explosive mixture composition. The mixture can be filtered again. Next, NH3 reacts with air over the catalysts. The reaction, which is in fact an equilibrium that produces nitric oxide and water, is as follows:
Apart from this main reaction, nitrogen and nitrous oxide (N2O) can also be produced, as given by the reactions below:
The objective is to optimize the oxidation stage so that the main product is NO, reducing the concentration of undesired products such as N2O. To achieve this, the proper pressure, temperature, and NH3/air ratio should be used. The typical feed ratio is from 9.5% to 10.5% of ammonia. Furthermore, the conversion of the reaction to NO depends on pressure and temperature, as shown in Table 6.4 (European Commission, 2009). Table 6.4 also illustrates that low pressure and a temperature of 750–900°C are the optimal operating conditions to achieve high conversions. The reaction is carried out in the presence of a metal mesh made of 90% platinum, using rhodium for better mechanical resistance. Sometimes palladium is also added.
Table 6.4
Ammonia Conversion as Function of Pressure and Temperature
| Pressure (bar) | Temperature (°C) | % NO |
| <1.7 | 810–850 | 97 |
| 1.7–6.5 | 850–900 | 96 |
| >6.5 | 900–940 | 95 |
The reaction is highly exothermic, and the product stream is used to produce steam and/or to heat up the tail gas. After this cooling step, the product gas is between 100°C and 200°C, and it is further cooled down with water. The water generated in the oxidation condenses in a cooler–condenser unit, and it is later transferred to the absorption column. Nitric oxide is filtered to remove platinum particles, and it is oxidized to nitrogen dioxide as the gases are cooled down to 45–50°C in the absence of any catalyst following the reaction:
It is a homogenous process that depends on the working pressure and temperature. High pressure and low temperature are the best operating conditions. The absorption column is fed using demineralized water and condensed steam, or process condensate. The weak acid solution (around 43%) generated in the refrigeration of the product gas is also fed to the column. The NO2 is put into countercurrent contact with water in the tower, producing HNO3 and NO:
Secondary air is fed to oxidize the NO produced. The oxidation and absorption of NO is carried out in the liquid and gas phases, respectively. In the trays the absorption takes place while the oxidation occurs in-between trays. High pressure and low temperature favor these reactions. The tower is typically 2 m in diameter and 46 m high, with 49 trays.
The process that takes place in the absorption tower is highly exothermic and requires continuous cooling. The nitric acid produced contains dissolved NO2 and therefore has to be bleached using secondary air. The NO2 is stripped out from the nitric acid and later reused. Typically the nitric acid produced is a solution with 55–70% acid, depending on the tower design and the operating conditions. The unabsorbed gases, or tail gas (at 20–30°C), exit from the top of the column. They are heated up using the excess energy generated in the oxidation of NO to NO2. Heat integration is therefore included in process design. The hot tail gas is then processed to reduce the NOx content. A fraction of the feed of ammonia is used as per the reactions bellow so as to decompose the nitrogen oxides.
Next, tail gas is expanded in a turbine to recover part of the energy–power integration. The tail gas, typically over 100°C to avoid precipitation of ammonium nitrate and ammonium nitrite, is sent to a chimney.
In general, high-pressure processes are characterized by high catalyst, energy, and water consumption. The advantage is the smaller size of the equipment and the higher nitric acid concentration. Typically, these processes are better-suited when the acid is used in the production of explosives. Fig. 6.3 shows the flowsheet, which is similar to the previous one. The higher pressure requires the use of interstage cooling between compressors. Some examples are Dupont de Nemour (8–9 atm), Chemico (10–12 atm), Weathey (10–12 atm), and Uhde (12 bar).

1. Reactor; 2. Process gas cooler; 3. Tail gas heater 3; 4. Economizer; 5. Cooler condenser and feed water preheater; 6. Absorption; 7. Bleacher; 8. Tail gas heaters 1 & 2; 9. Tail gas reactor; 10. Ammonia evaporator & superheater; 11. Turbine steam condenser; 12. Air intercooler. With permission from Thyssenkrupp Uhde, 2015. http://www.thyssenkrupp-industrial-solutions.com/fileadmin/documents-/brochures/uhde_brochures_pdf_en_4.pdf.
Analyzing the principles of operation of various processes, it is clear that ammonia oxidation achieves higher yields at low pressures while the absorption of NO2 in water is favored at high pressure. Therefore new plants use a dual-pressure process by adding a compression stage between the oxidation of the ammonia and the condenser. Typically, an external bleacher is used to strip out the NO2 dissolved in the nitric acid produced. Fig. 6.4 shows a flowsheet for a dual process.

Following the production of nitric acid, its concentration ranges from 60% to 70%, depending on the process conditions. This concentration is not enough for certain applications. There are two methods for obtaining a concentrated acid: direct and indirect.
Direct methods are based on the production of liquid N2O4, which is then reacted with oxygen and water under pressure to produce HNO3:
To produce N2O4, NO from the converter at low pressure is oxidized to NO2 via oxidation and postoxidation steps. Next, the NO2 is purified with concentrated nitric acid from the absorption stage, process condensate, and weak nitric acid from the final absorption. Subsequently, the NO2 or the N2O4 are separated from the concentrated acid by bleaching and are then condensed. The most challenging stage is the production of liquid nitrogen dioxide. It can be either obtained by condensing NO2 under pressure or by absorption on nitric acid. Then the reaction presented above is carried out, but instead of using water, nitric acid from the final absorption stage is used in a reactor at 50 bar and 75°C. A part is already a product, while the rest is recycled to absorption and final oxidation.
The residual gas from absorption can be discharged to the atmosphere, providing the NOx concentration is within legal limits. Typically, condensates containing nitric acid are recycled within the process, otherwise they are processed as wastes.
Indirect methods are based on the extractive distillation of weak nitric acid (with sulfuric acid, for example). In Fig. 6.5 a phase diagram of the water–nitric acid system is presented. It shows a maximum boiling point azeotrope at around 68% weight fraction. Therefore, a dehydrating agent such as sulfuric acid or a solution of magnesium nitrate (Mg(NO3)2) can be used. Fig. 6.6 shows that if a solution of sulfuric acid with a concentration over 50% is used, the azeotrope disappears. Typically, sulfuric acid at 60% is used. Thus the nitric acid with a concentration of 55–65% is distilled with sulfuric acid. The liquid is fed from the top and flows countercurrently to the vapors that rise. Nitric acid in the vapor phase exits from the top of the column with a concentration of 99%. The impurities consist of small amounts of NO2 and O2. To purify the nitric acid, it is fed into a bleacher system to remove the dissolved NOx. The vapors are hereby condensed and treated in countercurrent with the air. The air and the NOx are sent to an absorption column where the NO is oxidized with secondary air to produce NO2 that is later recovered as a weak acid. The unreacted gases are released to the atmosphere. Tail gases are treated in a wet scrubber to remove the NOx using alkali solutions, or by means of molecular sieves that catalyze the oxidation of NO to NO2 and later adsorb NO2 to be recycled to the absorber. Fig. 6.6 shows a scheme of the flowsheet described above.


In the extractive column an equilibrium among water, nitric acid, and sulfuric acid takes place. Fig. 6.7 shows the triangular diagram for the nitric acid–sulfuric acid–water system including the azeotrope. We illustrate the operation of this column in Example 6.1.

Example 6.1
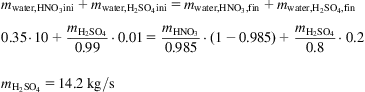
Nitric acid at 65% is produced from a medium-pressure process. Compute the sulfuric acid required (99%) to concentrate 10 kg/s of nitric acid up to 98.5%. Sulfuric acid at 80% by weight leaves the system. Determine the flows of the streams exiting the tower.
Solution
A mass balance to water can be performed as follows:
The composition of the streams that cross in the rectifying section can be computed by aligning the point difference, Δ, to the tangent to the equilibrium line of 98.5% (Fig. 6E1.1):

The nitric vapors are computed as follows (Fig. 6E1.2):

6.2.3.2 Process analysis
6.2.3.2.1 Ammonia oxidation
Reaction and equilibrium
Fig. 6.8 shows a scheme of the converter with the sponge of platinum catalyst and heat recovery regions. The reaction that takes place is the following:

Le Chatelier’s principle suggests that low pressures and temperatures favor the conversion of NH3 to NO. However, kinetics suggest higher operating temperatures. Temperatures below 400°C do not allow oxygen fixing, and therefore there is no reaction. If the temperature is over 600°C, the rate is diffusion-controlled. The oxygen is fixed to the catalyst and reacts. Over 1000°C, too much oxygen is absorbed and the reaction rate decreases. Apart from the main reaction, NO decomposition may also occur:
The effect of temperature, pressure, and feed composition on the conversion can be seen in Fig. 6.9. The lower the pressure and the higher the oxygen-to-ammonia ratio, the higher the conversion. However, an optimum can be found due to the fact that low temperatures do not allow oxygen fixing. A higher operating temperature produces more nitrogen and N2O. Over 950°C, the catalyst losses increase, mainly due to vaporization. N2O is unstable at 850–950°C, and it is partially reduced to nitrogen and oxygen. Larger contact times and higher temperatures favor this reaction. The reaction temperature is directly related to the ratio of ammonia-to-air so that a 1% increment in ammonia results in an increase of 68°C. Finally, the use of air instead of oxygen improves the temperature control.

Factors that affect catalyst losses
• Temperature and thermal shocks: Catalyst losses increase exponentially with temperature from 0.2% at 720°C to 1% at 880°C. At the same temperature, the richer the gas in ammonia, the lower the catalyst losses. Start-up and shutdown create temperature gradients that may result in catalyst structural breakage.
• Catalyst composition: The addition of rhodium to the catalyst (up to 10%) reduces catalyst losses with temperature. While at 720°C 0.2% losses are reported, at 880°C no more than 0.5% losses are expected. Above 10% of rhodium, the catalyst becomes fragile, increasing the losses. Typical platinum losses are on the order of 0.12 g/t of nitric acid produced, and the ammonia conversion reaches a maximum for around 10–20% rhodium concentration. Palladium can also be added to the catalyst (up to 4%).
• Pressure effect: Platinum losses increase five times when the pressure increases from 1 to 8 atm.
• Number of meshes and relative position: The most characteristic parameters that define a mesh are the number of threads, thread diameters, meshes per square centimeter, surface, and free surface. Fig. 6.10 shows the pictures taken with an electronic microscope of the initial stage and when it was activated. The threads have 0.06–0.09 mm of diameter, and there are typically 1024 meshes per square centimeter. Meshes allocated to the exit are the most affected. Currently, for structural purposes, some meshes are substituted by stainless steel or alloys, but the yield of the converter decreases.

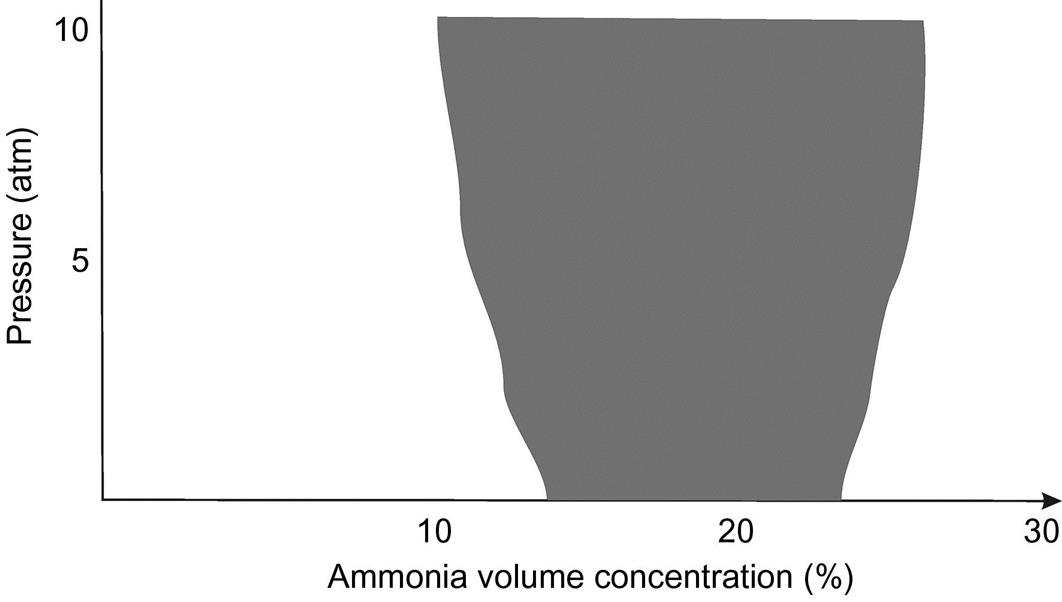
Explosion limit for ammonia–oxygen mixtures
Ammonia and air can produce explosive mixtures for certain ammonia concentrations. The value is sensitive to pressure. Fig. 6.11 shows the mixtures with explosive composition at 900°C, and Table 6.5 presents the typical mixtures used and the explosion limits at different pressures. For security reasons no more than 11% ammonia in air is fed to the converter. Typically for a low-pressure operation, a 10.8% volume is set. The ratio of O2 to ammonia should be around 2.
Reaction kinetics and mechanism
In the reactor, a number of reactions take place, from the decomposition of the ammonia to produce nitrogen and hydrogen, to the production of water if the ammonia reacts with the NO. NO can also decompose to nitrogen and hydrogen, and water is formed from the hydrogen and oxygen in the mixture:
(6.1)
 (6.1)
(6.1)The actual rate for the production of NO is given in (moles/cm2 s) (Hickman and Schmidt, 1991):
(6.2)
The reaction is so fast that it is limited by external mass transfer. Gauze reactors are used, and the reaction takes place on the surface of the wires. The kinetics can be simplified as proposed by Apelbaum, Temkim, and Viwump (Wallas, 1959):
(6.3)
(6.4)
(6.5)
As presented before, temperatures from 600°C to 900°C are common in industrial practice, and therefore the second approximation holds. The design of such reactors is carried out as presented below (Harriott, 2003). Assuming that the gas flow does not change much along the reactor:
(6.6)
n is the number of gauzes, a′ is the external area of one gauze per unit cross section, and uo is the velocity of the gas. For a gauze with square openings:
(6.7)
where N is the number of wires per unit length and d is the wire diameter. The conversion, X, of the reactor becomes:
(6.8)
(6.9)
 (6.9)
(6.9)
where μ and ρ, are the viscosity and density of the gas, respectively, and ![]() is the diffusivity.
is the diffusivity.
Example 6.2
Determine the temperature of the gases exiting the converter. Assume that the ammonia mixture is fed at 65.5°C, the reactor operates adiabatically, and 90% conversion is reached. Neglect secondary reactions.
Solution
The reaction that takes place is as follows:
In this example the data related to heat capacities and formation enthalpies are presented in the appendix.
a. For stoichiometric air we formulate a mass and energy balance assuming a reference temperature of 25°C:

We need to solve a four-degree polynomial on temperature. Table 6E2.1 show the results of the mass and energy balance. The outlet temperature is 1164 K.
b. For 10% excess of air the gas exit temperature is 1107 K, see Table 6E2.2, lower than before since the air has to be heated up, and therefore the gas absorbs part of the generated energy.
c. For the pure oxygen case, no nitrogen is present and all the energy produced in the reaction is carried by the product gas. Thus the exit temperature would be 2096 K.
Table 6E2.1
| In | Out | ||||||
| kmol | kg | Qf(kcal) | kmol | kg | Qf(kcal) | Qr(kcal) | |
| N2 | 4.7 | 131.6 | 1331.68547 | 4.7 | 131.6 | 30,243.7232 | |
| O2 | 1.25 | 40 | 366.917421 | 0.125 | 4 | 1143.13708 | |
| H2O | 0 | 0 | 1.35 | 24.3 | 10,642.232 | −78,027.3 | |
| NO | 0 | 0 | 0.9 | 27 | 6016.39115 | 19,440 | |
| NH3 | 1 | 17 | 352.082501 | 0.1 | 4.6 | 2728.50194 | 9864 |
| Temp | 338.6 | 1163.97265 | |||||
| Q | 2050.68539 | 50,773.9854 | −48,723.3 | ||||
| Qin+Qgenerated | Qout= | ||||||
| =50,773.9854 | 50,773.9854 | ||||||

Table 6E2.2
| In | Out | ||||||
| kmol | kg | Qf(kcal) | kmol | kg | Qf(kcal) | Qr(kcal) | |
| N2 | 5.17 | 144.76 | 1464.85401 | 5.17 | 144.76 | 30,927.8436 | |
| O2 | 1.375 | 44 | 403.609163 | 0.25 | 8 | 2060.48012 | |
| H2O | 0 | 0 | 1.35 | 24.3 | 9854.66725 | −78,027.3 | |
| NO | 0 | 0 | 0.9 | 27 | 5590.22948 | 19,440 | |
| NH3 | 1 | 17 | 352.082501 | 0.1 | 4.6 | 2510.62525 | 9864 |
| Temp | 338.6 | 1107 | |||||
| Q | 2220.54568 | 50,943.8457 | −48,723.3 | ||||
| Qin+Qgenerated | Qout= | ||||||
| =50,943.8457 | 50,943.8457 | ||||||

6.2.3.2.2 NO oxidation to NO2
The reaction is an equilibrium that is exothermic towards NO2 and very slow. While the NO is colorless, the NO2 is yellow.
The equilibrium constant is given as Eq. (6.10):
(6.10)
 (6.10)
In Table 6.6, some representative values of the equilibrium constant can be found. For low temperatures (below 200°C), almost 100% conversion can be reached. High pressure is also recommended.
Table 6.6
| T (°C) | 38 | 200 | 400 | 600 | 800 | 1000 |
| Kp | 1.0×10¹¹ | 1.0×10⁵ | 1.0×101 | 1.0×10⁻¹ | 1.7×10⁻³ | 1.2×10⁻³ |

The reaction kinetics is given by the following expression:
(6.11a)
At low temperatures, based on the equilibrium shown above we have:
(6.11b)
where the kinetic constant, according to Bodenstein (1922), is the following:
(6.12)
To illustrate the rate of the reaction, assuming a batch reactor for the sake of argument, we compute the time required to achieve a certain conversion. Example 6.6 provides a plug flow reactor example. For now, assuming ideal gases:
(6.13)
For constant temperature and volume, P is directly proportional to the number of moles:
(6.14)
(6.15)
(6.16)
We define the conversion as Eq. (6.17):
(6.17)
Thus the reaction kinetics are as follows:
(6.18)
 (6.18)
(6.19)
 (6.19)
Example 6.3
Using the equations developed for the reactor kinetics below 200°C, determine the time required to reach 90% conversion for a reaction mixture of 10% NO, 7% O2, and 83% inert gases operating at:
Solution


The time required for the reaction decreases by two orders of magnitude when pressure increases by one order of magnitude.
Example 6.4
Compute the conversion from NO to NO2 as a function of pressure and temperature for the following cases using the equilibrium constants shown in Table 6.6:
a. Only NO and O2 are present and oxygen is in stoichiometric proportion.
b. Assume that oxygen is not in stoichiometric proportions.
c. Assume that there are NO and O2 (but not in stoichiometric proportions), and that there are inert gases.
d. Plot the equilibrium constant for various pressures from 1 to 8 atm. Assume that the initial stream consists of 10% NO, 6% O2, and inert.
Solution
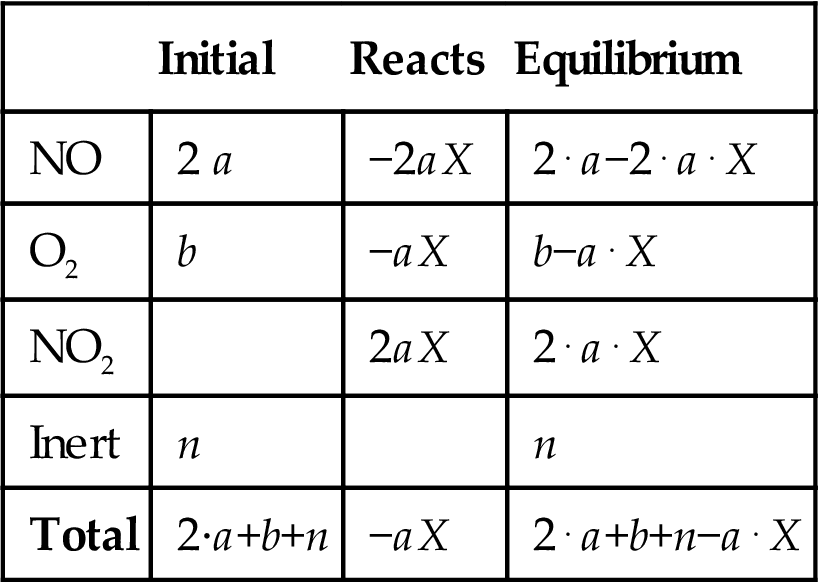
Instead of developing each case, a general formulation of the problem is provided. Next, the general expression is simplified for each case. For the sake of simplicity, let b be the moles of oxygen, 2a the number of moles of NO, n the moles of inert gas, and X the conversion of the following reaction:
Table 6E4.1 presents the mass balance to the species involved in the equilibrium.
Table 6E4.1
Mass Balance to the NO Oxidation Equilibrium
| Initial | Reacts | Equilibrium | |
| NO | 2 a | −2aX | 2⋅a−2⋅a⋅X |
| O2 | b | −aX | b−a⋅X |
| NO2 | 2aX | 2⋅a⋅X | |
| Inert | n | n | |
| Total | 2·a+b+n | −aX | 2⋅a+b+n−a⋅X |
The equilibrium constant can be written as follows:
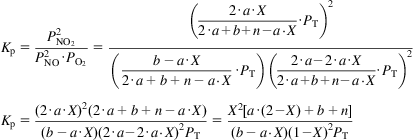
a. Only reactants and no inert (n=0). Oxygen in stoichiometric proportion (a=b). The values for the equilibrium constant in Table 6.6 are correlated to the equation shown below:

For P=1 atm, see the results in Fig. 6E4.1.
b. Only reactants and no inert (n=0), but the oxygen is not in stoichiometric proportion (![]() ).
).
c. Reactants and inert (this is the general case).

d. Particular example with 10% NO, 6% O2, and the rest inert. Compute the conversion for pressures ranging from 1 to 8 atm. Thus:

Fig. 6E4.2 shows the effect of pressure and temperature in the conversion. Low temperatures and high pressures are recommended for high conversions.

6.2.3.2.3 Nitrogen peroxide equilibrium
Although it lacks peroxo bonding, it has typically received that name. It is a quick reaction, so the equilibrium is assumed to be reached instantaneously:
The kinetics of the reaction are given by the following expression (Thiemann et al., 1998):
(6.20)
where the kinetic rate, Kp, is almost independent of the temperature, and equal to 5.7×10⁵ atm−1 s−1.
The equilibrium constant is computed as given by Eq. (6.21):
(6.21)
Several expressions can be found for its dependence on temperature, for instance (Thiemann et al., 1998):
(6.22)
(6.23)
The equilibrium is driven to the right at low temperature and high pressure. N2O4 can easily be liquefied, a useful property for its transport. In most cases, the term equivalent NO2 is used in order to avoid including the dimer in the balances. It is defined as the NO2 that would be available if all the dimer were decomposed into NO2:
(6.24)