
Chapter 7
Natech Risk and Its Assessment
E. Krausmann European Commission, Joint Research Centre, Ispra, Italy
Abstract
Risk analysis is a powerful tool for estimating the risk level originating from a hazardous industrial activity. This chapter briefly introduces the industrial risk–assessment process and proposes a methodology for Natech risk assessment based on the conventional QRA procedure, illustrating the individual steps of the process. It also discusses the accompanying data requirements and common applications of the results.
Keywords
industrial risk assessment
qualitative risk assessment
QRA
data requirements
consequence analysis
domino effect
Risk analysis is a powerful tool for estimating the risk level originating from a hazardous industrial activity. This chapter briefly introduces the industrial risk–assessment process and proposes a methodology for Natech risk assessment based on the conventional QRA procedure, illustrating the individual steps of the process. It also discusses the accompanying data requirements and common applications of the results.
7.1. General Considerations
In most countries a risk assessment is required to identify and minimize public-health threats or potential environmental effects of a proposed hazardous industrial activity, both during normal operation and in accident situations. Identification of potentially significant effects may lead to a modification of the proposed action to reduce risks or to the consideration of alternatives. The potential impacts of natural hazards are generally taken into account to some extent in the design and construction of facilities by adhering to dedicated codes and standards, although the impacts are not usually fully considered in risk-management plans.
However, as already discussed in Section 4.2.1, there are questions related to the adequacy of the design basis of hazardous installations against natural-hazard loading. The primary goal of natural-hazard resilient design for buildings and other structures (e.g., against earthquakes or high winds) is to prevent building collapse and therefore to guarantee life safety. In order to reduce Natech risk the preservation of the structural integrity is not sufficient; the avoidance of loss of containment (LOC) of hazardous materials must also be considered. In addition, it is usually unclear which level of damage or failure (possibly including LOC) is to be expected above the design-basis loading (Krausmann, 2016).
Consequently, the adoption of performance-based design against natural-hazard impacts is recommended for critical structures and buildings within an industrial plant. Performance-based standards require that safety-relevant buildings, equipment, and systems satisfy performance criteria (e.g., control rooms remain operational after a design-basis natural event) with respect to materials, equipment, and design and construction methods (Cruz and Okada, 2008).
Risk analysis is the tool of choice for estimating the level of risk produced by a hazardous activity. Quantitative risk analysis in particular allows the identification of system weaknesses, the prioritization of safety measures in terms of their yield for risk reduction, or the estimation of a facility’s overall risk level, summarized in a risk figure. This risk figure can then be compared with prescribed target levels, where existing, to show that risks are adequately controlled in fulfillment of regulatory requirements.
7.2. The Industrial Risk–Assessment Process
The qualitative or quantitative assessment of the risk from an industrial operation is an important step in controlling this risk. The assessment process comprises five steps: (1) the identification of the hazard(s) and failure mechanisms; (2) the estimation of the failure frequencies; (3) consequence analysis to understand the impact of failure in terms of overpressure, heat radiation, and dispersion of toxic materials; (4) risk integration or recomposition where likelihood and consequence information is combined to express total risk; and (5) risk evaluation where the risk estimate is compared to tolerability or acceptability targets or criteria (Cox, 1998). The first four steps are also referred to as risk analysis.
Qualitative risk analysis is often used as a first step in industrial risk assessment as it requires relatively little effort and no specific expertise in risk analysis. The risk is estimated by defining severity categories for both the event frequencies and the consequences which are combined in a so-called risk matrix (Table 7.1). This is a simple but effective method for obtaining an overview of which hazards need to be prioritized to reach predefined risk-reduction targets.
Table 7.1
Example of a Risk Matrix

Adapted from Cox (1998).
Red denotes areas of intolerable risk, orange and yellow indicate areas where risk reduction measures should be implemented, and green shows areas where risk is broadly acceptable.
Quantitative risk analysis or QRA is a powerful technique for estimating industrial risk, but its application is complex and time consuming. A well-accepted framework for QRA exists, as well as specific tools for its practical implementation (e.g., Uijt de Haag and Ale, 1999; Delvosalle et al., 2004). QRA aims at assigning numbers to the likelihood and the consequences of a failure case, while at the same time considering the totality of all possible events (Cox, 1998). The risk estimate is then commonly represented as individual risk or societal risk (F–N curves), examples of which are shown in Figs. 7.1 and 7.2.
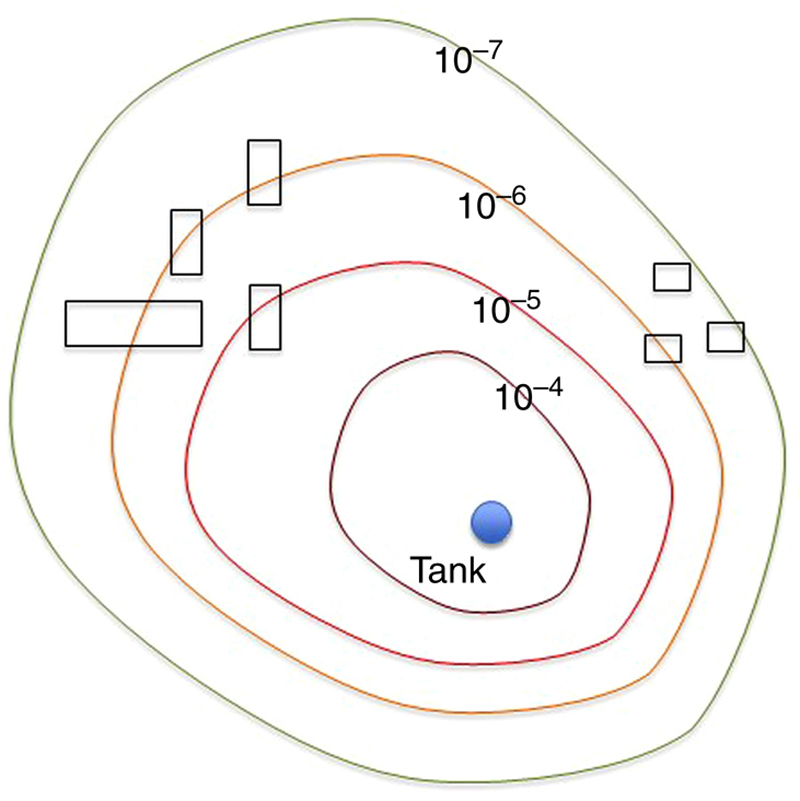
Figure 7.1 Example of Isorisk Curves Showing the Individual Risk Around a Tank Containing a Hazardous Substance

Figure 7.2 Example of a Societal Risk Curve
Individual risk is the probability for an individual to suffer ill effects (e.g., death or injury) at a specific point around a hazardous facility per given time period (Christou, 1998a). Connecting the points for which the individual risk has the same value yields so-called isorisk curves or individual risk contours. These curves are independent of the population density around the hazardous installation. Where a group of people is at risk from an industrial activity the risk indicator of choice is societal risk. F–N curves plot the cumulative frequency (F) of different accident scenarios against the number (N) of potential casualties— usually fatalities—associated with these scenarios. It is important to note that in F–N curves N represents the number of casualties that could be equalled or exceeded. Since the calculation of F–N curves requires consideration of all potential accident scenarios, it is a resource-intensive exercise (HSE, 2009). The Center for Chemical Process Safety of the American Institute of Chemical Engineers has issued detailed guidelines on quantitative risk analysis for the chemical process industry (CCPS, 2000).
Like other methods for risk analysis, QRA is subject to a number of limitations, many of which arise from uncertainty in the input data or lack thereof, the used models, and the quality of the analysis. A lack of skilled human resources and time can also negatively impact the QRA. These limitations must be understood and considered when using QRA for decision-making purposes.
Regardless of the approach chosen, extensions to both qualitative and quantitative risk analyses need to be made to take into account the characteristics of Natech events. Time constraints and data availability permitting, the quantitative methodology is preferable to a qualitative approach. Therefore, in the following sections we will discuss a quantitative methodology for Natech risk analysis.
7.3. The Natech Risk–Assessment Process
The conventional QRA process lends itself to Natech risk assessment. This requires the extension of the QRA methodology to include specific equipment damage models and consideration of the possibility of simultaneous loss-of-containment events at several units, an important characteristic of Natech accidents in general. Simple damage models are available for a limited number of equipment categories (storage tanks, some types of process equipment) and in particular for earthquake impact. Inclusion of these damage models in QRA case studies clearly showed the importance of considering earthquake-triggered accident scenarios for ensuring the safety of the facility itself and the surrounding population and environment (Antonioni et al., 2007). Therefore, natural hazards can be important risk contributors at hazardous facilities and must be adequately considered in the risk-analysis process.
7.3.1. Input
Natech risk assessment requires a significant amount of input information to evaluate the interaction of the natural hazard with the industrial system, as well as its possible consequences. The following list provides an overview of the data specifically required for seismic Natech risk analysis. It is, however, equally applicable to Natech risk analysis in general (Antonioni et al., 2007; Krausmann et al., 2011a):
1. natural-hazard severity parameters [e.g., peak ground acceleration (PGA), which is the most commonly used proxy for describing an earthquake’s severity and damage potential, peak ground velocity, peak ground displacement, etc.];
2. target equipment (usually the highest priority would be given to the most dangerous equipment categories both in terms of type and quantity of hazardous substances processed or stored and the equipment’s operating conditions);
3. damage states (the earthquake severity needs to be related to the damage intensity; this can be achieved by lessons-learned type studies of past accidents or using numerical modeling);
4. equipment damage models (probit models or fragility curves which relate the damage intensity to the associated probability);
5. consequence-analysis models [these models estimate the consequences of a LOC, e.g., in terms of substance concentrations (toxic release), heat radiation (fires), or overpressure (explosions)];
6. likelihood estimates (frequencies, probabilities, or qualitative likelihood estimates for all possible event combinations);
7. information on risk receptors (e.g., population distribution around the hazardous installations).
Empirical equipment damage models were developed or are under development, partly based on the analysis of past accident data (Salzano et al., 2003; Campedel et al., 2008; Antonioni et al., 2009). The lack of detailed equipment damage models is the main limitation of the methodology and a significant source of uncertainty. Further work in this direction is therefore required. This will also decrease data and model uncertainties inherent in the analysis.
Some natural hazards, for example, a strong earthquake or flood causing a Natech accident are likely to simultaneously down on- and off-site lifelines and utilities required for accident prevention and mitigation. The loss of utilities can either trigger the Natech accident in the first place, or hamper emergency-response actions to mitigate its consequences. Therefore, a worst-case risk-analysis approach seems warranted in which the failure of internal and external safety and mitigation measures is assumed in the QRA scenario-building process.
7.3.2. Hazard Identification and Consequence Analysis
The general framework for industrial risk assessment outlined in Section 7.2 is equally valid for Natech risk assessment. However, the conventional QRA procedure needs to be extended to accommodate the characteristics of Natech accident scenarios. Hence, specific damage models to assess the severity and probability of equipment damage due to a natural event, and a procedure to account for the possibility of simultaneous hazardous-materials releases from more than a single process or storage unit are required (Krausmann et al., 2011a).
The flowchart in Fig. 7.3, which was adapted from Antonioni et al. (2007), shows the principal steps in the quantitative analysis of seismic Natech risk. This methodology is also applicable to the analysis of Natech risk due to any other type of natural-event trigger. The starting point in the analysis of seismic Natech risk is the characterization of the natural hazard in terms of severity and frequency at the location of the hazardous installation (Step 1) and the identification of the target equipment (Step 2). Information on the PGA is easily available from measurements or historical records, and PGA is therefore practical for characterizing the severity of the ground motion (Campedel et al., 2008). Probabilistic seismic hazard analysis (PSHA) can be used to estimate the occurrence probability of an earthquake with a given intensity at a specific location. For the analysis of flood Natech risk, information from flood hazard maps prepared by government authorities, or reports and anecdotal information on past inundations could be used to characterize the flood severity in terms of water height, speed, and duration (Krausmann, 2016).
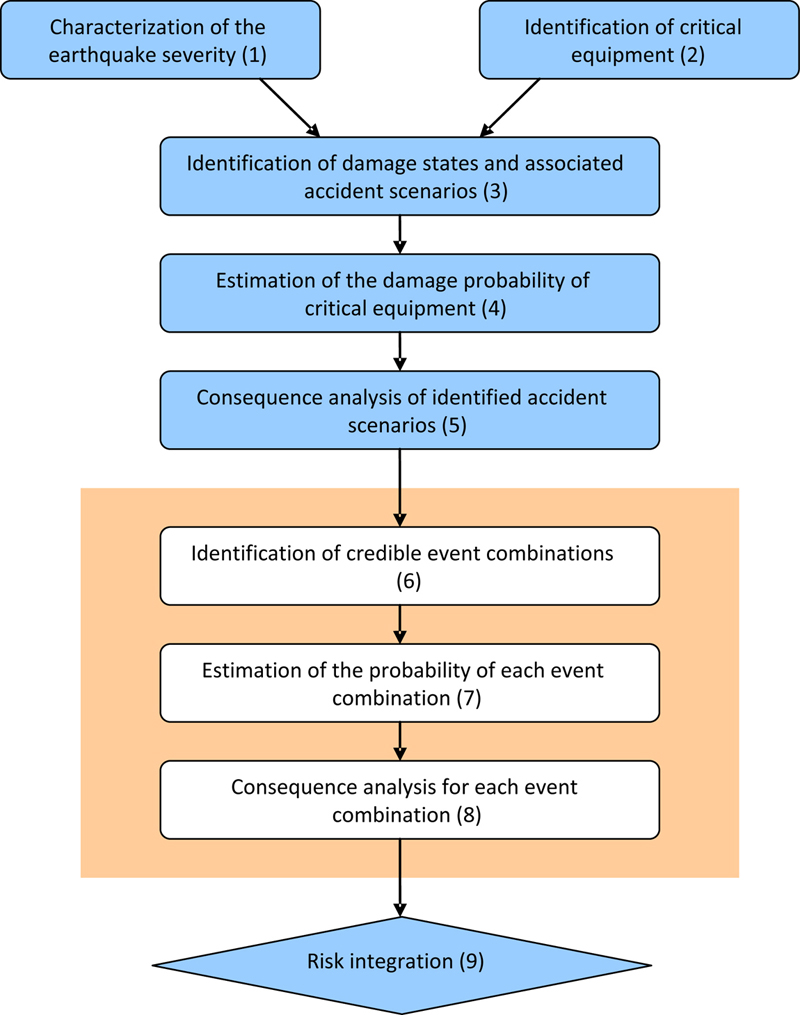
Figure 7.3 Flowchart Showing the Procedure for Seismic Natech Risk Analysis Adapted from Antonioni et al. (2007).
The natural-hazard scenarios on which the risk analysis is to be based are often determined by the regulator which may require protection of a hazardous installation against specific natural-hazard levels (e.g., a 100-year flood or an earthquake with 475 years return period). The operator can decide to voluntarily ramp up safety levels above minimum requirements, and operators that have already been affected, for example, by floods, recommend using worst-case natural-hazard scenarios in the site’s external hazard identification.
The target equipment that poses the greatest safety risk can be identified based on evidence of its involvement in past Natech accidents, determined from chemical- accident database analyses (Sengul, 2005; Krausmann et al., 2011b; Santella et al., 2011) and the criticality in case of LOC. The latter is defined by the equipment’s operating conditions in terms of temperature and pressure and the amount and type of substance it contains. These factors, together with the extent of damage suffered by a piece of equipment due to earthquake loading or impact by another type of natural hazard, also influence the accident scenarios which can develop following a LOC event.
Once the target equipment has been identified, the possible damage caused by a natural hazard has to be associated with it. Detailed earthquake damage models are available for certain types of equipment, for example, storage tanks, from structural-engineering applications. Use of these models is, however, not practicable for assessing the risk to a chemical complex with its many units and structures. Following the approach used in HAZUS (FEMA, 2003), the damage to a piece of equipment can be approximated by defining a limited number of discrete damage states DS (Step 3). These damage states are then used to calculate the expected severity of LOC. Depending on the application, a different number of damage states can be applied. Antonioni et al. (2007) use two damage states, where DS1 indicates limited structural damage with a partial loss of vessel inventory or entire loss in a time interval higher than 10 min, and DS2 indicates extended structural damage with complete loss of inventory in less than 10 min. On the other hand, Salzano et al. (2003) define three damage states with DS1 and DS2 denoting minor and relevant structural damage, respectively, and DS3 corresponding to total structural collapse. In order to describe the severity of release they then associate three so-called risk states with these damage states (minor and relevant release, loss of complete inventory). Other damage and risk states can be defined.
The accident scenario(s) following LOC depend on the substance hazard and the extent of release, which is defined by the magnitude of the LOC (small or big hole) and the storage or operating conditions. For instance, even if the damage severity is the same, releases from pressurized equipment could have very different consequences than discharges from vessels kept at atmospheric pressure. The quantity and conditions of the released substance can be determined using source-term models. Once the LOC severity is known, event trees can be applied to identify the final outcomes of the scenarios of a specific damage mode (e.g., pool fire, jet fire, toxic dispersion, vapor cloud explosion, etc.). Specific event trees, derived from the analysis of past Natech accidents, should be used to consider the dynamics of Natech events (Cozzani et al., 2010; Renni et al., 2010). Although a realistic Natech risk analysis would also require an assessment of the natural-hazard impact on existing protection measures, Antonioni et al. (2007) recommend disregarding prevention and mitigation measures as they would likely be damaged by the earthquake and therefore not be available.
The probability of a target equipment to suffer a specific extent of damage as function of the earthquake severity (e.g., PGA) can be estimated from fragility curves or using so-called probit functions (Finney, 1971; Vílchez et al., 2001), with both approaches being equivalent (Step 4). Although some fragility information for typical chemical storage and processing equipment is available (e.g., Kiremidjian et al., 1985; Seligson et al., 1996; Salzano et al., 2003; Fabbrocino et al., 2005; Di Carluccio et al., 2006), probit functions are more widely used in industrial quantitative risk analysis. The probit variable PrDS is a function of the PGA and can be easily converted into the equipment damage probability PDS for a specific damage state DS (Finney, 1971):
The frequency of the accident scenario associated with specific equipment damage is then calculated by multiplying the frequency of an earthquake of a given PGA value with PDS. Campedel et al. (2008) provide a list of the probit coefficients k1 and k2 for different types of equipment based on empirical data. The probit coefficients also depend on the existence of implemented safety measures (e.g., anchoring of equipment) and the filling level which determines the criticality of liquid-sloshing effects due to the earthquake forces (Ibrahim, 2005). The lack of detailed equipment damage models linking damage states to probabilities is at present one of the main limitations of the proposed analysis methodology.
The consequences of the final outcomes of an accident scenario can be assessed using conventional consequence models (Step 5). They include not only dispersion, fire, and explosion models, but also effects models including probit functions that allow the calculation of the impact of overpressure, heat radiation, and toxic effects on the population (e.g., van den Bosch and Weterings, 1997; CCPS, 2000). A brief synopsis of consequence-analysis models is provided in Section 7.3.2.1.
For some Natech accidents there is a high likelihood that several chemical process or storage units are damaged simultaneously by the natural hazard and hence more than one accident scenario will occur. This is taken into account in Steps 6–8 where the event combinations are identified, and their frequencies and consequences evaluated. The overall consequences of the combined scenarios can then be derived by summing up the results, for example, human health impact for each single accident scenario. The calculation of the overall frequency of the identified combinations of scenarios is presented in detail in Antonioni et al. (2007). In the last step (9) the risk from the identified accident scenarios is estimated and visualized as individual risk or F–N curves.
7.3.2.1. Consequence-Analysis Models
Although it is beyond the scope of this book to provide a detailed discussion of consequence-analysis models, a brief introduction to the subject is beneficial for the overall understanding of the risk-analysis process. Christou (1998b) provides a generic but concise overview of the most common phenomena and the associated models used in the analysis. van den Bosch and Weterings (1997) give a more detailed description of available models and the conditions under which they should be used.
The analysis of the consequences of a loss-of-containment event crucially depends on the source term, that is, the quantity and the conditions of the hazardous-materials release. Discharge models are readily available and provide the amount and rate of substance outflow, the duration of the discharge, and the phase of the release (liquid, gas, or two-phase).
If the substance is discharged into the atmosphere, dispersion models are applied to model the behavior of the formed substance cloud. Depending on the properties of the released gas (lighter or heavier than air), specific models are used. For atmospheric dispersion modeling, meteorological conditions at the time of substance release (wind speed and direction, temperature, humidity, pressure, and air stability class) and the site topography are relevant. Dispersion models provide information on the substance concentration as a function of location and time.
When flammable substances are released there is a risk of ignition. Depending on the process or storage conditions, pool fires (substances at atmospheric pressure) or jet fires (pressurized substances) can result. The associated fire models calculate the thermal flux (heat radiation) emanating from the fires. If a fire ignites close to pressurized equipment, the heating of the substance and the subsequent increase in pressure inside the unit can cause a mechanical explosion, destroying the unit. This boiling liquid expanding vapor explosion (BLEVE) releases the full substance content of the affected unit instantaneously. Of importance for analyzing the consequences of a BLEVE are the formation of a fireball (thermal radiation) and the generation of projectiles. An unconfined vapor cloud explosion (UVCE) is usually the product of delayed ignition of a discharged flammable substance. If a flammable vapor cloud finds no immediate ignition source upon release, the cloud is dispersed with the wind and can ignite at a later stage. Of concern with respect to UVCEs is the formation of a rapidly moving pressure wave and the associated effects of overpressure on risk receptors.
In industrial risk assessment, vulnerability models aim to estimate the response of risk receptors (e.g., in terms of health effects) to toxic concentration, heat radiation, and overpressure from shock waves. Due to the different response behavior of individuals in particular to toxic exposure, vulnerability assessment is affected by significant uncertainty. Toxic-effects models are based on laboratory experiments which are then extrapolated to humans (definition of threshold concentration or dose for death and injury). For the impact of heat from fires, radiation intensities and the associated expected effects on the population and structures are defined [e.g., 37.5 kW/m2 is sufficient to cause damage to process equipment (Christou, 1998b)]. For explosions, shock wave overpressure models are used. Probit functions also lend themselves to the assessment of all aforementioned effects.
7.3.2.2. Cascading Effects
Industrial installations are often grouped into large integrated clusters due to economic reasons, environmental factors, legal requirements, or social issues. Every installation in such an industrial park represents a danger to the other facilities in the neighborhood depending on the amount and type of hazardous substances processed, handled, or stored, and the associated process or storage conditions. If an accident occurs in one of these installations there is therefore the risk of a domino or cascading effect, that is, a propagation of the accident within the same plant or to one or more neighboring installations due to knock-on effects. This could lead to an escalation of the primary accident with consequences on potentially extended areas of the industrial park (Reniers and Cozzani, 2013). For Natech accidents, the risk of a cascading effect is particularly high due to the potentially multiple and simultaneous hazardous-materials releases over extended areas, and the loss of lifelines needed for accident prevention and mitigation (Chapter 3).
The direct causes of cascading or domino effects are blast waves, fires, or the projection of fragments caused by a primary accident with equipment damage and the subsequent LOC of hazardous substances. Cozzani et al. (2013) argue that also indirect effects can lead to a domino accident. The release of hazardous materials would in this case not be triggered by direct equipment damage but rather via, for example, loss of process control due to damage to the control room, or structural damage to and collapse of buildings housing hazardous equipment. Loss of cooling or power fluctuations can also lead to process upsets and LOC (Section 2.6).
A significant number of domino accidents occurred in the past and with their consequences being severe, European legislation on the control of major accident hazards involving dangerous substances explicitly addresses this type of risk. The Seveso Directive requires the identification, assessment, and control of domino risks for all establishments covered by the Directive (Section 4.1.1). This also includes the requirement that concerned operators exchange suitable information that allows them to take appropriate measures to control the domino risk. Appropriate safety distances between hazardous equipment, thermal insulation of units to protect them against heat impingement from adjacent fires, or emergency water deluges are some preventive measures that can be taken to address domino risks (Mecklenburgh, 1985). Consolidated methodologies and tools for the identification of domino risks and for GIS-supported quantitative domino risk assessment are available (Khan and Abbasi, 1998; 2001; Cozzani et al., 2005; 2006).
For an in-depth treatment of the identification and assessment of domino scenarios in the process industries, both from a safety and security context, the reader is referred to Reniers and Cozzani (2013).
7.3.3. Risk Integration and Evaluation
For risk integration the most commonly used indicators are individual risk and societal risk. The numerical outcome of a quantitative risk analysis is not an accurate number but invariably contains uncertainties introduced during the various steps of the analysis process which can be up to one order of magnitude. The sources of these uncertainties can be grouped into uncertainties in models, input data and in general analysis quality, and range from outdated failure rates to errors in consequence modeling and omissions in the identification and characterization of all relevant hazards (Cox, 1998; CCPS, 2000). They do not render the analysis and its results invalid. However, end users have to be aware of the existence of uncertainties when making decisions based on risk estimates. CCPS (2000) provides an exhaustive list of sources of uncertainty in the risk-analysis process.
Risk analysis can be used in several ways to improve the safety of a hazardous installation. It helps identify system weaknesses, provides input for the setting of risk-reduction priorities, or quantifies the improvement achieved by the implementation of targeted risk-reduction measures for optimizing expenditures. Alternatively, the outcome of risk analysis feeds into the decision-making process by providing risk estimates that can be used for comparison with risk criteria that need to be complied with to fulfill regulatory requirements. This step in the risk-assessment process is also referred to as risk evaluation.
Although the analysis of risk is a rather scientific task, the management of the resulting risk involves a great deal of consultation and negotiation between all stakeholders. This includes decisions on which types of risk and associated risk levels are acceptable or tolerable and which are not. In this context, acceptable and tolerable are not identical. Instead, “tolerable” refers to the willingness of society to tolerate certain risks as long as the benefit outweighs the risks (HSE, 2001). Moreover, in most legal frameworks for chemical-accident prevention proof needs to be given that the risk associated with a hazardous activity is controlled. This includes the identification and implementation of adequate risk-reduction measures.
There are several methods to judge whether a specific risk level is sufficiently low. A cost-benefit analysis expresses the residual risk in terms of monetary value. The term “as low as reasonably practicable (ALARP)” defined in the United Kingdom indicates an approach that avoids risk reduction that would incur grossly disproportionate costs (Cox, 1998). Other possibilities to judge whether a risk is acceptable are expert judgment or prescriptive numerical risk targets or criteria. In addition to the regulatory regime and the political context, the definition of these absolute risk criteria strongly depends on society’s attitude toward hazards.
Practically, there is a general framework that defines three levels of risk as illustrated in Fig. 7.4 (HSE, 2001). In the top zone risk is unacceptable and must be reduced at any cost. Risks falling into the zone at the bottom are considered negligible and usually no further risk-reduction actions are required. The tolerable risk zone would then lie in between these boundary levels. This area is subject to proper risk assessment and the implementation of risk-control measures to achieve risk levels that are as low as practicable.

Figure 7.4 Carrot Diagram Representing the Framework for Risk Acceptance (
HSE, 2001) ©Crown Copyright.
HSE, 2001) ©Crown Copyright.
In the European Union (EU) there are no uniform risk criteria as safety approaches (probabilistic, deterministic) vary across its Member States. Some countries have developed risk-based criteria, defining acceptable levels of risk, while others specify consequence-based criteria which establish maximum permissible levels of overpressure, heat radiation, or toxic concentration. Based on the risk criteria used in selected EU Member States, Trbojevic (2005) suggests a set of common criteria for individual risk. In his proposal the boundary for unacceptable individual risk is set to 10−5 events per year while negligible risk is 10−8 per year. The target level for individual risk within the tolerable risk zone should be 10−6 per year.
The decision about the acceptability of risk must take both individual risk and societal concerns into account. Developing criteria for the risk of multiple fatalities in one accident is, however, difficult and only few countries have defined numerical values which are either prescriptive or used as nonlegal orientation norms. As an example, in the Netherlands the expected frequency of accidents involving more than 10 fatalities must not exceed 10−5 per year, while for accidents with more than 100 deaths the frequency must not be greater than 10−7 per year (Duijm, 2009).
..................Content has been hidden....................
You can't read the all page of ebook, please click here login for view all page.