Repurposing Big Data
Abstract
Big Data resources are expensive and can cost millions or even hundreds of millions of dollars to create and maintain. Not surprisingly, every Big Data resource is built with a specific purpose in mind. Nonetheless, creative individuals have a history of using data resources for purposes that were unimagined when the resource was originally conceived. In this chapter, we discuss the value of Big Data repurposing and provide examples wherein repurposing has led to important advances for science and society.
Keywords
Data repurposing; Abandoned data; Legacy data; Retrospective data; Observational studies
Section 17.1. What Is Data Repurposing?
If you want to make an apple pie from scratch, you must first create the universe.
Carl Sagan
Big Data resources are so very difficult to create and maintain that they really should not be devoted to any single use. We might as well get the most for our investments, and this means that we should repurpose our data. Data repurposing involves taking pre-existing data and performing any of the following [1]:
Fingerprints have been used, since antiquity, as a method for establishing the identity of individuals. Fingerprints were pressed onto clay tablets, seals, and even pottery left by ancient civilizations that included Minoan, Greek, Japanese, and Chinese. As early as the second millennium BCE, fingerprints were used as a type of signature in Babylon, and ancient Babylonian policemen recorded the fingerprints of criminals.
Toward the close of the 19th century, Francis Galton repurposed fingerprint data to pursue his own particular interests. Galton was primarily interested in the heritability and racial characteristics of fingerprints, a field of study that can be described as a scientific dead-end. Nonetheless, in pursuit of his interests, he devised a way of classifying fingerprints by patterns (e.g., plain arch, tented arch, simple loop, central pocket loop, double loop, lateral pocket loop, and plain whorl). This classification launched the new science of fingerprint identification, an area of research that has been actively pursued and improved over the past 120 years (Fig. 17.1).

In addition to Galton's novel classification methods, two closely related technological enhancements vastly increased the importance of fingerprints. The first was the incredibly simple procedure of recording sets of fingerprints, on paper, with indelible ink. With the simple fingerprint card, the quality of fingerprints improved, and the process of sharing and comparing recorded fingerprints became more practical. The second enhancement was the decision to collect fingerprint cards in permanent population databases (literally, digital data). Fingerprint databases enabled forensic scientists to match fingerprints found at the scene of a crime, with fingerprints stored in the database. The task of fingerprint matching was greatly simplified by confining comparisons to prints that shared the same class-based profiles, as described by Galton.
Repurposing efforts have expanded the use of fingerprints to include authentication (i.e., proving you are who you claim to be), keying (e.g., opening locked devices based on an authenticated fingerprint or some other identifying biometric), tracking (e.g., establishing the path and whereabouts of an individual by following a trail of fingerprints or other identifiers), and body part identification (i.e., identifying the remains of individuals recovered from mass graves or from the sites of catastrophic events). In the past decade, flaws in the vaunted process of fingerprint identification have been documented, and the improvement of the science of identification is an active area of investigation [2].
Today, most of what we think of as the forensic sciences is based on object identification (e.g., biometrics, pollen identification, trace chemical investigation, tire mark investigation, and so on). When a data object is uniquely identified, its association with additional data can be collected, aggregated, and retrieved, as needed.
History is replete with examples of old data driving new discoveries. A recent headline story explains how century old tidal data plausibly explained the appearance of the iceberg that sank the titanic, on April 15, 1912 [3]. Records show that several months earlier, in 1912, the moon, Earth, and sun aligned to produce a strong tidal pull, and this happened when the moon was the closest to the earth in 1400 years. The resulting tidal surge was sufficient to break the January Labrador ice sheet, sending an unusual number of icebergs toward the open North Atlantic waters. The Labrador icebergs arrived in the commercial shipping lanes four months later, in time for a fateful rendezvous with the Titanic. Back in January 1912, when tidal measurements were being collected, nobody foresaw that the data would be examined a century later.
Clever scientists are finding that old data can be reanalyzed to answer questions that were not anticipated by the scientists who performed the original study. Getting new uses from old data is the most cost-effective means of conducting research, and should be encouraged [1]. [Glossary Data archeology]
Introspective data, data triples, and data schemas are concepts that had little resonance before the days of Big Data. Using techniques that link heterogeneous forms of data to Web Locations is the basis for the so-called Semantic Web, the largest Big Data resource available to everyone [4]. The Semantic Web can be imagined as one enormous data re-purposing project in which everyone pursues their own purposes. [Glossary Heterogeneous data]
For data professionals, repurposing will often involve one or more of the following efforts:
Section 17.2. Dark Data, Abandoned Data, and Legacy Data
We need above all to know about changes; no one wants or needs to be reminded 16 hours a day that his shoes are on.
David Hubel
Every child believes, for a time, that the universe began with his own birth. Anything preceding his birth is unreal, and of no consequence. Many Big Data resources have a similar disregard for events that preceded their birth. If events occurred prior to the creation of the Big Data resource, then those events have no consequence and can be safely ignored. Of course, this is absurd. It is accurate to think of new data as the result of events that involved old data; nothing in the universe occurs in the absence of preceding events.
Today, a large part of data science is devoted to finding trends in data; determining the simple functions that model the variation of data over time, and predicting how data will change in the future. These analytic activities require prior data that is annotated with a time measurement. Analysis of such data often reveals long-term trends, short-term trends, and periodic trends, often with characteristic forms (e.g., linear, exponential, power series). Hence, new data has very little meaning when it is not interpreted along with old data.
It is a shame that legacy data gets such shabby treatment by Big Data creators. Old data often resides in obsolete formats, on obsolete media, without proper annotation, and is collected under dubious circumstances. The incorporation of legacy data into modern Big Data resources is a tall order, but we need to make an effort to save legacy data whenever possible. Managers of Big Data resources are often expected to absorb smaller, older data sets. We cannot just pretend that such data has a lesser role than new data.
The healthcare industry is a prime example of Big Data in search of a legacy. President Barack Obama had set a goal for every American to have a secure medical record. What might such records include? Let us consider the medical record for a hypothetical patient named Lily Livesy, age 92. Not only has Lily outlived her doctors; she has outlived most of her hospitals. Though she lived in one city all her life, several of the hospitals that administered her medical care have been closed, and the records destroyed. In the past thirty years, she has received medical care at various doctor's offices, and in various departments in various hospitals. Some of these hospitals kept paper records; some had electronic records. Only one of the hospitals had anything that might be likened to an integrated hospital information system that aggregated transaction records produced by the various hospital departments (pharmacy, pathology, radiology, surgery, medicine, and so on). This hospital initiated a new Electronic Health Record system in the year 2013. Unfortunately, the new system is not compatible with the same hospital's prior information system, and the old records did not transfer to the new system. Consequently, in the year 2019, Lily Livesy, age 92, has one Electronic Health Record, residing in one hospital's information system, with no contribution from any other medical facility, and this Electronic Health Record contains a secure identifier, but no actual medical information. Her 92 year-long medical history is virtually blank. The same data deficits would apply to millions of other Americans. This is why, despite our best intentions, complete medical records, extending from birth to death, for all American citizens, will not be attainable anytime this century.
Often, the utility of legacy data comes as an afterthought inspired by a preliminary analysis of contemporary data. If a cancer researcher notices that the incidence of a certain tumor is high, he or she would naturally want to know whether the incidence of the tumor has been increasing over the past five years, ten years, 15 years and so on. A forensic criminologist who collects a CODIS signature on a sample of DNA might desperately need to check his sample against CODIS signatures collected over the past five decades. The most useful Big Data resources reach back through time. [Glossary CODIS]
Legacy data plays a crucial role in correcting the current record. It is not unusual for people to rely on flawed data. If we knew the full history of the data, including how it was originally collected, and how it was modified over time, we might avoid reaching erroneous conclusions. Several years ago, newspaper headlines drew attention to a modern manual for prisoner interrogation, used by U.S. forces stationed in Guantanamo. It turned out that the manual was a republication of a discredited Chinese operations manual used during the Korean War. The chain of documentation linking the current manual back to the original source had been broken [5]. In another example of lost legacy data, a Supreme Court decision was based, in part, on flawed information; an earlier statute had been overlooked [6]. Had the legacy data been raised during deliberations, an alternate Supreme Court verdict may have prevailed. To know the history of a data source, we need access to the legacy data that documents the original sources of our data, and permits us to trace the modifications of the data, over time.
It is human nature to evaluate the world through direct observations. If we want to know the length of an object, we measure its length with a ruler. If we want to know the number of eggs in a basket, we count the eggs. There are times when direct observations are not the best way to understand our world. If we are clever, we can determine the height of an object by comparing the length of its shadow, with the length of the shadow of an object of known height. We can estimate the number of eggs in a basket by weighing the basket, with and without the eggs, and dividing the total weight of the eggs by the predetermined average weight of a single egg. When we have a wealth of descriptive data about many different objects in our environment, we can derive new meaning from old measurements. The remainder of this chapter is devoted to five cases in point.
Section 17.3. Case Study: From Postal Code to Demographic Keystone
When you get to a fork in the road, take it.
Yogi Berra
There are three ways to assign integers to objects: cardinals, ordinal, and nominals. Cardinals tell us the number of objects (e.g., 2, 5, or ten items). Ordinals give us a rank (e.g., 1st, or 5th, or 8th place in a list). Nominal means “in name only”, and nominals are arbitrary numbers that help identify an object. Telephone numbers, social security numbers, and zip codes are nominals. Nominals can be added together or multiplied, and divided, but it would be pointless to do so. Despite its self-effacing definition and its limited mathematical utility, nominal data sets are among the most useful of legacy data resources [1].
Zip codes were contrived by the U.S. Postal service to speed the distribution of mail. The original 5-digit zip codes were introduced in the early 1960s, with each zip code representing a geographic area containing a roughly equivalent segment of the population. The first three digits of the zip code identify mail distribution centers, from which mail sorted by the remaining two digits is distributed to the proper post offices. In the 1980s, an additional 4 digits was appended to the zip code, identifying individual buildings within the boundary of the 5-digit code.
Because zip codes describe geographic and demographic areas, they can be assigned a longitude, latitude, and elevation, typically measured at the geographic center of its boundaries. All data to which a zip code is attached (e.g., addresses, charge card transactions, crime reports, occurrences of reportable diseases, deaths, electricity consumption, water resources, homes receiving cable television, broadband usage) can be organized with the zip code serving as its primary record key. The lowly zip code, intended as an aid to mailmen, has been repurposed to serve entrepreneurs, epidemiologists, resource managers, and many others.
Section 17.4. Case Study: Scientific Inferencing From a Database of Genetic Sequences
It [natural selection] is all about the survival of self-replicating instructions for self-replication.
Richard Dawkins [7]
With the exception of identical twins, parthenogenetic offspring, and clones, every organism on earth has a unique sequence of DNA-forming nucleotides that distinguishes its genetic material (i.e., it's genome) from the genome of every other organism. If we were to have a record of the complete sequence of nucleotides in an individual's genome, we could distinguish that individual from every other organism on earth, by comparing genome sequences. This would require a lot of digital storage for every organism. In the case of humans, the genome is 3 billion nucleotides in length. As luck would have it, because there is enormous variation in genome sequence, from individual to individual, the identity of human individuals can be established by sampling short segments of DNA [1].
CODIS (Combined DNA Index System) collects the unique nucleotide sequences of the equivalent 13 segments of DNA, for every individual included in the database [8]. Using CODIS, DNA sampled at a crime scene can be matched against DNA samples contained in the database. Hence, the identity of individuals whose DNA is found at a crime scene can often be established. In the absence of a match it is sometimes possible to establish the genetic relationship (i.e., paternal or maternal relatives) between crime scene samples and individuals included in the database.
CODIS serves as an example of a database with narrow scope (i.e., names of people and associated DNA sequences), and broad societal value. The basic design of the CODIS database can be extended to any organism. For example, a database of DNA samples collected from individual trees in a geographic location can establish the source of seeds or pollen grains sticking to an article of clothing, and this information might lead to the location where a criminal event transpired. A population database containing full genome DNA sequences could be used to determine the presence or absence of disease-causing genes in individuals or to predict the response of an individual to a particular drug [9–12].
Section 17.5. Case Study: Linking Global Warming to High-Intensity Hurricanes
You can observe a lot by watching.
Yogi Berra
The UK Hadley Centre maintains a database of sea surface temperatures, over a 5-degree latitude-longitude global grid, from the year 1850, to the present, and updated monthly [13]. This data tells us how the ocean temperature changes seasonally and geographically, over time. Kerry Emanuel found a new use for the Hadley data when he noticed an association between regionally increased ocean temperatures and particularly strong hurricanes spawned in these same regions. Reviewing 50 years of data, Emanuel confirmed that the intensity of hurricanes increased in step with the warming of the North Atlantic and Pacific oceans [14]. A data set, intended primarily for charting trends in water temperature and correlating those trends with the oceanic reach of sea ice, found a new use: forecasting the intensity of hurricanes [1].
Section 17.6. Case Study: Inferring Climate Trends With Geologic Data
We waste a lot of time waiting for spectacular new material. We haven't sat down and taken a very close look at the material we have.
Bettina Stangneth, historian and author of “Eichmann Before Jerusalem: The Unexamined Life of a Mass Murderer” [15]
Mountains are like icebergs made of rock. The bulk of a mountain is buried underground. When the top of the mountain is eroded, the weight of the mountain is reduced, and the mountain bobs upwards, a little bit. The natural process through which mountains are flattened, over eons, requires the erosion of its surface plus its ever-rising subsurface.
When water is sucked from a mountain, the mountain lightens and rises. Likewise, if the water is sucked out of a tectonic plate, the entire plate (i.e., the surface of the planet overlying the plate) will rise. The National Science Foundation's Plate Boundary Observatory provides precise measurements of ground positions from data generated by GPS (Global Positioning System) satellites. A group of scientists working at the Scripps Institution of Oceanography found that all of the ground stations in the western United States exhibited measurable uplift. In the period 2003–04, the western states rose an average of 0.15 inches, and the western mountains rose more than half an inch in the same period. This wide rise coincides with a long drought in the west. It would seem that the only explanation for the uplift of the tectonic plate, and the greater uplift of the western mountains, is the loss of water, via evaporation, without replacement. So strong is the relationship between water loss and mountain rise that water resources in the west can now be tracked with GPS ground measurements [16,1].
Section 17.7. Case Study: Lunar Orbiter Image Recovery Project
The world is the totality of facts, not things. (Die Welt ist die Gesamtheit der Tatsachen, nicht der Dinge)
Ludwig Wittgenstein
Following the first Apollo mission to the moon (Apollo 11, July 20, 1969), the five subsequent Apollo missions left behind recording instruments on the lunar surface. The collective set of downlinked data received from these instruments in known as the Apollo Lunar Surface Experiments Package (ALSEP). More than 11,000 data tapes were recorded [1].
During the Apollo program, control and use of the tapes, as well as the responsibility to safely archive the tapes, was transferred among various agencies and institutions. When the Apollo mission ended, funds were low, and a portion of the data that had been distributed to various investigators and agencies was never sent to the official archives [17]. It should come as no surprise that, at the present time, about half of the ALSEP tapes are missing; their whereabouts uncertain. Of the available tapes, much of the data is difficult to access, due to the use of abandoned data media (i.e., 7 and 9 track tapes) and obsolete data formats [17].
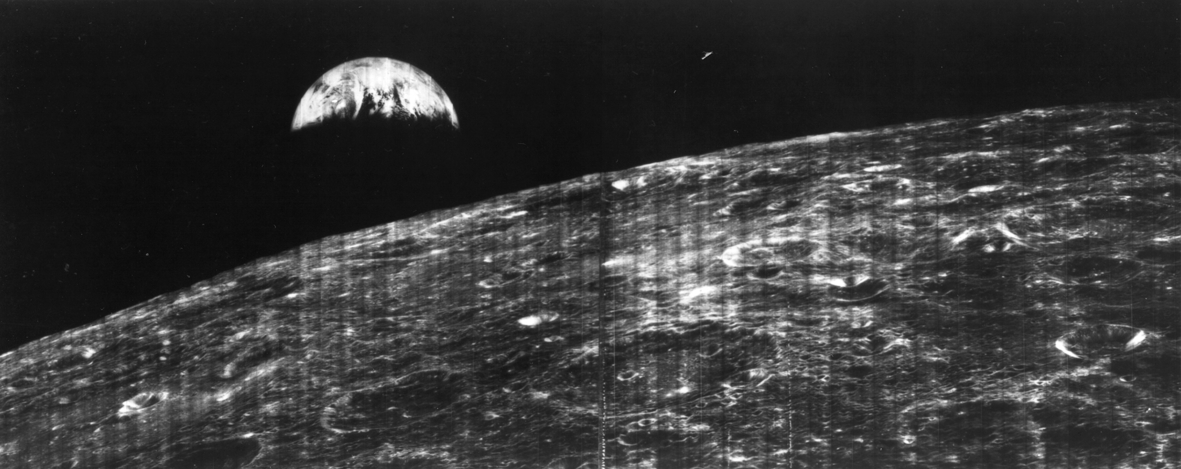
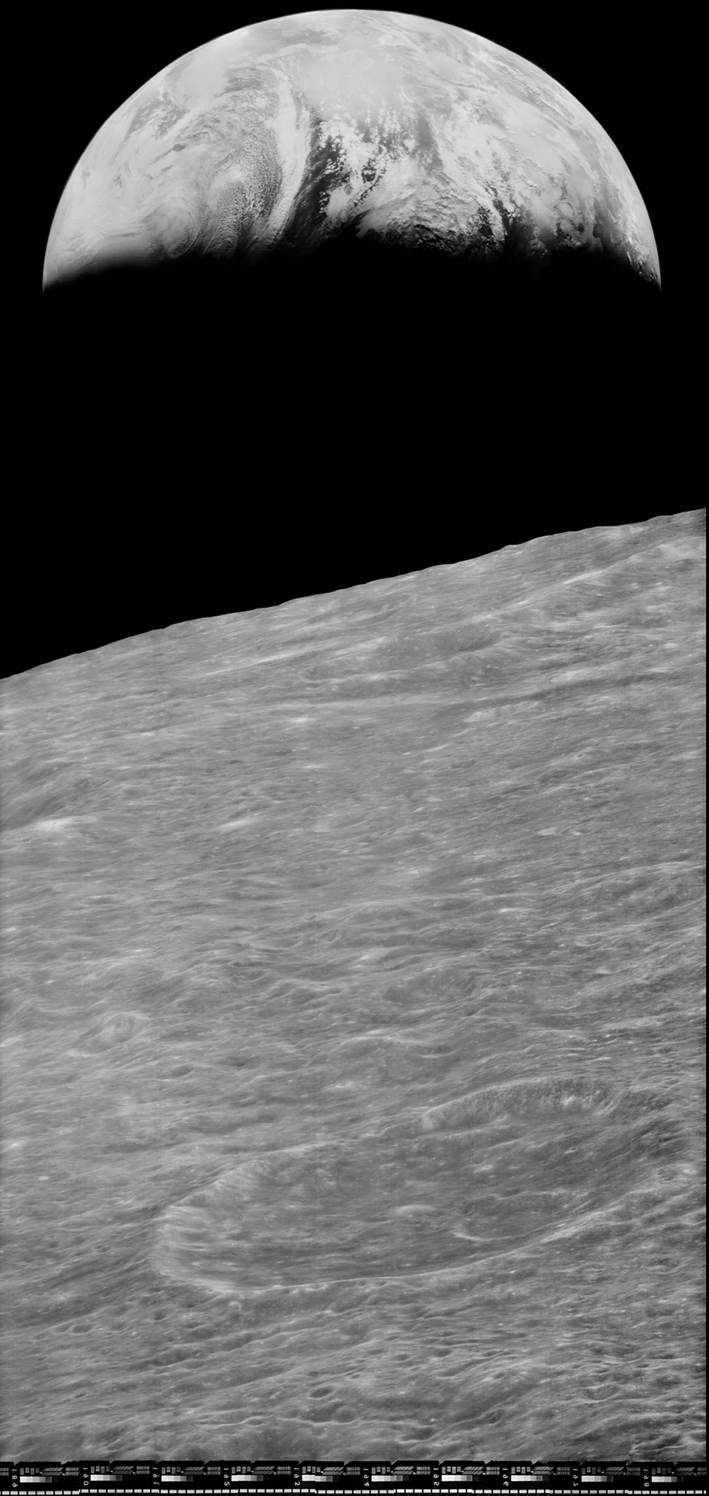
Available ALSEP data, when converted into a modern data format, has proven to be a valuable asset, when reanalyzed with modern analytic tools (Figs. 17.2 and 17.3). For example, the first analyses of ALSEP's seismic data, conducted 35 years ago, indicated that about 1300 deep moonquakes had occurred during the period when the data was being downlinked. The field of seismic analysis has advanced in the interim. A reanalysis of the same data, using modern techniques, has produced an upward revision of the first estimate; to about 7000 deep moonquakes [17].
Today, there is a renewed push to find, collect and archive the missing ALSEP data. Why is there a sudden urgency to finish a chore that should have been completed decades ago? Simply put, the tapes must be restored before the last of the original investigators, who alone understand the scope and organization of the data, vanish into retirement or death.
Glossary
CODIS Abbreviation for Combined DNA Index System. CODIS is a collection of the unique nucleotide sequences of the equivalent 13 segments of DNA, for every individual included in the database [8]. The CODIS database is used by law enforcement personnel and contains identifying DNA sequences for individuals who have been processed within the criminal justice system. DNA obtained at a crime scene can be matched against DNA samples contained in the database. Hence, the identity of individuals whose DNA is found at a crime scene can often be established. In the absence of a match, it is sometimes possible to establish the genetic relationship (i.e., paternal or maternal relatives) between crime scene samples and individuals included in the database.
Data archeology The process of recovering information held in abandoned or unpopular physical storage devices, or packaged in formats that are no longer widely recognized, and hence unsupported by most software applications. The definition encompasses truly ancient data, such as cuneiform inscriptions stored on clay tablets circa 3300 BCE, and digital data stored on 5.25-inch floppy disks in Xyrite wordprocessor format, circa 1994.
Heterogeneous data Sets of data that are dissimilar with regard to content, purpose, format, organization, and annotations. One of the purposes of Big Data is to discover relationships among heterogeneous data sources. For example, epidemiologic data sets may be of service to molecular biologists who have gene sequence data on diverse human populations. The epidemiologic data is likely to contain different types of data values, annotated and formatted in a manner that is completely different from the data and annotations in a gene sequence database. The two types of related data, epidemiologic and genetic, have dissimilar content; hence they are heterogeneous to one another.