Big Data Failures and How to Avoid (Some of) Them
Abstract
Many Big Data projects have ended in disaster: either the resource failed to materialize, or the resource failed to meet its intended goals, or the data in the resource failed to yield solutions, or the solutions achieved with Big Data were incorrect. The failure of Big Data efforts is particularly troublesome due to the huge investments in money, time, and human resources that pour into every Big Data project; and due to the societal reversals that arise when Big Data analyses are wrong (i.e., natural catastrophes, wars, economic collapse, and so on). Aside from the obvious issues of data integrity (i.e., Big Garbage in; Big Garbage out), and of injudicious data analyses, there are a wide assortment of problems that can lead to the demise of any Big Data project. This chapter describes past failures and suggests some simple measures that can increase the Big Data success rate.
Keywords
Big Data failures; Complexity barrier; Redundancy; Gaussian Copula Function; Data security; Approach to data analysis
Section 15.1. Failure Is Common
As a rule, software systems do not work well until they have been used, and have failed repeatedly, in real applications.
Dave Parnas
There are many ways in which a complex system can be broken. In 2000, a Concorde crashed on take-off from Charles de Gaulle Airport, Paris. The Concorde was a supersonic transport jet, one of the most advanced and complex planes ever built. Some debris left on the runway had flipped up and tore a tire and some of the underside of the hull. All passengers were killed.
Big Data resources are complex; they are difficult to build and easy to break. After they break, they cannot be easily fixed.
Most Big Data failures do not result from accidents. Most failures occur when the Big Data resource is never completed, or never attains an acceptable level of performance. What goes wrong? Let us run down the reasons for failure that have been published in blogs, magazine articles and books on the subject of Big Data disappointments: Inappropriate selection and use of human resources (wrong leadership, wrong team, wrong people, wrong direction, wrong milestones, wrong deadlines); Incorrect funding (too little funding, too much funding, incorrect allocation of resources, wrong pay scales, wrong incentives); Legal snags (patent infringements, copyright infringements, inept technology transfer, wrong legal staff, inadequate confidentiality and privacy measures, untenable consent forms, poor contracts with unhelpful non-compete clauses, non-compliance with applicable laws and regulations, inadequate financial records and poor documentation of protocol compliances); Bad data (inaccurate and imprecise data, data obtained without regard to established protocols, data that is not fully specified, un-representative data, data that is not germane to the purpose of the resource), poor data security (purposely corrupted data, data stolen by malevolent entities, data inadvertently copied and distributed by staff, non-compliance with internal security policies, poor internal security policies). The list goes on. Generally, we see failure in terms of our own weaknesses: funders see failure as the result of improper funding; managers see failure as the result of poor management; programmers see deficiencies in programming methods, informaticians see deficiencies in metadata annotations, and so on. The field of Big Data is still young; the most senior members of a Big Data team are little more than newbies, and there's plenty of room for self-doubt. [Glossary Fair use]
It may be useful to accept every imaginable defect in a Big Data project as a potential cause of failure. For convenience sake, these defects can be divided into two general categories: (1) failures due design and operation flaws in Big Data resource, and (2) failures due to improper analysis and interpretation of results. Analytic and interpretive errors were discussed in Chapter 14. This chapter deals with the problems that arise when Big Data resources are poorly planned and operated.
Big Data resources are new arrivals to the information world. With rare exceptions, database managers are not trained to deal with the layers of complexity of Big Data resources. It is hard to assemble a team with the composite skills necessary to build a really good Big Data resource. At this time, all data managers are reflexively acquiring new software applications designed to deal with Big Data collections. Far fewer data managers are coming to grips with the fundamental concepts discussed in earlier chapters (e.g., identifier systems, introspection, metadata annotation, immutability, and data triples). It may take several decades before these fundamental principles sink in, allowing Big Data resources to reach their highest potential.
In the field of hospital informatics, costs run very high. It is not unusual for large, academic medical centers to purchase information systems that cost in excess of $500 million. Bad systems are costly and failures are frequent [1–3]. About three quarters of hospital information systems are failures [4]. Successfully implemented electronic health record systems have not been shown to improve patient outcomes [5]. Based on a study of the kinds of failures that account for patient safety errors in hospitals, it has been suggested that hospital information systems will not greatly reduce the incidence of safety-related incidents [6]. Clinical decision support systems, built into electronic health record systems, have not had much impact on physician practice [7]. These systems tend to be too complex for the hospital staff to master and are not well utilized.
The United Kingdom's National Health Service embarked on a major overhaul of its information systems, with the goal of system-wide interoperability and data integration. After investing $17 billion dollars, the project was ditched when members of Parliament called the effort “unworkable” [8–10].
It is difficult to determine the failure rate of Big Data projects. Organizations herald their triumphs but hide their misadventures. There is no registry of Big Data projects that can be followed to determine which projects fail over time. There is no formal designation “Big Data project” that is bestowed on some projects and withheld from others. Furthermore, we have no definition for failure, as applied to Big Data. Would we require a project to be officially disbanded, with all funds withdrawn, before we say that it is defunct? Or would we say that a Big Data project has failed if it did not meet its original set of goals? If a Big Data resource is built, and operates as planned, can we say that it has failed if nobody actually uses the resource? With these caveats in mind, it is believed that the majority of information technology projects fail, and that failure is positively correlated with the size and cost of the projects [11]. We know that public projects costing hundreds of billions of dollars have failed quietly, without raising much attention [12]. Big Data projects are characterized by large size, high complexity, and novel technology, all of which aggravate any deficiencies in management, personnel, or process practices [11].
Section 15.2. Failed Standards
Don't be afraid of missing opportunities. Behind every failure is an opportunity somebody wishes they had missed.
Lily Tomlin
Most standards fail. Examples are easy to find. OSI (Open Systems Interconnection) was a seven-layer protocol intended as the Internet standard. It was backed by the U.S. government and approved by the ISO/IEC (International Organization for Standardization) and the International Electrotechnical Commission). It has been supplanted by TCP/IP (Transmission Control Protocol/Internet Protocol), preferred by Unix. Simply because a standard has been developed by experts, backed by the U.S. government, and approved by an international standards organization, there is no guarantee that it will be accepted by its intended users.
In the realm of format standards (e.g., for documents, images, sound, movies), there are hundreds of standards. Some of these standards were developed for specific devices (e.g., cameras, image grabbers, word processors), and served a specific purpose in a small window of time. Today, most of these standard formats are seldom used. A few dozen remain popular. There is an on-going effort to incorporate all of the various image and media formats under one standard and one horrifying term: the BLOB (Binary Large OBject). [Glossary BLOB]
Every new programming language is born with the hope that it will be popular and immortal. In the past half century, well over 2000 programming languages have been devised. Most of these languages are seldom used and often forgotten. In 1995, Ada 95 became an ANSI/ISO standard programming language, a distinction held by only a few programming languages. The U.S. National Institute of Standards announced that Ada would be used by Federal departments and agencies in software applications that involve control of real-time or parallel processes, very large systems, and systems with requirements for very high reliability [13]. The official announcement was entitled, Announcing the Standard for ADA. The programming language, Ada, was named for Ada Lovelace (1815–52), who wrote the first computer program (an algorithm for computing Bernoulli numbers) for Charles Babbage's prototype computer (the so-called analytic engine). Every Ada programmer knows that Ada is not an acronym; they bristle whenever Ada is spelled with all-uppercase letters. The federal government's announcement of the new “ADA” standard did not bode well. Ada is a fine programming language, but declaring it a government standard could not guarantee error-free implementations; nor could it guarantee its popularity among programmers. Following its ascension to standards status, the popularity of Ada declined rapidly. Today, it is rare to find an Ada programmer.
Even the best standards seldom meet expectations. Consider the metric system. It is used throughout the world, and it is generally acknowledged as a vast improvement over every preceding measurement standard. Nonetheless, in the United States our height is measured in feet and inches, not meters and centimeters, and our weight is measured in pounds, not kilograms. Here in the United States, it would be difficult to find a bathroom scale marked with metric graduations. The next time you look at your calendar, remember that about half the world uses a solar calendar. Most other earthlings follow a lunar calendar. Some base their calendars on a combination of solar and lunar observations.
When a standard is ignored, or improperly implemented, the results may be catastrophic. On June 4, 1996, the maiden flight of the French Ariane 5 exploded 37 seconds after launch. A software exception occurred during a data conversion from a 64-bit floating point to 16-bit signed integer value. The data conversion instructions (in Ada code) were not protected from causing an Operand Error [14].
On September 23, 1999, the United States launched the Mars Climate Orbiter, which crashed on impact on the red planet. An official investigation, by the Mars Climate Orbiter Mishap Investigation Board, concluded that the crash occurred due to a software glitch that arose when English units of measurement were used in the software when Metric units were supplied as input [15]. The flight software was coded in Ada.
The most successful standards are specifications that achieved popularity before they achieved the status of “standard.” The best of these filled a need, enjoyed broad use, had few or no barriers to implementation (e.g., free and easy to use), and had the bugs ironed out (i.e., did not require excessive modifications and version updates). The most unsuccessful standards are those prepared by a committee of special interests who create the standard ab initio (i.e., without a pre-existing framework), without a user community, and without a proven need. The altogether worst standards seem to be those that only serve the interests of the standards committee members.
Robert Sowa has written a useful essay entitled “The Law of Standards” [16]. His hypothesis is, “Whenever a major organization develops a new system as an official standard for X, the primary result is the widespread adoption of some simpler system as a de facto standard for X.” He gives many examples. The PL/I standard, developed by IBM was soon replaced by Fortran and COBOL. The Algol 68 standard was replaced by Pascal. Ada, promoted by the U.S. Department of Defense, was replaced by C. The OS/2 operating system produced by IBM was replaced by Windows.
For small data projects and for software applications, the instability of data standards is not a major problem. Small data projects are finite in length and will seldom extend beyond the life span of the standards implemented within the project. For software designers, a standard implemented within an application can be replaced in the next upgrade. Any costs are passed onto the licensed user. Instability in standards serves the interests of software developers by coercing customers to purchase upgrades that comply with the new versions of included standards.
For Big Data resources, instability in standards is always bad news. A failed standard may invalidate the data model for the resource; undoing years of work. How can the data manager cope with failed standards? Over twenty years ago, I was approached by a pathologist who was tasked with annotating his diagnostic reports with a standard vocabulary of diseases. The principal options at the time were ICD (International Classification of Diseases), SNOMED (Systematized Nomenclature of Medicine) and MeSH (Medical Subject Headings produced by the National Library of Medicine). The ICD seemed too granular (i.e., not enough names of diseases). SNOMED was constantly changing; newer versions were incompatible with older versions, and he worried that annotations under an old version of SNOMED could not be integrated into the newer hospital information systems. MeSH was a well-curated public nomenclature, analogous to the Dewey Decimal System for the health informatics community, but it was not widely adopted by the pathology community.
I suggested all of his options were untenable. His best bet, under the circumstances, was to write his reports in simple, declarative sentences, using canonical diagnostic terms (i.e., terms expressed in a form suitable for a nomenclature). Reduced sentences could be easily parsed into constituent parts and accurately translated or mapped to any chosen vocabulary, as needed [17].
Consider the following sentence:
The patient has an scc, and we see invasion to the subcutaneous tissue, all the way to the deep margins, but the lateral margins are clear.
This sentence, which is understandable to clinicians, would not be understandable to a computer program that parsed text. Among other impediments, a computer would not know that the abbreviation “scc” corresponds to the diagnostic term “squamous cell carcinoma.” A computer that has an index list matching abbreviations to terms may falsely map the abbreviation to the wrong expansion term (e.g., small cell carcinoma rather than squamous cell carcinoma).
The complex sentence could be rewritten as six declarative statements:
Diagnosis: squamous cell carcinoma.
Invasion is present.
Invasion extends to subcutaneous tissue.
Margin is involved.
Tumor extends to deep margin.
Tumor does not extend to lateral margins.
It would be relatively easy to write a computer program that could autocode these very simple sentences. Every surgical pathology case entered in the hospital information system could be coded again and again, using any new version of any nomenclature. [Glossary Autocoding, Autoencoding]
We could go one step further, expressing every statement as a triple consisting of an identifier, a metadata term, and a data value. As discussed in Section 4.3, “Semantics and Triples,” if all of the data in the resource is available as simple triples, and if the model provides a method whereby data objects can be assigned to classes, then every data object can be fully specified. Specified data objects, expressed as a simple triples, can be ported into any old or new data standard, as needed. [Glossary Class-oriented programming]
It is best to keep in mind two general principles of data management:
- 1. Data objects can be well specified, without a standard. You do not need to store your data in a format that is prescribed by a standard.
- 2. Data standards are fungible. If you know the rules for standards, you can write a program that converts to the standard, as needed.
In many instances, a simple, generic data model may free the Big Data manager from the problems that ensue when a data standard becomes obsolete.
Section 15.3. Blaming Complexity
Complexity is the worst enemy of security.
Bruce Schneier [18]
Big Data is complex, and complexity is dangerous. It is easy to write software that attains a level of complexity that exceeds anything encountered in the physical realm. Likewise, there is no limit to the complexity of operational methods, security standards, data models, and virtually every component of a Big Data resource. When a Big Data resource somehow manages to cope with complexity, it can be just a matter of time before key personnel depart to follow other opportunities, errors are introduced into the system, and a once-great resource grinds to a halt.
When errors occur in complex systems, even catastrophic errors, they can be very difficult to detect. A case in point is the Toyota Lexus ES 350 Sedan. Thousands of vehicle owners experienced unintended vehicle acceleration; the complex electronic control system was the chief suspect [19]. Over the years, Toyota expended enormous resources trying to understand and solve the problem [20]. A host of agencies and authorities were involved in the investigation; first came the Department of Transportation and the National Highway Traffic Safety Administration. Then, owing to its expertise in software integrity, computer control systems, and electromagnetic interference, the National Aeronautics and Space Administration was called into the fray. Later, the National Academy of Sciences launched its own study of unintended acceleration in the auto industry. During these investigations, Toyota paid about $50 million in fines and recalled about 9 million cars. The dust may never settle completely on this problem, but it now appears that most, if not all, problems were due to sticky pedals, driver error, or improperly placed floor mats; no errors were uncovered in the complex electronic control system.
The most vexing problems in software engineering involve “sometimes” errors; software that runs perfectly under most circumstances, but fails at apparently random intervals. Finding the source of the problem is virtually impossible, because the most thorough evaluations will indicate that everything is working well. Sometimes the mistake occurs because of the chaotic and unpredictable quality of complex systems. Sometimes mistakes occur because the numbers get too big, or too small, or too impossible (division by zero); sometimes the order by which events occur are unexpected, causing the system to behave oddly. In all these situations, finding the problem is very difficult and could have been avoided if the system had been less complex. Knowing this, you might expect that data managers try their best to reduce the complexity of their resources. Actually, no. For most resources, increasing complexity is the normal state because it is easier to solve problems with more complexity than with more simplicity.
Every Big Data project should be designed for simplicity. The design team should constantly ask “Can we achieve this functionality with less complexity?” When the complexity cannot be reduced for a desired level of functionality, a trade-off might be reached. The team is justified in asking, “Do we need this level of functionality? Might we achieve a reduced but adequate level of functionality with a less complex system?” After the design phase, every addition, and every modification to the system should be examined for complexity. If complexity needs to be added to the system, then the team must analyze the consequences of the increased complexity.
There are times when complexity is necessary. Think of the human mind and the human body. Our achievements as individuals and as a species come as the result of our complexity. This complexity was achieved over 4 billion of years of evolution, during which time disadvantageous traits were lost and advantageous traits were retained. The entire process was done incrementally. The complexity of a Big Data resource is created in a moment. We do not have four billion years to debug the system. When can complexity be permitted in a Big Data resource? There are several scenarios:
In the case of weather forecasting, the purpose is to attain predictions of ever-increasing accuracy. Each new forecasting model contains more parameters than the prior model, requires more computing power, and is expected to provide accurate forecasts that extend further and further into the future. Complex models that do not yield greater accuracy than simpler models are abandoned. The whole process mimics evolution.
Many of the most important devices implemented in society are complex (televisions, computers, smartphones, jet airplanes, magnetic resonance imaging devices). They all started as simpler devices, with complexity added incrementally. These complex devices did not require 4 billion years to evolve, but they did require the intense participation of many different individuals, teams, corporations, and users to attain their current utility.
The venerable U-2 U.S. spy plane is an example of incrementally achieved complexity. The U-2 was born in the 1950s and designed as a cold war spy plane. Despite its advanced age, the U-2 has stubbornly resisted obsolescence by incrementally increasing in complexity and utility. Today, it is still in service, with a functionality far greater than anything imaginable when it was created [21]. The value of incremental complexity has been emulated in some modern Big Data technologies [22].
- – When your model really needs to match, item by item, the complexity of the real system that it is modeling.
Biologists have learned, in the past decade, that cellular processes are much more complex than they had originally imagined. Genes are controlled by interactions with other genes, with RNA, with proteins, and with chemical modifications to DNA. Complex chemical interactions that occur in the cell's nucleus and the cytoplasm have made it impossible to find simple genetic variants that account for many biologic processes. The entire field of gene research has shifted to accommodate previously unanticipated complexities that have thwarted our earlier analyses [23]. Our progress in disease biology, developmental biology, and aging seems to hinge on our willingness to accept that life is complex, and cannot be reduced to a sequence of nucleotides in a strand of DNA.
There are occasions when we cannot “wish away” complexity. The best we can do is to prepare a model that does not amplify the irreducible complexity that exists in reality.
Section 15.4. An Approach to Big Data That May Work for You
The most likely way for the world to be destroyed, most experts agree, is by accident. That's where we come in; we're computer professionals. We cause accidents.
Nathaniel Borenstein
The old saying, “You can bring a horse to water, but you can't make it drink,” aptly describes the situation for many Big Data resources. Sometimes Big Data projects fail because the intended users simply do not know what to do with the data. They have no approach that matches the available data, and they blame the Resource for their inability to succeed. After a few would-be data miners give up, the Resource gets a reputation of being useless. Funding is withdrawn, and the Resource dies.
At this point, you may feel completely overwhelmed by the complexities of Big Data resources. It may seem that analysis is humanly impossible. The best way to tackle a large and complex project is to divide it into a smaller, less intimidating tasks. The approach to data analysis described in this chapter involves nine sequential steps.
It takes a certain talent to ask a good question. Sometimes, a question, even a brilliant question, cannot be answered until it is phrased in a manner that clarifies the methods by which the question can be solved. For example, suppose I am interested in how much money is spent, each year, on military defense, in the United States. I could probably search the Internet and find the budget for the Department of Defense, in the year 2011. The budget for the Department of Defense would not reflect the costs associated with other agencies that have a close relationship with the military, such as intelligence agencies and the State Department. The Department of Defense budget would not reflect the budget of the Veterans Administration (an agency that is separate from the Department of Defense). The budget for the Department of Defense might include various items that have no obvious relationship to military defense. Because I am asking for the “annual” budget, I might need to know how to deal with projects whose costs are annualized over 5, 10, or 15 years. If large commitments were made, in 2005, to pay for long-term projects, with increasing sums of money paid out over the next decade, then the 2018 annual budget may reflect payouts on 2010 commitments. A 2018 budget may not provide a meaningful assessment of costs incurred by 2018 activities. After a little thought, it becomes obvious that the question: “How much money is spent, each year, on military defense, in the United States?” is complex, and probably cannot be answered by any straightforward method.
At this point, it may be best to table the question for a while, and to think deeply about what you can reasonably expect from Big Data. Many analysts start with the following general question: “How can this Big Data resource provide the answer to my question?” A more fruitful approach may be: “What is the data in this resource trying to tell me?” The two approaches are quite different, and I would suggest that data analysts begin their analyses with the second question.
Every good Big Data resource provides users with a detailed description of its data contents. This might be done through a table of contents or an index, or through a detailed “readme” file, or a detailed user license. It all depends on the type of resource and its intended purposes. Resources should provide detailed information on their methods for collecting and verifying data, and their protocols supporting outsider queries and data extractions. Big Data resources that do not provide such information generally fall into two categories: (1) highly specialized resources with a small and devoted user base who are thoroughly familiar with every aspect of the resource and who do not require guidance; or (2) bad resources.
Before developing specific queries related to your research interest, data analysts should develop queries designed to evaluate the range of information contained in the resource (discussed in detail in Chapter 9, “Assessing the Adequacy of a Big Data Resource”. Even the best Big Data resources may contain systemic biases. For example, PubMed contains abstracted data on about 20 million research articles. Research articles are published on positive findings. It is very difficult for a scientist to publish a paper that reports on the absence of an effect or the non-occurrences of a biological phenomenon. PubMed has a positive result bias. The preferential exclusion or inclusion of specific types of data is very common, and data analysts must try to identify such biases.
Every Big Data resource has its blind spots; areas in which data is missing or scarce, or otherwise unrepresentative of the data domain. Often, the Big Data managers are unaware of such deficiencies. In some cases, Big Data managers blame the data analyst for “inventing” a deficiency that pertains exclusively to unauthorized uses of the resource. When a data analyst wishes to use a Big Data resource for something other than its intended purposes (e.g., using PubMed to predict NIH funding priorities over the next decade, using the Netflix query box to determine what kinds of actors appear in zombie movies), then the Big Data manager may be reluctant to respond to the analyst's complaints.
Simply having access to large amounts of subject data does not guaranteed that you have all the data you would need to draw a correct conclusion.
“If you can dream - and not make dreams your master”
From If (poem), by Rudyard Kipling
The available data cannot always answer the exact question you started with. After you have assessed the content and design of your Big Data resource(s), you will want to calibrate your question to your available data sources. In the case of our original question, from Step 1, we wanted to know how much money is spent, each year, on military defense, in the United States. If we are unable to answer this question, we may be able to answer questions related to the budget sizes of individual government agencies that contribute to military spending. If we knew the approximate portion of each agency budget that is devoted to military spending, we might be able to produce a credible total for the amount devoted to military activities, without actually finding the exact answer.
After exploring the resource, the data analyst learns the kinds of questions that can best be answered with the available data. With this insight, he or she can re-formulate the original set of questions.
Big Data resources can often produce an enormous output in response to a data query. When a data analyst receives a large amount of data, he or she is likely to assume that the query output is complete and valid. A query output is complete when it contains all of the data held in the Big Data resource that answers the query, and a query output is valid if the data in the query output yields a correct and repeatable answer.
A Google query is an example of an instance wherein query output is seldom seriously examined. When you enter a search term and receive millions of “hits”, you may tend to assume that your query output is adequate. When you're looking for a particular Web page, or an answer to a specific question, the first output page on your initial Google query may meet all your needs. A thoughtful data analyst will want to submit many related queries to see which queries produce the best results. The analyst may want to combine the query outputs from multiple related queries, and will almost certainly want to filter the combined outputs to discard response items that are irrelevant. The process of query output examination is often arduous, requiring many aggregation and filtering steps.
After satisfying yourself that you've taken reasonable measures to collect a complete query output, you will still need to determine whether the output you have obtained is fully representative of the data domain you wish to analyze. For example, you may have a large query output file related to the topic of poisonous mushrooms. You've aggregated query outputs on phrases such as “mushroom poisoning”, “mushroom poisons”, “mushroom poison”, “mushroom toxicity”, and “fungal toxins”. You pared down queries on “food poisoning,” to include only mushroom-related entries. Now you want to test the output file to see if it has a comprehensive collection of information related to your topic of interest. You find a nomenclature of mushrooms, and you look for the occurrence of each nomenclature term in your aggregated and filtered output file. You find that there are no occurrences of many of the mushrooms found in the mushroom nomenclature, including mushrooms known to be toxic. In all likelihood, this means that the Big Data resource simply does not contain the level of detail you will need to support a thorough data analysis on topics related to poisonous mushrooms.
There is no standard way of measuring the adequacy of a query output; it depends on the questions you want to answer, and the analytic methods you will employ. In some cases, a query output will be inadequate because the Big Data resource simply does not contain the information you need; at least not in the detail you require. In other cases, the Big Data resource will contain the information you need, but does not provide a useful pathway by which your query can access the data. Queries cannot thoroughly access data that is not fully annotated, assigned to classes, and constructed as identified data objects.
Data analysts must be prepared to uncover major flaws in the organization, annotation, and content of Big Data resources. When a flaw is found, it should be promptly reported to the data manager for the resource. A good data manager will have a policy for accepting error reports, conducting investigations, instituting corrections as necessary, and documenting every step in the process.
Is the output data numeric or is it categorical? If it is numeric, is it quantitative? For example, telephone numbers are numeric, but not quantitative. If the data is numeric and quantitative, then your analytic options are many. If the data is categorical information (e.g., male or female, true or false), then the analytic options are limited. The analysis of categorical data is first and foremost an exercise in counting; comparisons and predictions are based on the occurrences of features.
Are all of your data objects comparable? Big Data collects data objects from many different sources, and the different data objects may not be directly comparable. The objects themselves may be annotated with incompatible class hierarchies (e.g., one data object described as a “chicken” may be classed as “Aves”, while another “chicken” object may be classed as “Food.” One data object described as “child” may have the “age” property divided into three-year increments up to age 21. Another “child” object may have “age” divided into 4-year increments up to age 16. The data analyst must be prepared to normalize assigned classes, ranges of data, subpopulations of wildly different sizes, different nomenclature codes, and so on.
After the data is normalized and corrected for missing data and false data, you will need to visualize data distributions. Be prepared to divide your data into many different groupings, and to plot and re-plot your data with many different techniques (e.g., histograms, smoothing convolutions, cumulative plots, etc.). Look for general features (e.g., linear curves, non-linear curves, Gaussian distributions, multi-modal curves, convergences, non-convergences, Zipf-like distributions). Visualizing your data with numerous alternate plotting methods may provide fresh insights and will reduce the likelihood that any one method will bias your objectivity.
An irony of Big Data analysis is that the data analyst must make every effort to gather all of the data related to a project, followed by an equally arduous phase during which the data analyst must cull the data down to its bare essentials.
There are very few situations wherein all of the data contained in a Big Data resource is subjected to analysis. Aside from the computational impracticalities of analyzing massive amounts of data, most real-life problems are focused on a relatively small set of local observations drawn from a large number of events. The process of extracting a small set of relevant data from a Big Data resource is referred to by a variety of names, including data reduction, data filtering, and data selection. The reduced data set that you will use in your project should obey the courtroom oath “the whole truth, and nothing but the truth.”
Methods for reducing the dimensionality of data are described in Section 10.5 “Reducing Your Data”. As a practical point, when the random and redundant variables have been expunged, the remaining data set may still be too large for a frontal computational attack using advanced methods. A good data analyst knows when to retreat and regroup. If something can be calculated to great precision on a large number of variables and data points, then it should be calculated with somewhat less precision with somewhat fewer variables and fewer data points. Why not try the small job first, and see what it tells you?
Algorithms are perfect machines. They work to produce consistent solutions; they never make mistakes; they need no fuel; they never wear down; they are spiritual, not physical. Every computer scientist loves algorithms; if they could be re-assigned to their favorite position, most computer scientists would devote their careers to writing new algorithms.
If you peruse the titles of books in the Big Data field, you will find that most of these books emphasize data analysis. They focus on parallel processing, cloud computing, high-power predictive analytics, combinatorics methods, and the like. It is very easy to believe that the essential feature of Big Data, that separates it from small data, relates to analytic algorithms. [Glossary Cloud computing, Grid]
As algorithms become more and more clever, they become more and more enigmatic. Some of the most popular statistical methods can be used injudiciously, and these include p values and linear regression [24,25]. Journal editors know this. Consequently, when a scientist submits an article to a journal, he or she can expect the editor to insist that a statistician be included as a co-author. The editors have a valid point, but is it really helpful to forcibly insert a statistician into an unfamiliar project? Isn't there some risk that the inclusion of a statistician will provide a thin veneer of scientific credibility, without necessarily attaining a valid scientific conclusion? [Glossary P value, Linear regression]
The field of Big Data comes with a dazzling assortment of advanced analytic options. Who is really qualified to judge whether the correct method is chosen; whether the chosen method is implemented properly; and whether the results are interpreted correctly?
Analysts in search of analytic algorithms should consider these simple options:
If you have taken to heart the suggestion in Section 12.4, “Back-of-Envelope Analyses”, to estimate your answers early in project development, then you have already found simple estimators for your data. Consider this option: keep the estimators, and forget about advanced algorithms. For many projects, estimators can be easily understood by project staff, and will provide a practical alternative to exact solutions that are difficult to calculate and impossible to comprehend.
Sabermetrics is a sterling example of analysis using simple metrics that are chosen to correlate well with a specific outcome; a winning ball game. In the past several decades, baseball analysts have developed a wide variety of new performance measurements for baseball players. These include: base runs, batting average on balls in play, defense independent pitching statistics, defense-independent earned run average, fielding independent pitching, total player rating, or batter-fielder wins, total pitcher index, and ultimate zone rating. Most of these metrics were developed empirically, tested in the field, literally, and optimized as needed. They are all simple linear metrics that use combinations of weighted measures on data collected during ballgames. Though sabermetrics has its detractors, everyone would agree that it represents a fascinating and largely successful effort to bring objective numeric techniques to the field of baseball. Nothing in sabermetrics involves advanced algorithms. It is all based on using a deep understanding of the game of baseball to develop a set of simple metrics that can be easily calculated and validated.
Much of the success of Big Data is attained by making incremental, frequent changes to your system in response to your metrics. An example of successful micromanagement for Big Data is the municipal CompStat model, used by Police Departments and other government agencies [26,27]. A promising metric is chosen, such as 911 response time, and a team closely monitors the data on a frequent basis, sometimes several times a day. Slow 911 response times are investigated, and the results of these investigations typically generate action items intended to correct systemic errors. When implemented successfully, the metric improves (e.g., the 911 response time is shortened), and a wide range of systemic problems are solved. Micromanaging a single metric can improve the overall performance of a department.
Departments with imagination can choose very clever metrics upon which to build an improvement model (e.g., time from license application to license issuance, number of full garbage cans sitting on curbs, length of toll booth lines, numbers of broken street lights, etc.) It is important to choose useful metrics, but the choice of the metric is not as important as the ability to effectively monitor and improve the metric.
As a personal aside, I have used this technique in the medical setting and found it immensely effective. During a period of about 5 years at the Baltimore VA Medical center, I had access to all the data generated in our Pathology Department. Using a variety of metrics such as case turn-around time, cases requiring notification of clinician, cases positive for malignancy, and diagnostic errors, our pathologists were able to improve the measured outcomes. More importantly, the process of closely monitoring for deficiencies, quickly addressing the problem, and reporting on the outcome of each correction produced a staff that was sensitized to the performance of the department. There was an overall performance improvement.
Like anything in the Big Data realm, the data micromanagement approach may not work for everyone, but it serves to show that great things may come when you carefully monitor your Big Data resource.
There is a lot of analytic talent in this world. Broadcasting your project via the Web may attract the attention of individuals or teams of researchers who have already solved a problem isomorphic to your own, or who can rapidly apply their expertise to your specific problem [28].
Funding entities have recently discovered that they can solicit algorithmic solutions, offering cash awards as an incentive. For example, the InnoCentive organization issues challenges regularly, and various sponsors pay awards for successful implementations [29]. [Glossary Predictive modeling contests]
- – Develop your own algorithm that you fully understand. You should know your data better than anyone else. With a little self-confidence and imagination, you can develop an analytic algorithm tailored to your own needs.
When the weather forecaster discusses the projected path of a hurricane, he or she will typically show the different paths projected by different models. The forecaster might draw a cone-shaped swath bounded by the paths predicted by the several different forecasts. A central line in the cone might represent the composite path produced by averaging the forecasts from the different models. The point here is that Big Data analyses never produce a single, undisputed answer. There are many ways of analyzing Big Data, and they all produce different solutions.
A good data analyst should interpret results conservatively. Here are a few habits that will keep you honest and will reduce the chances that your results will be discredited.
If you have analyzed the Big Data with several models, include your results for each model. It is perfectly reasonable to express your preference for one model over another. It is not acceptable to selectively withhold results that could undermine your conclusions.
In most cases, Big Data conclusions are descriptive, and cannot establish physical causality. This situation may improve as we develop better methods to make reasonable assertions for causality based on analyses of large, retrospective data sets [30,31]. In the meantime, the primary purpose of Big Data analysis is to provide a hypothesis that can be subsequently tested, usually through experimentation, and validated.
It can be hard to resist choosing an analytic model that supports your pre-existing opinion. When your results advance your own agenda, it is important to explain that you have a personal stake in the outcome or hypothesis. It is wise to indicate that the data can be interpreted by other methods and that you would be willing to cooperate with colleagues who might prefer to conduct an independent analysis of your data. When you offer your data for re-analysis, be sure to include all of your data: the raw data, the processed data, and step-by-step protocols for filtering, transforming, and analyzing the data.
Large studies are not necessarily good studies, and the honest data analyst will present the facts and the analysis, without using the number of data records as a substitute for analytic rigor.
“Sometimes you gotta lose 'til you win”
From “Little Miss” (song) by Sugarland
Validation involves demonstrating that the conclusions that come from data analyses are reliable. You validate conclusions by showing that you draw the same conclusion repeatedly in comparable data sets.
Real science can be validated, if true, and invalidated, if false. Pseudoscience is a pejorative term that applies to scientific conclusions that are consistent with some observations, but which cannot be confirmed or tested. For example, there is a large body of information that would suggest that earth has been visited by flying saucers. The evidence comes in the form of many eyewitness accounts, numerous photographs, and cover-up conspiracy theories. Without commenting on the validity of UFO claims, it is fair to say that these assertions fall into the realm of pseudoscience because they are untestable (i.e., there is no way to prove that flying saucers do not exist), and there is no definitive data to prove their existence (i.e., the “little green men” have not been forthcoming).
Big Data analysis always stands on the brink of becoming a pseudoscience. Our finest Big Data analyses are only valid to the extent that they have not been disproven. A good example of a tentative and clever conclusion drawn from data is the Titius-Bode Law. Titius and Bode developed a simple formula that predicted the locations of planets orbiting a star. It was based on data collected on all of the planets known to Johann Daniel Titius and Johann Elert Bode, two eighteenth century scientists. These planets included Mercury through Saturn. In 1781, Uranus was discovered. Its position fit almost perfectly into the Titius-Bode series, thus vindicating the predictive power of their formula. The law predicted a fifth planet, between Mars and Jupiter. Though no fifth planet was found, astronomers found a very large solar-orbiting asteroid, Ceres, at the location predicted by Titius and Bode. By this time, the Titius-Bode Law was beyond rational disputation. Then came the discoveries of Neptune and Pluto, neither of which remotely obeyed the Law. The data had finally caught up to the assertion. The Titius-Bode Law was purely descriptive; not based on any universal physical principles. It served well for the limited set of data to which it was fitted, but was ultimately discredited.
Let us look at a few counter-examples. Natural selection is an interesting theory, published by Charles Darwin, in 1859. It was just one among many interesting theories aimed at explaining evolution and the origin of species. The Lamarckian theory of evolution preceded Darwin's natural selection by nearly 60 years. The key difference between Darwin's theory and Lamarck's theory comes down to validation. Darwin's theory has withstood every test posed by scientists in the fields of geology, paleontology, bacteriology, mycology, zoology, botany, medicine, and genetics. Predictions based on Darwinian evolution dovetail perfectly with observations from diverse fields. The Lamarckian theory of evolution, proposed well before DNA was established as the genetic template for living organisms, held that animals passed experiences to succeeding generations through germ cells; thus strengthening intergenerational reliance on successful behaviors of the parent. This theory was groundbreaking in its day, but subsequent findings failed to validate the theory. Neither Darwin's theory nor Lamarck's theory could be accepted on their own merits. Darwin's theory is correct, as far as we can know, because it was validated by careful scientific observations collected over the ensuing 150 years. Lamarck's theory is incorrect, because it failed the validation process.
The value of big data is not so much to make predictions, but to test predictions on a vast number of data objects. Scientists should not be afraid to create and test their prediction models in a Big Data environment. Sometimes a prediction is invalidated, but an important conclusion can be drawn from the data anyway. Failed predictions often lead to new, more successful predictions.
Of course, every analysis project is unique, and the steps involved in a successful project will vary. Nonetheless, a manageable process, built on techniques introduced in preceding chapters, might be helpful. My hope is that as Big Data resources mature and the methods for creating meaningful, well annotated, and verified data become commonplace, some of the steps listed in this chapter can be eliminated. Realistically, though, it is best to assume that the opposite will occur; more steps will be added.
Section 15.5. After Failure
Programming can be fun, so can cryptography; however they should not be combined.
Charles B. Kreitzberg and Ben Shneiderman
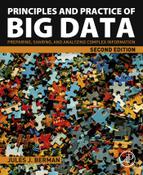
In 2001, funds were appropriated to develop the National Biological Information Infrastructure. This Big Data project was a broad cooperative effort intended to produce a federated system containing biological data from many different sources, including Federal and State government agencies, universities, natural history museums, private organizations, and others. The data would be made available for studies in the field of resources management. On January 15, 2012, the resource was officially terminated, due to budget cuts. A Website announcement sits vigil, like a tombstone, marking the passage of an ambitious and noble life (Fig. 15.1).
Like the humans who create the resources, Big Data lives for a time, and then it dies. Humans often carry life insurance, or savings, to pay the costs of burial and to manage the distribution of an estate. In most cases, no preparations are made for the death of Big Data. One day it is there, and the next day it is gone.
Abandonware is a term that is often applied to software developed under a grant. When the grant funding ceases, the software is almost always abandoned. Nobody assumes the responsibility of tying up loose ends, finding and removing bugs, distributing the software, or using the software in new projects. Similarly, when a Big Data project dies, the programmers and staff scrabble to find new jobs; nobody remains to clean up the leftovers. The software is abandoned. The identifier system and the data model for the resource are almost always lost to posterity. All those charts and all those registration numbers simply disappear. The data in the failed resource either slips into the bit-void or becomes legacy data; stored on disks, shelved, and forgotten. Legacy data can be resurrected, but it seldom happens.
Here are a two precautions that can salvage some of the pieces of a failed Big Data project.
Software applications can be envisioned as utilities with a graphic user interface. One software application may have the functionality of three or four utilities (e.g., spreadsheet plus graph plotter plus statistics suite, with the graphic user interface of a word processor). When a Big Data Resource is built, it will usually be accessed under an umbrella application. This application will support user queries, while shielding the user from the complexities of the data and the mechanics of passing the query over multiple, networked servers. When a Big Data resource is terminated, applications with a user interface to the resource retain no value. However, the small utility programs built into the application, may have enormous value to the builders of related Big Data resources. The best applications are modularized; built from working parts that can be extracted and used as modules or utilities. Utilities that apply generally to many data-related projects are valuable assets.
When you write code, employ responsible coding practices. There is a vast literature on coding etiquette. Programmers are always advised to write simple code, to comment their code (i.e., explain the software steps and algorithms within the programs, as well as any modifications to the software), and to avoid using variable names that have no obvious meaning. This book will not dwell on good programming practices, but suffice it to say that as programs become more and more complex, good software practices become essential.
Big Data resources are very expensive. It makes sense to put aside funds to preserve the data, in the event of failure. Data means nothing unless it is properly identified; hence, the data held in a Big Data resource must be preserved with its identifiers. If the data is identified and well annotated, it will be possible to re-integrate the data objects into a successor resource.
Preserving legacy data is particularly important in hospital information systems, which have a very high failure rate [3]. It is unacceptable to lose patient histories, just because the hospital bought bad software. Hospitals, medical centers and all Big Data systems that serve critical missions should set aside money, in an escrow fund, for this purpose.
Section 15.6. Case Study: Cancer Biomedical Informatics Grid, a Bridge Too Far
In a software project team of 10, there are probably 3 people who produce enough defects to make them net negative producers.
Gordon Schulmeyer
Some governments do an excellent job at analyzing their own failures. After the Ariane 5 exploded 37-post launch on its maiden space flight, the French government issued the results of their investigation [14]. When the Mars Climate Orbiter crashed on Mars, the U.S. government issued a report on their investigation [15]. The world might be a better place if we, as individuals, published our own investigative reports when we disappoint our friends and co-workers or fail to meet our personal goals; but self-accountability has never been a human strength.
In 2004, the National Cancer Institute launched an ambitious project, known as the Cancer Biomedical Informatics Grid (CaBig™), aimed at developing standards for annotating and sharing biomedical data, and tools for data analysis. An unusual aspect of this government project was that it had its own business model, “to create a front end that will make caBIG attractive for others to invest in and take on responsibility for downstream events” [32]. Further, it was “anticipated at the time that the caBIG effort would evolve into a self-sustaining community” [32].
When the effort began, its goals seemed relatively focused, but over the next 6 years, the scope of the project grew; it eventually covered software interoperability and Web-based services for sharing and analyzing data produced by virtually every biomedical specialty, from gene sequencing to radiology imaging to tissue specimens.
For a time, the project received generous support from academia and industry. In 2006, the Cancer Biomedical Informatics Grid was selected as a laureate in ComputerWorld's honors program [33]. ComputerWorld described the project as “Effectively forming a World Wide Web of cancer research,” with “promises to speed progress in all aspects of cancer research and care.” The laudable ambitions of the project came with a hefty price tag. By 2010, the National Cancer Institute had sunk at least 350 million dollars into the effort [32]. Though the project was ambitious, there were rumblings in the cancer informatics community that very little had been achieved. In view of past and projected costs, an ad hoc committee was assigned to review the program.
In the report issued to the public, in 2011, the committee found that the project had major deficiencies and suggested a yearlong funding moratorium [32]. Soon thereafter, the project leader left the National Cancer Institute, and the Cancer Bioinformatics Grid was terminated [34].
The ad hoc committee report went into considerable detail to explain the deficiencies of the program. Their observations serve as a general warning for overly ambitious Big Data efforts.
The caBIG program has grown rapidly without adequate prioritization or a cost-effective business model, has taken on a continuously increasing and unsustainable portfolio of development and support activities, and has not gained sufficient traction in supporting critical cancer research community needs. The working group interviews indicate that the program has developed some extremely expensive software solutions that have not been adopted in a meaningful way by the NCI designated Cancer Centers, have competed unnecessarily with existing solutions produced by industry leaders that hold a 60% to 70% market share in the NCI-designated Cancer Centers, and ultimately have created an enormous long-term maintenance, administration, and deployment load for the NCI that is financially unsustainable [32].
Regarding analysis tools, the working group found that “the level of impact for most of the tools has not been commensurate with the level of investment. For example, many tools, such as caArray ($9.3M), have been developed at significant expense and without a clear justification, particularly since a number of similar commercial and open software tools already existed. It is indeed noteworthy and a lesson for the future that the more widely adopted Life Sciences tools have their roots in projects that were already fairly successfully developed by academic research institutions, whereas most of the caBIG™-initiated projects have been less successful and, ironically, much more expensive. Similarly, enormous effort was devoted to the development of caGRID ($9.8M), an environment for grid-based cloud computing, but the working group did not find evidence that it has empowered a new class of tools to ‘accelerate the discovery of new approaches for the detection, diagnosis, treatment, and prevention of cancer’ as envisioned” [32].
The working group found that the project participants were attracted to new technological innovations, even when those innovations provided no advantages. “In particular, the interviews suggest that the strategic goals of the program were determined by technological advances rather than by key, pre-determined scientific and clinical requirements. Thus, caBIG™ ended up developing powerful and far-reaching technology, such as caGRID, without clear applications to demonstrate what these technologies could and would do for cancer research.” Regarding the value of new technology, the working group “struggled to find projects that could not have been implemented with alternative less expensive or existing technologies and software tools” [32].
I was a program director at the National Cancer Institute during the first two years of the project and had a front-row seat for the CaBig pageant. At the time, I thought that the project was too big, too complex, too ambitious, that it served too many interests (the intramural community at NIH, the extramural community of academic researchers, a profusion of industry contractor, and the Office of the Director at the National Cancer Institute), enlisted the assistance of too many people, had too much money, was lavished with too much hype, had initiated too many projects, and that the program directors operated with insufficient accountability. In a word, I was envious.
In the case of the Cancer Biomedical Informatics Grid, hindsight would suggest that the project may have benefited from the following:
- 1. Start small [35].
Projects should begin with a relatively small number of highly dedicated and energetic people. Studies have shown that as more and more money and personnel are added to a software project, the chances of success drop precipitously [36]. When you stop and think about it, most of the great programming languages, some of the most important operating systems, the design of the Internet, the language of the world wide Web, computer hardware advances, innovational corporations, and virtually all of the great algorithms in computer science, were created by one individual, or a small group of people (usually less than 5).
Some Big Data projects are necessarily large. The Human Genome project, touted as one of the largest and most successful Big Data projects in human history, involved hundreds of scientists. But when it came down to organizing the pieces of data into a coherent sequence, the job fell to one man. In a report published by the Center for Biomolecular Science and Engineering at UC Santa Cruz, Jim Kent “developed in just 4 weeks a 10,000-line computer program that assembled the working draft of the human genome” [37]. “Kent's assembly was celebrated at a White House ceremony on June 26, 2000” [37].
The Cancer Biomedical Informatics Grid began with teams of workers: contractors, government employees, academics, and advisors from various related informatics projects. The project sprang into existence too big to build.
Projects that are closely tied to a community (the cancer research community in the case of CaBIG™, tend to expand their goals based on the interests of enthusiastic community members. It is very common for project managers to be approached by individuals and small groups of people asking that their pet projects be added to the list of project goals. Requests that come from powerful and influential members of the community cannot be ignored. Somehow project managers must placate their constituents without losing focus on their original goals. It is not sufficient to show that the resource is managing to do a lot of different things; managers must be able to complete their critical goals. Failing to do so was a problem for CaBig™. As a counter-example, consider the amazing success of Google. Today, we enjoy the benefits of Google Earth, Google Maps, Google Books, and so one. But the Google people started with a simple, albeit large and all encompassing, search engine. Projects were added after the search engine had been created and popularized.
There is a tendency today for large projects to seek representation in every ongoing effort that relates in any way to the project. For example, a standards effort in the cancer community might send representatives to every committee and standards project in the general area of health technology interoperability. Likewise, narrowly focused standards efforts (e.g., gene array specifications, microscopy specifications) often attract representatives from large corporations and from other standards committees. The push toward internecine activity is based on the belief that the ultimate goal of software interoperability and data integration can only be achieved by broadening the level of participation. In practice, these interchanges make it difficult for project managers to achieve any kind of focus. Each workday is diluted with de-briefings on other projects, conferences, and committee meetings.
Life is about balance. Managers need to have some sense of what is happening in the world outside of their own project, but they must not digress from their own goals. In many cases, careful attention to the Big Data fundamentals (e.g., specifying data fully, identifying and classifying data objects, achieving introspection), should suffice in creating a functional resource that can operate with other resources. Data is fungible; a well-specified data model can often to ported to other formats, other standards and other specifications, as needed.
This tautology should never be forgotten or trivialized. It is quite common for Big Data resources to choose hardware, software, standards, and specifications that cannot possibly serve their needs. Oblivious to reality, they will choose a currently popular, but flawed methodology, hoping some miracle will save them. So strong is this belief that things will somehow “work out” that virtually every type of project proposal (e.g., grant application, business proposal, book deal) contains a hidden deus ex machina; an implied request that the reviewer suspend his disbelief. Allowing for human nature, some grant reviewers extend a “one-miracle per grant” policy. An applicant can ask for one miracle, but no more.
After CaBig™ was terminated, Barry Smith, a big thinker in the rather small field of ontology, wrote an editorial entitled “CaBIG™ has another fundamental problem: it relies on “incoherent” messaging standard” [38]. In his editorial Smith suggested that HL7, a data model specification used by CaBig™ could not possibly work, and that it had proven to be a failure by those people who actually tried to implement the specification and use it for its intended purposes [38]. At about the same time that CaBig was being terminated, the $17 billion interoperability project undertaken by the U.K.'s National Health Service was scuttled. This failed program had been called “the world's biggest civil information technology program” [8]. Back in 2001, a report published by the NHS Information Authority cited fundamental flaws in HL7 [39]. These flaws included intrinsic difficulties in establishing a workable identifier system. The report concluded that despite these problems, choosing HL7 was strategically correct, as it was the only data model with a process of continual review and update [39]. At the time, everyone was hoping for a miracle. The miracle did not come for CaBig™; nor had it come for the UK's interoperability project. No one can say to what degree, if any, HL7 flaws contributed to the downfall of these projects; but flaws in the data model could not have been very helpful.
There is a healthy appetite among information technologists for new and improved technologies. Though this preference may serve well for small and short-term projects, it is often counterproductive for Big Data efforts. All Big Data projects are complex, and there is seldom room to compound complexities by tossing innovative software into the mix. Unless there is a compelling reason to use new technology, it is usually much safer to use older technology that it adequate for the tasks at hand. Stable open source solutions, particularly when there is an active community that supports the software, is often the best choice. Aside from cost considerations (most open source software is free), there is the added benefit of longevity. Unlike commercial software, which can be discontinued or replaced by applications that are incompatible with installed versions, popular open source software tends to stay viable. In the case of CaBig™, the working group indicated that the project chose new technologies, when older technologies would suffice.
I have a colleague who works in the field of computer-aided diagnosis, an interesting field that has not yet garnered widespread acceptance in the medical community. Apparently, clinicians still prefer to reach their diagnoses through their own efforts, without the aid of computer software [40]. Perhaps, he thought, the aid of a computer program might be appreciated in areas where physicians were in short supply; such as developing countries. He thought that it would be useful to find a market for computer aided diagnostic software somewhere in Africa. Of course, healthcare limitations in developing countries are often basic availability issues (e.g., access to hospitals, beds, antibiotics, sterile materials, equipment, and so forth). Access to diagnostic computer programs, developed on clinical data sets collected on U.S. patients, may not be “what the doctor ordered.”
In the case of CaBig, the working group found that CaBig™ was developing powerful new technologies for which there was no apparent need. It is only human nature to want to make a difference in the world. For Big Data project managers, it is sometimes best to wait until the world asks you for your input.
Big data projects often involve a great number of people. Those involved in such efforts may come to believe that the resource itself has an intrinsic value that exceeds the value of its rendered services [41]. Experience would indicate that most users, even avid users, are not interested in the details. The couch potato may sit transfixed in front of his television for hours on end, but he is not likely to pursue an interest in the technologies underlying signal transmissions, or high definition image construction. Likewise, the public has no interest in knowing any of the protocols and models that underlie a Big Data resource. As someone who was asked to review manuscripts published by the scientific contributors to CaBig™, it was my impression that publications emanating from this effort were largely self-congratulatory pieces describing various aspects of the project, in details that would have meaning only to the fellow members of the team [42].
Program managers should never forget that a Big Data resource is all about the data, and how the data is analyzed. The resource itself, rightly or wrongly, should not be the focus of public attention.
Section 15.7. Case Study: The Gaussian Copula Function
America is the only country where a significant proportion of the population believes that professional wrestling is real but the moon landing was faked.
David Letterman
It is important to remember that mathematics only describes observed relationships. It does not explain how those relationships are achieved. A clever physicist such as James Clerk Maxwell can write a set of equations that describe how electric charges and electric currents create electric and magnetic fields, but equations cannot tell us what the meaning is of magnetism. I would venture to say that there isn't a physicist who truly understands the meaning of magnetism, or electricity, or matter, or time.
What applies to the physicist applies to the economist. Recent experience with the Gaussian copula function provides a cautionary tale [43]. This formerly honored and currently vilified formula, developed for Wall Street, was used to calculate the risk of default correlation (i.e., the likelihood that two investment vehicles would default together) based on the current market value of the vehicles, and without factoring in historical data (Fig. 15.2). The Gaussian copula function was easy to implement, and became a favorite model for predicting risk in the securitization market. Though the formula had its early detractors, it soon became the driving model on Wall Street. In about 2008, the function simply stopped working. At about the same time, stock markets collapsed everywhere on planet earth. In some circles, the Gaussian copula function is blamed for the global economic disaster [44]. [Glossary Correlation distance, Nongeneralizable predictor]

Glossary
Autocoding When nomenclature coding is done automatically, by a computer program, the process is known as “autocoding” or “autoencoding”.
Autoencoding Synonym for autocoding.
BLOB A large assemblage of binary data (e.g., images, movies, multimedia files, even collections of executable binary code) that are associated that have a common group identifier and that can, in theory, be moved (from computer to computer) or searched as a single data object. Traditional databases do not easily handle BLOBs. BLOBs belong to Big Data.
Class-oriented programming A type of object-oriented programming for which all object instances and all object methods must belong to a class. Hence, in a class-oriented programming language, any new methods and instances that do not sensibly fall within an existing class must be accommodated with a newly created subclass. All invocations of methods, even those sent directly to a class instance, are automatically delivered to the class containing the instance. Class-oriented programming languages embody a specified representation of the real world in which all objects reside within defined classes. Important features such as method inheritance (through class lineage), and introspection (through object and class identifiers) can be very simply implemented in class-oriented programming languages. Powerful scripts can be written with just a few short lines of code, using class-oriented programming languages, by invoking the names of methods inherited by data objects assigned to classes. More importantly, class-oriented languages provide an easy way to discover and test relationships among objects.
Cloud computing According to the U.S. National Institute of Standards (NIST) and Technology cloud computing enables “ubiquitous, convenient, on-demand network access to a shared pool of configurable computing resources (e.g., networks, servers, storage, applications, and services) that can be rapidly provisioned and released with minimal management effort or service provider interaction” [46]. As the NIST definition would suggest, cloud computing is similar to Big Data, but there are several features that are expected in one and not the other. Cloud computing typically offers an interface and a collection of in-cloud computational services. Cloud data is typically contributed by a large community, and the contributed data is deposited often for no reason other than to provide convenient storage. These features are not expected in Big Data resources. Perhaps the most important distinction between a cloud computing and Big Data relates to mutability. Because cloud data is contributed by many different entities, for many purposes, nobody expects much constancy; data can be freely extracted from the cloud, or modified in place. In the cloud, the greatest emphasis is placed on controlling computational access to cloud data; with less emphasis on controlling the content of the cloud. In contrast, Big Data resources are designed to achieve a chosen set of goals using a constructed set of data. In most cases, the data held in a Big Data resource is immutable. Once it is entered into the resource, it cannot be modified or deleted without a very good reason.
Correlation distance Also known as correlation score. The correlation distance provides a measure of similarity between two variables. Two similar variables will rise and fall together [47,48]. The Pearson correlation score is popular, and can be easily implemented [49,50]. It produces a score that varies from − 1 to 1. A score of 1 indicates perfect correlation; a score of -1 indicates perfect anti-correlation (i.e., one variable rises while the other falls). A Pearson score of 0 indicates lack of correlation. Other correlation measures can be applied to Big Data sets [47,48].
Fair use Copyright and Patent are legal constructs designed to provide intellectual property holders with the uninfringed power to profit from their creative labors, while still permitting the public to have full access to the holders' property. When Public use of copyrighted material does not limit its profitability to the copyright holder, then the “fair use” of the material is generally permitted, even when those uses exceed customary copyright limits. Most countries have some sort of “fair use” provisions for copyrighted material. In the United States, Fair Use is described in the Copyright Act of 1976, Title 17, U.S. Code, section 107, titled, Limitations on exclusive rights: Fair use. Here is an excerpt of the Act: “Notwithstanding the provisions of sections 106 and 106A, the fair use of a copyrighted work, including such use by reproduction in copies or phonorecords or by any other means specified by that section, for purposes such as criticism, comment, news reporting, teaching (including multiple copies for classroom use), scholarship, or research, is not an infringement of copyright. In determining whether the use made of a work in any particular case is a fair use the factors to be considered shall include (1) the purpose and character of the use, including whether such use is of a commercial nature or is for nonprofit educational purposes; (2) the nature of the copyrighted work; (3) the amount and substantiality of the portion used in relation to the copyrighted work as a whole; and (4) the effect of the use upon the potential market for or value of the copyrighted work. The fact that a work is unpublished shall not itself bar a finding of fair use if such finding is made upon consideration of all the above factors” [51].
Grid A collection of computers and computer resources (typically networked servers) that are coordinated to provide a desired functionality. In the most advanced Grid computing architecture, requests can be broken into computational tasks that are processed in parallel on multiple computers and transparently (from the client's perspective) assembled and returned. The Grid is the intellectual predecessor of Cloud computing. Cloud computing is less physically and administratively restricted than Grid computing.
Linear regression A method for obtaining a straight line through a two-dimensional scatter plot. It is not, as it is commonly a “best fit” technique, but it does minimize the sum of squared errors (in the y-axis values) under the assumption that the x-axis values are correct and exact. This means that you would get a different straight line if you regress x on y; rather than y on x. Linear regression is a popular method that has been extended, modified, and modeled for many different processes, including machine learning. Data analysts who use linear regression should be cautioned that it is a method, much like the venerable P-value, that is commonly misinterpreted [25].
Nongeneralizable predictor Sometimes data analysis can yield results that are true, but non-generalizable (i.e., irrelevant to everything outside the set of data objects under study). The most useful scientific findings are generalizable (e.g., the laws of physics operate on the planet Jupiter or the star Alpha Centauri much as they do on earth). Many of the most popular analytic methods are not generalizable because they produce predictions that only apply to highly restricted sets of data; or the predictions are not explainable by any underlying theory that relates input data with the calculated predictions. Data analysis is incomplete until a comprehensible, generalizable and testable theory for the predictive method is developed.
P value The P value is the probability of getting a set of results that are as extreme or more extreme as the set of results you observed, assuming that the null hypothesis is true (that there is no statistical difference between the results). The P-value has come under great criticism over the decades, with a growing consensus that the P-value is often misinterpreted, used incorrectly, or used in situations wherein it does not apply [24]. In the realm of Big Data, repeated samplings of data from large data sets will produce small P-values that cannot be directly applied to determining statistical significance. It is best to think of the P-value as just another piece of information that tells you something about how sets of observations compare with one another; and not as a test of statistical significance.
Predictive modeling contests Everyone knows that science is competitive, but very few areas of science have been constructed as a competitive game. Predictive analytics is an exception. Kaggle is a Web site that runs predictive-modeling contests. Their motto is “We're making data science a sport.” Competitors with the most successful predictive models win prizes. Prizes vary from thousands to millions of dollars, and hundreds of teams may enter the frays [52].