
Preface: Mining for Gold (or Digging in the Mud)
In The Adventure of the Six Napoleons by Arthur Conan Doyle, the famous sleuth Sherlock Holmes remarks to his sidekick, Watson:
“The Press, Watson, is a most valuable institution, if you only know how to use it.”
That statement, when applied to the wealth of data in social media channels today (loosely, “the press”), has never been more true. Companies are always looking for an “edge” in an attempt to find ways to remain relevant to their ever more vocal set of constituents. They are struggling to position themselves as trusted advisors or suppliers in a cut-throat environment of competitors, where consumers use public opinion (both good and bad) to share information and experiences at the speed of light (literally). When looking to explore this deluge of social media data, we must think and act like detectives. Careful investigations can, at times, lead to many revealing insights. This can be both time consuming and complex; it is work that requires a careful, methodical effort and not only requires patience and perseverance, but at times also requires a creative streak or spark of insight.
This book, aimed at executives (or analysts) responsible for understanding public opinion, brand management, and public perceptions, attempts to look at the processes and insights needed when attempting to answer questions within this massive amount of unstructured data we call social media.
Just What Do We Mean When We Say Social Media?
A social media website doesn’t just give you information, but rather it is built around a way to interact with you while allowing access to the information. This interaction could be collecting comments or suggestions on a blog or voting on a specific topic—allowing users to have a voice in a conversation as opposed to simply reading others’ opinions—this is why we call it a social media conversation.
Think of print media or a static web page or website as a one-way street, much like reading a newspaper or listening to a report on television; you have very limited ability to give your thoughts on the matter. (Radio talk shows at least allow users to call in to express their opinions—although ultimately they have the ability to limit the conversation by cutting off the call at any point.) Social media can be considered a two-way street that enables communication between end users. Social media gives users on the Internet the ability to express their opinions and interact with each other at speeds unheard of in the past with traditional media. This popularity of social media continues to grow at an exponential rate.
Why Look at This Data?
Consider one of the most famous cases of using Twitter to watch for customer satisfaction issues: @ComcastCares. As BusinessWeek’s Rebecca Reisner [1] said, Frank Eliason is probably the best known and most successful customer care representative in the world (or at least the United States). In April 2008, Eliason’s team started monitoring Twitter traffic for mentions of his company, Comcast, made by disgruntled customers. (Comcast is one the largest providers of entertainment, information, and communications services and products in the United States, providing cable television, broadband Internet, and telephone services.) His tactic was to watch Twitter and immediately reach out to these customers who expressed dissatisfaction with Comcast’s customer service. The idea was to quiet the spread of any negative sentiment amongst Comcast customers, while providing a sense of personal touch to these frustrated clients.
According to a 2011 report (Eliason has since left Comcast for greener pastures), the new Comcast customer care division processed about 6,000 blog posts and 2,000 Twitter messages per day, which resulted in faster customer response times that directly translate into improved customer satisfaction indexes. While Comcast is not analyzing social media per se, it is watching issues related to perceived poor quality so that it can quickly address issues and interact with these customers.
How Does This Translate into Business Value?
According to Eliason, Comcast was able to understand issues on Twitter far in advance of their call centers (that is, when customers would call in to tell of a problem) [2]. For example, during the NHL playoffs, a sports network carried by Comcast went off the air. People used Twitter to complain about Comcast, claiming the problem was poor service. However, in reality, all of the other networks were offline as well due to a lightning strike. The Comcast call center was able to find out the reason within a few minutes of it happening and was able to put up an automated message telling people what happened. In this case, Comcast estimated that it was able to save $1.2 million by putting up a message about the outage. Customers were able to listen to the message and hang up rather than call in to complain, thus using valuable call center resources.
As another example, consider a new product launch. The marketing team spent hundreds of hours determining the best way to disseminate the message of your new offering, and the company has spent millions on advertising, yet there appears to be lackluster acceptance.
Why?
One way to listen to the man on the street is to scan various social media outlets such as discussion forums, blogs, or chatter on sites like Twitter or LinkedIn. Perhaps you can pick up on messages or customer perceptions of your product or brand. Perhaps when you look at the discussion around your product, you’ll see something similar to the situation shown in Figure I.1.
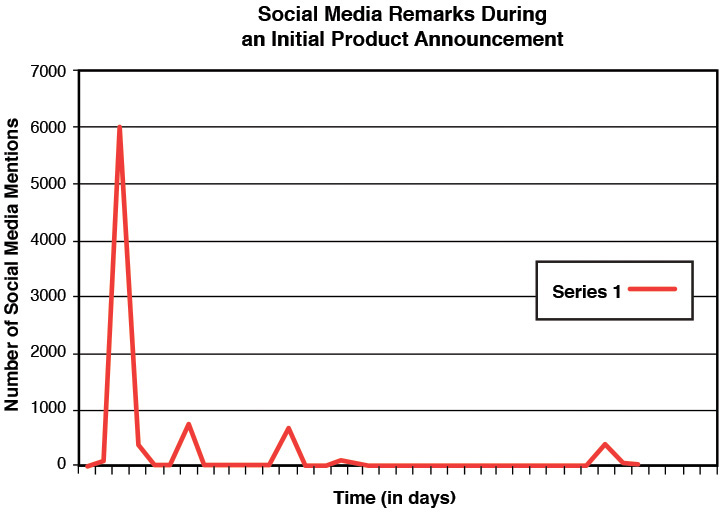
This graph was produced for one of the projects we worked with during its launch. Note the steep rise in conversation at the initial launch. Social media conversations went from 0 to more than 6,000 mentions over the course of a few days. This is great! But look at what happens next. The level of conversations fell off rapidly, with just a few isolated spikes in conversation (which were later revealed to be additional announcements). So in this case, it wasn’t so much that potential customers didn’t like what they saw in the marketplace (of course, that may be the reason for the lack of conversation), but it appears more likely that the marketing campaign wasn’t resonating with the public to pick up and carry on the conversation. We look at this particular case in a bit more detail later, but the message here is that a simple analysis within social media can quickly reveal where your business plan might have gone awry.
The Book’s Approach
“I keep six honest serving men; they taught me all I know; their names are What and Why and When and How and Where and Who.”
—Rudyard Kipling [3]
The process of social media analysis involves essentially three steps: data identification, data analysis, and finally information interpretation. In explaining each of these steps, we provide important insights and techniques that can be used to maximize the value derived at every point during the process. The approach we take is to first define a question to be answered (such as “What is the public’s perception of our company in the light of a natural disaster?”). In attempting to analyze these questions, we suggest that analysts think like detectives, always asking the important questions “Who? What? Where? When? Why? and How?” These questions help in determining the proper data sources to evaluate, which can greatly affect the type of analysis that can be performed.
Data Identification
Any social media investigation is only as good as the data in which you are searching. The first part of this book explores proper data identification—or where to look in this vast social media space. In searching for answers, keep in mind that we will be searching through massive amounts of unstructured data, all in an attempt to make sense out of what we find in the process. Once we uncover some interesting artifacts, we will be transforming them into (hopefully useful) information. In the long run, the ultimate business objective is to derive real business insight from this data, turning the information we’ve gleaned from these sources into actionable knowledge.
In the first part of this book, we explore the source of the data that will be under analysis. To ensure that what we are collecting is the proper data or it explores the correct conversations, we look into questions such as these:
![]() Whose opinions or thoughts are we interested in?
Whose opinions or thoughts are we interested in?
![]() Where are the conversations about the topic in question happening?
Where are the conversations about the topic in question happening?
![]() Do we need to look at the question back in time or just current discussions?
Do we need to look at the question back in time or just current discussions?
Data Analysis
In Part II of the book, we explore the data analysis techniques that can be utilized in answering questions within the data collection. Again, putting on our detective hats, we return to our “honest serving men” as described previously by Rudyard Kipling and explore a variety of topics.
How we want to look at this newly uncovered information is important. A data model is used to represent the unstructured data we collect and is an important (and complex) part of answering our questions. These data models are living and breathing entities that need to change over time or when newly discovered insights need to be incorporated into the model. These relatively long-running models tend to be complex and difficult to finalize, and as a result, many people may want to take a less-detailed view of the information. Many choose a real-time view of the data, where watching metrics or trends in real time (or near real time) provides a valuable, yet low-cost, set of insights. As an alternative between long-running analysis and a real-time view lies a structured search model that allows for the searching of common words or phrases within a dataset in an attempt to reveal some insightful information. Each type of analysis has its pros and cons, many of which are explored within this section.
In an attempt to understand what people are saying, we begin to explore some of the interpretations of the data, looking at simple metrics such as:
![]() In a collection that contains Twitter data related to a new product or service, what is the top hashtag?
In a collection that contains Twitter data related to a new product or service, what is the top hashtag?
![]() Are those hashtags positive or negative in their sentiment?
Are those hashtags positive or negative in their sentiment?
![]() What is the volume of conversation about the product or service? (Are people talking about it?)
What is the volume of conversation about the product or service? (Are people talking about it?)
Other techniques used to discern what people are talking about include the use of word clouds or the collection of top word groups or phrases. These visualizations can help analysts understand the types of conversations that are being held about the company or service in question. More advanced analysis may include the use of a relationship matrix that attempts to understand the interrelationship between concepts or terms (for example, how is the public’s view of customer service correlated with perceived cleanliness of a store?).
Marketing teams will be sponsoring advertising campaigns or coming out with press releases at strategic points during a new product release or during a particular point in time—all in an effort to attract new customers while exploiting the loyalty of their existing customer base. But is their message reaching the intended audience? The question of where people are talking becomes important in evaluating the outlets that people use when discussing a topic. If the company is advertising mainly in trade journals but there is a large amount of conversation happening in Twitter, would the message be better spread via microblogging? (Or perhaps the use of microblogging can augment the marketing message?) Along those same lines, if we stand on a box in the center of a square and preach our message, do we want to do it in the middle of the night when the square is empty, or at lunchtime when the square is bustling with traffic. The same is true in the social media space: when we choose to disseminate information may be just as important as where.
Information Interpretation
Once we have all of this data reduced into information nuggets, making sense of the information becomes paramount. In Part III, we demonstrate that the insights derived can be as varied as the original question that was posed at the beginning of the analysis. In some cases, the goal is not only to identify who is doing the talking in our analysis but, more importantly, who is influencing the conversation or who is influential in their thoughts and opinions. It’s important to remember what SunTzu once said: “Keep your friends close, and your enemies closer.” The identification of the “movers and shakers” can be important in social media; these are the individuals we want to follow or attempt to get closer to in order to have them use their influence for us as opposed to against us. In other cases, what people are saying about a particular issue or topic is the object of the research. For example:
![]() Are people excited about the newly designed web experience that our company just released, or are they talking about the difficulty in finding information within our website?
Are people excited about the newly designed web experience that our company just released, or are they talking about the difficulty in finding information within our website?
![]() How critical are the outsourcing decisions that we just made to the brand perception of our company or product?
How critical are the outsourcing decisions that we just made to the brand perception of our company or product?
![]() What were the key issues or topics that people cited when they were expressing negative sentiment?
What were the key issues or topics that people cited when they were expressing negative sentiment?
In our experience, we have also encountered cases in which the where is the most important finding. For a newly launched marketing campaign, is the conversation happening more in company-sponsored venues, or is it also happening in neutral venues? Analysis and insights around when are also important. For example, is the sentiment for your company becoming negative around the same time as the sentiment for a key competitor (perhaps indicating a downturn in your market)? More importantly, has sentiment for your company or brand gone negative while the competition has gone positive?
Why You Should Read This Book
According to Merriam-Webster, Definition of SOCIAL MEDIA: forms of electronic communication (as Web sites for social networking and microblogging) through which users create online communities to share information, ideas, personal messages, and other content (as videos) [4]. Use of social media has grown exponentially over the past eight years (see Figure I.2) [2]. Thus, social media is a major contributor to the explosive growth of big data in our world.
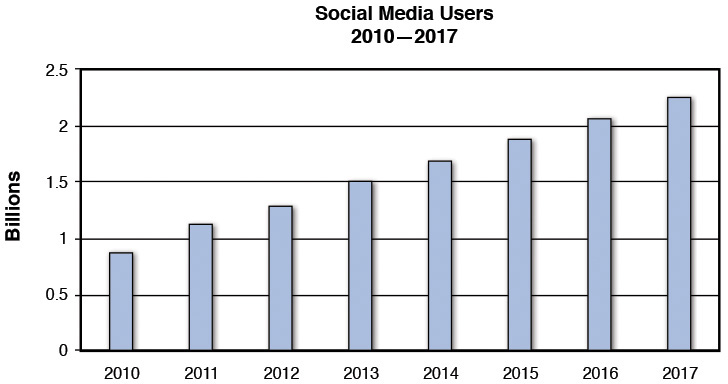
Research has shown that the growth of social media use is far from over. According to Internet Statistics and Market Research Company eMarketer, in a report published in June 2013 [5], the current prediction is that one in four people across the globe will participate in social media by 2014. That’s an incredible number. Consider also:
![]() Asia-Pacific will have largest social network population worldwide through 2017.
Asia-Pacific will have largest social network population worldwide through 2017.
![]() The Middle-East and Africa will have the second largest audience starting next year, because their population penetration rates are among the lowest.
The Middle-East and Africa will have the second largest audience starting next year, because their population penetration rates are among the lowest.
![]() Asia-Pacific has the largest user base with 777 million people, where 44.8% of social network users are expected at the end of the year.
Asia-Pacific has the largest user base with 777 million people, where 44.8% of social network users are expected at the end of the year.
![]() The higher penetration of Internet users in India, Japan, Australia, South Korea, Brazil, Mexico, Russia, Middle-East, and Africa has helped to revise the estimated number of social media users in 2013 by 100 million.
The higher penetration of Internet users in India, Japan, Australia, South Korea, Brazil, Mexico, Russia, Middle-East, and Africa has helped to revise the estimated number of social media users in 2013 by 100 million.
![]() In 2014, the Middle East and Africa (MEA) region emerged as the second largest social media hub, with more than 248 million users surpassing Latin America in regions in the next year.
In 2014, the Middle East and Africa (MEA) region emerged as the second largest social media hub, with more than 248 million users surpassing Latin America in regions in the next year.
![]() By the beginning of 2015, India was expected to surpass the United States as the second largest social media country after China.
By the beginning of 2015, India was expected to surpass the United States as the second largest social media country after China.
IBM CEO Ginni Rometty has called big data the next great natural resource [6]. Getting in on the “ground floor” of anything can be challenging, but if you want to turn this natural resource into business value “gold,” you should read this book.
This book will serve the needs of a number of business users. Those users who are new to the subject will get a good overall understanding of the domain by reading the entire book. Those users who have some familiarity with either one or more of the sections of this book will be able to get additional techniques and methodologies to add to their repertoire.
To enable you to apply the content from this book to your unique situation, we have included a number of case studies. The techniques and findings we present here are primarily based on over three years’ worth of hands-on experience in executing a variety of social media analytics projects for IBM and IBM’s clients. To protect proprietary information, we’ve edited the cases for illustrative purposes.
For example, we analyzed Twitter content for about a month before the 2014 Grammy Awards were announced and identified a list of potential winners. When the actual results came in, every single one of them was in the top three choices that we had predicted.
These are just some of the examples of value that people are finding by mining this new natural resource. We cover a variety of these use cases throughout the book. People have even used this new capability to fine-tune multimillion dollar marketing campaigns. And, in some cases, people have used analysis of Twitter data during the first two days of a conference and created talking points for an executive presentation on the third day.
By reading this book, you will get a broad understanding of the following topics:
![]() What are the various types of social media analysis that can be done?
What are the various types of social media analysis that can be done?
![]() How do we collect the right kind of data for a project?
How do we collect the right kind of data for a project?
![]() How do we analyze the data using a variety of tools and techniques to get the value from it?
How do we analyze the data using a variety of tools and techniques to get the value from it?
![]() How do we interpret the results and apply them for real business value?
How do we interpret the results and apply them for real business value?
What This Book Does and Does Not Focus On
A lot of good books out there are targeted at social business marketing managers and focused on how to effectively utilize social media channels to market their brand, their goods, and their services. We do not focus on that approach in this book.
This book is also not directed at technologists, architects, and programmers looking to implement the most effective technology solutions for social media analytics. We provide some information that might be helpful for this type of an audience, but this book is not primarily directed toward them.
This book also does not focus on a single technology platform or a single tool and therefore does not serve as a user manual for one of these products. The intention is to provide enough information to business users so that you can either build your technology solutions or buy solutions to serve your needs for extracting business value out of social media and textual content.
Even though this book is primarily targeted to business users, we cover several technical aspects at length to equip business users with enough knowledge to extract value from this book. Subsequent chapters cover enough detail, but what follows is a list of some of these key technology concepts with a high-level description.
![]() Big Data—Big data is usually characterized by a large volume of data, a large variety of data, and data that is moving at a large velocity (speed). For example, this includes the content flowing through the cables of your local cable TV provider during prime time or content being streamed by Netflix during the screening of an episode of House of Cards!
Big Data—Big data is usually characterized by a large volume of data, a large variety of data, and data that is moving at a large velocity (speed). For example, this includes the content flowing through the cables of your local cable TV provider during prime time or content being streamed by Netflix during the screening of an episode of House of Cards!
![]() Natural Language Processing (NLP)—NLP involves analysis of words used in our language. A simple application of NLP is a word cloud. A more complex example of NLP includes analyzing streams of conversations and identifying dominant themes.
Natural Language Processing (NLP)—NLP involves analysis of words used in our language. A simple application of NLP is a word cloud. A more complex example of NLP includes analyzing streams of conversations and identifying dominant themes.
![]() Sentiment Analysis—This is a special case of natural language processing. In this case, the content is analyzed by software and interpreted to identify if positive, negative, or a neutral sentiment is being expressed. For example, the sentence “I am very happy with the latest release of Product XYZ” is treated as expressing a positive sentiment, whereas the sentence “The installation process for Product XYZ is very difficult” is treated as negative. An example of neutral sentiment is “Product XYZ is supports platform A and system B.”
Sentiment Analysis—This is a special case of natural language processing. In this case, the content is analyzed by software and interpreted to identify if positive, negative, or a neutral sentiment is being expressed. For example, the sentence “I am very happy with the latest release of Product XYZ” is treated as expressing a positive sentiment, whereas the sentence “The installation process for Product XYZ is very difficult” is treated as negative. An example of neutral sentiment is “Product XYZ is supports platform A and system B.”
Endnotes
[1] Reisner, Rebecca. Comcast’s Twitter Man, Business Week, January 2009.
[2] Bernoff, Josh, and Ted Schadler. Empowered: Unleash Your Employees, Energize Your Customers, Transform Your Business. Harvard Business Press, 2010.
[3] Kipling, Rudyard. The Elephant’s Child: From the Just So Stories. ABDO, 2005.
[4] “Social Media.” Merriam-Webster.com. Merriam-Webster, n.d. Web. Sept. 21 2015. http://www.merriam-webster.com/dictionary/social media.
[5] Social Networking Reaches Nearly One in Four Around the World. See more at: http://www.emarketer.com/Article/Social-Networking-Reaches-Nearly-One-Four-Around-World/1009976#sthash.B7RoQKQs.dpuf.
[6] Lenzner, Robert. IBM CEO Ginni Rometty Crowns Data As The Globe’s Next Natural Resource, Forbes, March 2013.