
2. Separating the Wheat from the Chaff
Knowledge is power, only if man knows what facts not to bother with.
—Robert Staughton Lynd [1]
To pick up on the thread from the preceding chapter (about looking for data in all the right places), just how do we separate the good from the bad or the useful from the not-so-useful data sources?
Ask any grain farmer if it’s important to separate the wheat from the chaff in his harvest. As any good farmer knows, it’s not only a useful saying, but it’s critical to his success. In cereal crops such as rice, barley, oats, and wheat, the seed (which is what we eat) is surrounded by a husk. That husk is known as the chaff, which, when separated from the seed, is generally thrown away as useless. Thus, as farmers know, to generate a useful harvest, we must separate the wheat from the chaff. This metaphor of the chaff has long since represented a useless object or something to be discarded. It’s the same with an initial data “harvest.” Through the use of a search engine (or some other automated means), we retrieve useful data, but often, included with that useful material is irrelevant content that we need to remove.
In data analysis, we want to gather as much data as we can in the hopes of uncovering additional information, which will in the end help us make more informed observations. However, in that gathering process, we may inadvertently collect data that is totally useless to us during the analysis we are going to perform. As we said previously, we want to gather as much as we can and then try to separate the useless from the useful. You may have heard that in statistics, the larger the sampling of data, the more accurate the measurements will become. While that’s true, what we’re referring to here is not a diversity of opinion on a topic, but a separation of opinions on too many topics.
When conducting an analysis, we are looking to maximize the amount of data to analyze, but not sacrifice the quality (or relevance) of that data. Obtaining a sample size that is appropriate in both of those areas is critical for a number of reasons. Most importantly, a large sample size is more representative of the population we want to examine, which in turn will limit the influence of outliers or irrelevant observations. A sufficiently large sample size is also necessary to produce results among variables that are significantly different. For qualitative studies (such as text analytics), where the goal is to reduce the chances of discovery failure, a large sample size broadens the range of possible data and forms a better picture for analysis. Again, all this needs to be weighed against the introduction of too much unrelated data that can skew our results.
It All Starts with Data
We’ve all heard the saying “Knowledge is power, but wisdom is King.” We need to remember that the source that power is built upon is the data that we use to derive our wisdom (or knowledge). We often describe this hierarchy to our clients as shown in Figure 2.1.
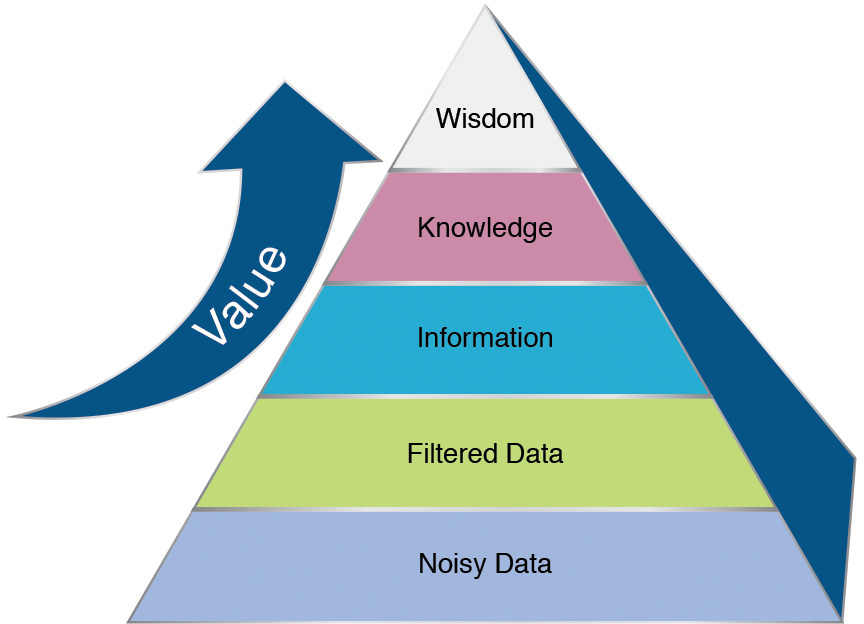
As an analogy, consider the building of a house. When we start construction, we start, obviously, from the ground up by laying a solid foundation. Every aspect of the future house depends on this foundation. If it’s weak (perhaps not enough cement), the house could crumble under the weight of the additional floors that are added. This is true of a social media analysis also. If the data we collect is wrong, or erroneous, any conclusions we draw or assumptions we make could fall apart due to lack of supporting data. While the data is important in support of the conclusions we’ve drawn, in the final analysis what we see are the insights that were derived and the wisdom gained. No longer do we see the strong foundation of data or the information it represents. But it’s important to remember and acknowledge that new wisdom we’ve uncovered is supported by a strong foundation.
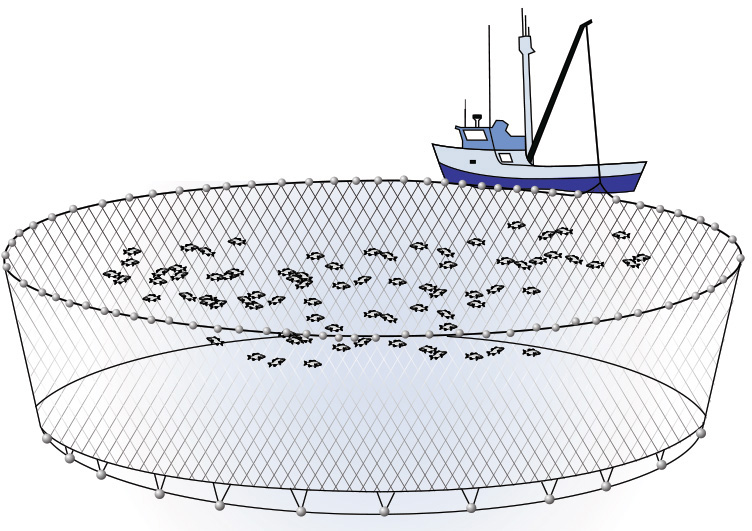
Casting a Net
When we are about to begin our project of analyzing a set of data in search of some nuggets of value, we obviously must start with a collection of data. We call this process “casting a net.” Think of it like a fisherman would. The larger the net that is cast, the more fish we will haul in with each casting (see Figure 2.2). Harvesting social media data (or any data from the Internet for that matter) is the same. The wider, broader the search criteria we use, the more data we are likely to haul in for an analysis. What we need to understand when we cast this net is that some of the data we retrieve will be very relevant to the area we are looking to explore. Some of the data may be marginally useful, and some may be just plan worthless (the “chaff,” if you will).
There are two schools of thought on the data collection process:
![]() Gather with a very narrow focus and assume everything you have collected is relevant.
Gather with a very narrow focus and assume everything you have collected is relevant.
![]() Gather as much as you can, with a much “looser” set of collection criteria, and then “cleanse” the data, thus eliminating the extraneous results.
Gather as much as you can, with a much “looser” set of collection criteria, and then “cleanse” the data, thus eliminating the extraneous results.
We believe there is a middle ground, where we should start with a wide net, evaluate the collection results and then modify the search criteria, and finally recast a net to hopefully retrieve a more intelligent sampling.
In thinking about data validity and only considering “correct” data, let’s look at a simple example using numbers. Let’s assume we have a list of numbers (see Table 2.1) that represent the number of visitors to a particular website every hour. To make the example a bit more realistic, let’s assume we count web page accesses in a weblog and that we’ve done some kind of preprocessing on the weblog data to determine valid website accesses. That means we ignore robot searches and invalid web page accesses, and so on.
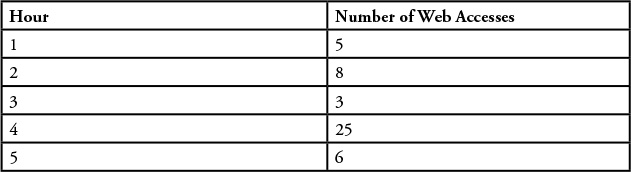
So using this method, we might come up with data that looks like Table 2.1 (remember, this is just a sample).
So by adding together all of the web page visits (47 in total) and dividing by the time period (5 hours), we compute the average number of web visitors per hour to our site and come up with an average number of 9 visitors to our website every hour, as shown in Figure 2.3.
But does that really make sense? If we empirically look at our data, we can see right away that most of the numbers in Figure 2.3 rarely went above 8 visitors per hour at our site, and often the number was around 5 or 6. If we look closely at the data we analyzed, it becomes obvious that one of the data points is quite different from the rest and appears to be an outlier in our data (that is, the sample that was reported at 25 hits per hour). This value may very well be correct, but based on the other samples around it, there is a distinct possibility that our process for computing the hits per hour was either flawed or was subjected to some other anomaly. Since the theme of this chapter is separating the wheat from the chaff, perhaps we should remove that value (as useless) and recompute our results. This gives us a value of 5.5 web page visits per hour (see Figure 2.4). This seems to be a more reasonable number for our average web site visitors per hour.
Figure 2.4 Computing what appears to be a more correct average number of website visits (after eliminating questionable data).
Please don’t misunderstand this example. This is not about removing data in a set of observations that we just don’t like or removing data to make our conclusions look better. This is about intelligently eliminating data that we truly believe was captured in error or, in the case of text analytics, is not related to the topic at hand but was perhaps collected because we cast too wide of a net in our collection process. But as Charles Babbage was once quoted as saying: “Errors using inadequate data are much less than those that use no data at all. [2]”
Our point is that we would rather eliminate what we believe is erroneous than allow what we know is erroneous to influence our results.
Let’s look at another example (perhaps a bit more relevant to text analytics). Getting onto Twitter, we did a simple search (from the twitter.com search box) for “Apple.” As this book was written, there were rumors flying around Twitter and the Internet that Apple was preparing to launch a 12.9-inch screen for its next iPad, so we thought we would quickly check to see if we could come up with a compelling wheat/chaff example around “Apple.” Table 2.2 shows what we found (there are many more tweets; this is just a collection of the first seven tweets that showed up on our search).
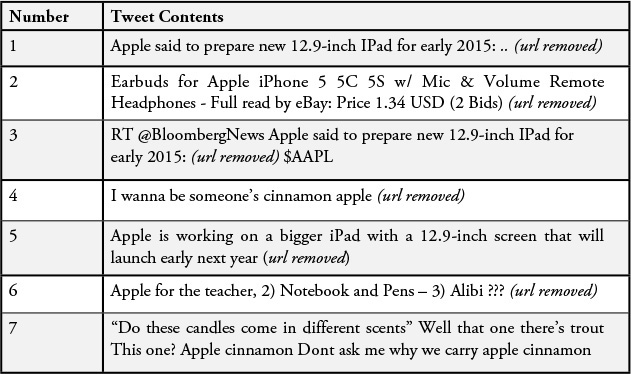
Clearly, tweets number 1, 3, and 5 refer to the rumor about the size of Apple’s iPad. And while tweet number 2 is about Apple products being sold on eBay, these products aren’t particularly relevant to the analysis at hand (which is the reaction to the announcement about the screen size). Tweets number 4, 6, and 7 clearly have nothing to do with Apple (the company) and are completely irrelevant to the analysis we need to do here. So how do we solve this? We used a regular expression.
Regular Expressions
When we are looking to cleanse a dataset or limit the amount of data we collect as part of our gathering process, we need a simple way to indicate the data that we’d like to keep and which part of the data we want to discard. One way to specify this is with a regular expression.
A regular expression is a special text string for describing a search pattern. For those familiar with Microsoft Windows and the concept of wildcards, think of regular expressions as an advanced way to specify wildcards. If you’re not familiar with wildcards, perhaps you’ve seen computer-savvy users list a set of files in a given Windows folder or directory by using the following command:
dir *.jpg
This is a shorthand notion for saying we want all of the files that end in .jpg or that are JPEG files (or pictures). The asterisk (*) indicates that any character will match (in this case) the filename, but that the file type must be .jpg. We could just as easily look for files that contain a specific prefix in their filename; for example:
PG32*.jpg
This command would give us all of the files that begin with PG32 and have a file type of .jpg. In this case, names such as the following all match this regular expression and, again, limit the number of files we see in a directory listing:
PG324356.jpg
PG3234.jpg
PG32-savedfile.jpg
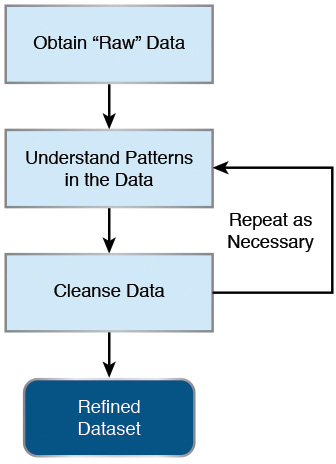
Processing unfiltered (noisy) data uses similar techniques and relies on knowledge of regular expressions as a means to specify what part of the dataset we want to keep and which to remove. Before we dive into this topic, it’s important to understand that the cleaning process may take several iterations before it is complete (see Figure 2.5). Even with several iterations, we may never get it 100% perfect. Remember, the goal is to take a dataset that is presumed to be noisy (that is, it contains data that is irrelevant to what we are looking to understand) and clean it in such a way that the majority of what we are going to analyze contains data directly relevant to the task at hand.
For example, in Table 2.1, tweets about apple (the fruit) or candles (numbers 4, 6, and 7) are irrelevant and should be removed from the analysis.
So assuming we have a file with a list of tweets (as shown in Table 2.1), our first step at cleaning the data is to look for tweets that contain information about Apple (the corporation) as opposed to anything else. Remember, when this dataset was created, we did a Twitter search on just the word apple. Because we are interested in discussions around the latest iPad rumors, it stands to reason we should look only at tweets that contain apple (the whole dataset) and ipad.
While this book is not about tools and specific software packages, we show some examples using a number of these utilities. Please note that, as a social media analyst, you are unlikely to use commands such as these directly. You are more likely to use open source or commercial tools for this purpose. However, the purpose of this section is to provide you with an understanding of how some of these tools work and how to express your requests in those other tools.
One of the tools frequently used by data scientists (and Linux system administrators) is called egrep. This program, which stands for Extended Global Regular Expressions Print, is part of most, if not all, Linux platforms (and is also widely available for Microsoft distributions). It scans any specified file, line by line, and returns all of the lines that contain a pattern matching a given regular expression.
Figure 2.6 shows an example of this Linux utility for text manipulation.
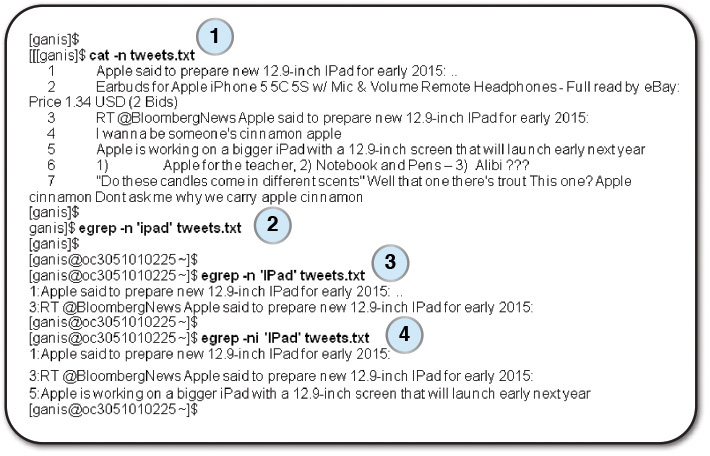
Let’s look closer at how regular expressions work. Figure 2.6 shows four steps in an attempt to look at some data we collected on some of Apple’s iPad/iPod products.
1. In step 1 of Figure 2.6, we have our collected raw tweets in a file called tweets.txt. For the purposes of this demonstration, we use the Linux cat command to print them to the screen (with line numbers) so we can better understand our data.
2. At step 2, we use the egrep program to look for the word ipad in any of the lines of the file. If the program finds this word, it will print out the line (with the line number using the -n option). Practically, we wouldn’t use the -n option because we would probably issue the command as follows:
egrep 'ipad' tweets.txt > refined.tweets.txt
This would run the egrep program and print each line in the file tweets.txt that contained the word ipad (ignoring the other lines). Rather than print them to the screen as we do here, we would redirect the output to a new file called refined.tweets.txt, thus creating a refined dataset that we will process later.
In any case, you’ll notice from step 2 in Figure 2.6 that the egrep command produced nothing (there were no matches). Why is that? Looking closely at the data (step number 1), we see that the tweet in line 1 uses the word iPad, but the tweeter used ipad (all lowercase) instead of Ipad, so matching letter for letter, including case, there was no match.
3. In step 3, we see that pattern matching is more than just looking for similar letters; we have to be a bit more exacting. In step 3 we reissue the command (remember, we said that data cleansing is an iterative process), this time using IPad as our filter. The output of that command yields a cleansed dataset of two tweets that contain the word IPad. It’s progress!
The problem is that there are many ways to express words. Sometimes people use all capitals or all lowercase. The word iPad appears in what a programmer would call “CamelCase.” This is the practice of writing compound words or phrases in which every word or abbreviation begins with a capital letter (thus, the hump in a camel’s back). Examples are commonly used words such as iPhone, FedEx, and McDonald’s.
So how do we solve this? One brute-force approach is to specify all of the combinations we’d like to catch in our filtered stream, but that could be not only confusing but also complicated and error prone.
4. The simplest solution is to just assume that case doesn’t matter. Using the -i option of egrep (which indicates that case should be ignored), our command now produces all of the tweets in the sample that we would expect (with someone referring to an IPad while others refer to an iPad).
Notice that by simply using the word ipad with the egrep command, we eliminate all of the other spurious tweets as well.
A Few Words of Caution
Be careful with the filters you use for your data. You may initially look at your original dataset and assume that because people are using the words IPad and iPad, you can simply filter on the ip part of the word, using, for example:
egrep 'ip' tweets.txt
This command would inadvertently give you the following output:
1: Apple said to prepare new 12.9-inch IPad for early 2015: ..
2: Earbuds for Apple iPhone 5 5C 5S w/ Mic & Volume Remote
Headphones - Full read by eBay: Price 1.34 USD (2 Bids)
3: RT @BloombergNews Apple said to prepare new 12.9-inch IPad for
early 2015:
5: Apple is working on a bigger iPad with a 12.9-inch screen that
will launch early next year
Notice the introduction of tweet number 2 (about the earbuds for an Apple iPhone) into your mix. That may be a correct dataset if you are looking to build a dataset about Apple products, but in this case, the iPhone discussion is irrelevant to the discussion about the iPad. It may be a simple example, but hopefully it points out a possible pitfall you could fall prey to.
It’s Not What You Say but WHERE You Say It
Sometimes we need to filter our datasets based on the context in which a word or phrase is used. For example, during one of our engagements, we were trying to understand the discussions being held around a conference called “Sapphire Now.” According to its Twitter account, it is “The world’s premier business technology conference around business technology trends and innovations.” When we first started collecting data, we simply searched on the word sapphire expecting to find all of our collected tweets referring to the show.
We forgot about:
![]() Sapphire, the gem
Sapphire, the gem
![]() Sapphire, the liquor
Sapphire, the liquor
![]() Sapphire, the color
Sapphire, the color
![]() and so on
and so on
So in the cleansing of this data, we had to look at all of our tweets that referenced sapphire and select just the ones that dealt with the conference or technology in general. In other words, the use of the word sapphire in the context of technology.
Using the sample dataset we had previously, we had the same problem. We had a set of data about “apple,” and it came in a few “flavors”:
![]() Apple, the corporation (and its products)
Apple, the corporation (and its products)
![]() Apple, the fruit
Apple, the fruit
![]() Apple, as a sign of affection
Apple, as a sign of affection
![]() No doubt there would be others
No doubt there would be others
One way we could sort out the data was to look for the word apple in the dataset and select just those tweets that discussed the iPad (or any of Apple’s products).
Our egrep command could look something like this:
egrep -inh '(apple).*(ipad)' tweets.txt
In this case, we specify that we want all tweets that contain the word apple (remember, we use the -i option of egrep to ignore case) and then anywhere following that word (that’s the use of the asterisk) the word ipad. The output of this command yields:
1: Apple said to prepare new 12.9-inch IPad for early 2015:
3: RT @BloombergNews Apple said to prepare new 12.9-inch IPad for
early 2015:
5: Apple is working on a bigger iPad with a 12.9-inch screen that will
launch early next year
Obviously, as before, specifying (apple).*(ip) would have included the tweet about the iPhone. The point is that looking for specific words when other keywords are present allows us to understand (or at least assume) our search words are being used in the proper context.
Many search engines allow for the filtering of keywords when other words are within a certain boundary (for example, if we see the word apple, the word ipad must be seen within three words; otherwise, it will not be considered a match).
Summary
What we discussed in this chapter could loosely be called the process of data cleansing. This is essentially the process of detecting and removing inaccurate data from a dataset (or database). It’s an essential step in feeding our more complex “downstream” steps of analysis and interpretation. While we took you through some relatively simple examples, we hope we made our point: The accuracy of any analysis is only as good as its weakest link (if your datasets are corrupt, or inaccurate, the error or inaccuracies will only be magnified later). If you look to minimize the corruption or inaccuracies, hopefully the magnification of the minimized error won’t be noticeable or too large as to skew your results in the wrong direction.
The question “How do we know if we have the right data?” is a difficult one to answer. The process of data cleansing, like the whole process of analysis, is iterative in nature (we discuss this issue further in Chapter 12, where we discuss things that can go wrong). At some point we have to decide that “enough is enough.” If we’ve passed over the data three or four times in an attempt to clean it, and each pass produces less and less cleaning, repeating the process becomes a question of “Is it worth continuing to clean with less and less of a result?” There is no simple answer to that question other than your having a gut feeling that your data is ready for the next step.
Endnotes
[1] Lynd, Robert. The Orange Tree: A Volume of Essays. Metheun, 1926.
[2] Quote attributed to Charles Babbage (https://en.wikiquote.org/wiki/Charles_Babbage).