
Chapter 19. Fast or Right?
Thus, though we have heard of stupid haste in war, cleverness has never been seen associated with long delays.
—Sun Tzu
You have undoubtedly heard that when given the choices of speed (time), cost, and quality, we can only ever choose two. This classic statement is a nod to the tradeoffs inherent in attempting to optimize the time, cost, and quality triad. In maximizing one of these variables—say, time (as in focusing on a fast delivery)—we must either relax our quality or cost boundary. Put another way, we need to either hire more people to deliver faster or cut corners on quality to deliver on time.
In this chapter, we discuss the general tradeoffs made in business, and specifically in the product development life cycle. We also discuss how these tradeoffs relate to scalability and availability. Finally, we provide a framework for thinking through decisions on how to balance these three objectives or constraints, depending on how you view them. This framework will give you a guide by which you can assess situations in the future and make the best decisions possible.
Tradeoffs in Business
The speed, quality, and cost triumvirate is often referred to as the project triangle. It provides a good visual representation of how these three attributes are inextricably connected, and how decisions with regard to one attribute impact the others. Several variations on this illustration also include scope as a fourth element. This variation is depicted by a triangle, in which the legs are speed, quality, and cost, and scope is in the middle. We prefer to use the traditional speed/cost/quality project triangle and define scope as the size of the triangle. This conception is represented in Figure 19.1, where the legs are speed, cost, and quality, and the area of the triangle is the scope of the project. If the triangle is small, the scope of the project is small and thus the cost, time, and quality elements are proportional. The representation is less important than the reminder that a balance among these four factors is necessary to develop products.
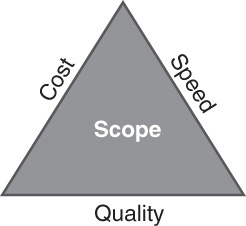
Ignoring any one of the legs of the triangle will cause you to deliver a poor product. If you ignore the quality of the product, a feature may lack the desired or required characteristics and functionality or the product may be so buggy as to render it unusable. If you ignore the speed element, your competitors are likely to beat you to market and you will lose the “first mover” advantage and be perceived as a follower rather than an innovator. The larger the scope of the project, the higher the cost, the slower the speed to market, and the more effort required to achieve a quality standard. Any of these scenarios should be worrisome enough for you to seriously consider how you and your organization actively balance these constraints.
To completely understand why these tradeoffs exist and how to manage them, you must first understand their definitions. We will define cost as any related expense or capital investment that is utilized by or needed for the project. Costs include such direct charges as the number of engineers working on the project, the number of servers (real or virtual) required to host the new service, and the marketing campaign for the new service. They also include indirect or allocated costs such as an additional database administrator necessary to handle the increased workload caused by another set of databases and the additional bandwidth utilized by customers of the feature. Why include these allocated costs? The answer is that by spending time on performance of the feature, you may find ways to cut hardware costs, network bandwidth requirements, maintenance headcount, and other expenses. Time spent engineering a solution may reduce the cost of supporting or maintaining that solution.
For the definition of quality, we focus on the appropriateness of the feature to meet the needs of the marketplace. A feature launched with half of the true market demand for functionality is not likely to generate as much interest (and resulting revenues) from customers as one that fully meets the expectations of potential users. Included in our definition is the notion of defects within a product, as any “buggy” solution will by definition be below the expectations of the target market. Thus, the faster a solution is released, assuming constant cost, the less likely it is to meet market expectations in terms of capability (feature completeness relative to need) or usability (defects presenting difficult usage or interfaces). Quality can also be affected by how well we test our solutions for appropriateness prior to launch using both automation and manual techniques. Organizations that skimp on tools for testing cannot utilize their testing engineers as efficiently as their more generous counterparts.
For the definition of speed, we will use the amount of time that a feature or project takes to move from “ideation” (the identification of a potential need and resulting solution) within the product development life cycle to release in production. We know that the life cycle doesn’t end with the release to production; in fact, it continues through support and eventually deprecation. However, those phases of the feature’s life are typically a result of the decisions made much earlier. For example, rushing a feature through the life cycle without ample time being given to design considerations will significantly increase the cost to support the feature in production.
Scope, then, is just the functional outcome, per Figure 19.1, of time, cost, and quality. An increase in any dimension while holding the others constant increases the area of the triangle. Spending time or money on non-market-facing functionality, such as long-term cost of ownership considerations, increases scope. Modifying underlying hardware or software infrastructure, such as the replacement of databases or persistence technology, modifies scope by increasing time and/or costs while potentially not affecting the overall quality of the product.
We use the project triangle to represent the equality in importance of these constraints. The two diagrams in Figure 19.2 represent different foci for different projects. The project on the left has a clear predilection for faster speed and higher quality at the necessary increase in cost. This project might be something that is critical to block a competitor from gaining market share. Thus, it needs to be launched by the end of the month and be full featured in an attempt to beat a competitor to market with a similar product. The cost of adding more engineers—possibly more senior engineers and more testing engineers—is worth the advantage in the marketplace with your customers.
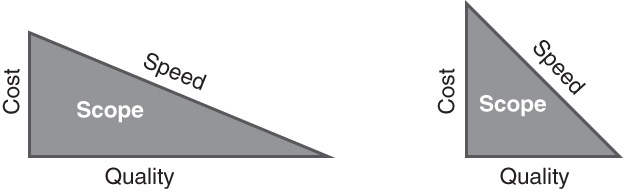
The project on the right in Figure 19.2 focuses on increased speed to market with a lower cost point, at the expense of reduced quality. This project might be something necessary for compliance where it is essential to meet a deadline to avoid penalties. There are likely no revenue-generating benefits for the feature; therefore, it is essential to keep the costs as low as possible. This project might be the modern-day equivalent to a Y2K bug, where the fix does not need to be full functioned but rather simply needs to perform the basic functionality by the specified date with minimal cost.
Success in a technology business is predicated on making tough decisions about time, cost, and quality. Often, these decisions are made via a well-thought-out process that seeks to understand the pros and cons of giving more or less time, money, or people to certain projects. As we will discuss later in this chapter, there are several processes of varying complexity that you can use to help make these decisions.
While each leg of the project triangle is important, the relationships in tradeoffs are not always linear. A perfect example of this is the Mythical Man Month example, in which a 5% increase in cost (effort or headcount) is not likely to represent a 5% decrease in time to market. Obviously, scope is increased in this case as effort increases significantly, but without an equal reduction in speed. Understanding that these tradeoffs aren’t always proportional helps inform business decisions regarding tradeoffs. Why face significantly higher costs for slightly shorter delivery times? Sometimes such a decision may be wise, but for steady-state businesses it probably does not make sense.
Relation to Scalability
Decisions we make about the non-market-facing capabilities of our solutions are embedded within the notion of scope in the project triangle. We may decide, for instance, to forgo designing and deploying a horizontally scalable solution until we better understand the market adoption forces. Such a decision helps us to reduce the time to market of the solution and the effort (cost) to produce a solution. In doing so, we reduce the scope of the project but take on longer-term liabilities associated with rework of the product to meet longer-term market growth needs. Conversely, if we design and implement a horizontally scalable solution it will increase the time to market and cost of the solution without a beneficial impact to short-term market adoption expectations. Scope is increased overall with such an approach.
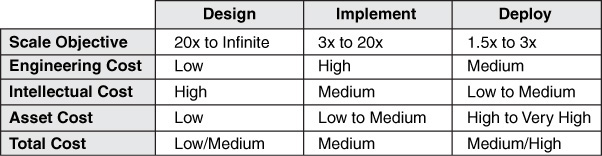
The primary issue to be pondered here is how quickly your product or solution will be adopted by the market and whether you have implemented enough scale to meet the demand associated with each point on the adoption curve. Unfortunately, most of us aren’t gifted with the ability to accurately forecast adoption of products that have yet to be launched. Nevertheless, we can hedge our bets in this area by recognizing the inherent cost tradeoffs between designing a solution to scale, implementing a solution to scale, and deploying a solution to scale. Here we use the term design to refer to the process of describing how a solution should scale through architectural documentation. The cost of such an exercise is high in terms of intellectual engagement, but low in terms of the effort needed to actually implement or deploy the architecture. As such, the overall cost to describe how we expect a solution to scale is relatively low and is something we should consider for any solution we expect to gain widespread acceptance by a large market. Having this blueprint for implementation in our back pocket will help should our solution be rapidly adopted, as we can quickly schedule the real work (coding) and the equipment purchases or cloud leases (deployment) to be successful.
Figure 19.3 describes these tradeoffs in relative terms as well as the target goals for each. The D-I-D matrix is useful in thinking about the goals for how much headroom you should plan for in each of the design, implement, and deploy phases.
How to Think About the Decision
There are a variety of methods to choose from when you need to determine the appropriate tradeoffs among speed, cost, and quality. You can choose to rely on one of these methods, or you can learn them all so that you use each in the most appropriate manner. Unfortunately, no decision process will ever be able to guarantee that you reach a correct decision because often there is no correct decision; each approach has different pros and cons.
Our goal here is to arm you with several methodologies so that you can make the best decision based on the information that you have today. We recommend one of four methods to our clients.
The first method is the one most closely aligned with Agile principles—namely, to prefer speed and small releases over everything else. At its heart, Agile is a process focused on discovery. It assumes incomplete knowledge about the true requirements of a market and, therefore, espouses end-user interactions as the primary means of discovering the true market need. Smaller and faster is better in Agile. The sooner we can get something into the customers’ hands, the sooner we can learn what needs to be augmented, what needs to be fixed, and what works well as is. To be successful with this approach, we must focus on the absolute minimum viable product or feature set necessary for any release. Describing this strategy in terms of the project triangle, the initial triangle is always small. Time is short, cost and effort are small, and, because we don’t know the market need, the “quality” leg is similarly small. We then iteratively expand “quality” by changing our direction to sense the desired functionality for adoption. This has an iterative effect on the cost of the project over time as well as the effort. Our triangle “grows” in size with each release. In some cases, we may replace features in a release that did not gain adoption with new features.
Unfortunately, even Agile methods require tradeoffs. What do we do when we need to cut down stories to size a release for a sprint? Three approaches may be used to facilitate decision making with both Agile methods and other development methodologies. The first approach is essentially the same gut feel method described in Chapter 16, Determining Risk. The second method is to make a list of pros and cons for each constraint. The third method is what we call a decision matrix. It involves constructing a well-thought-out ranking and analysis of the important short- and long-term factors under consideration and associating them with the speed, cost, and quality tradeoffs. If that last one sounds confusing, don’t worry; we’ll go through it in more detail in a few paragraphs.
Gut feel suffers from a high level of inaccuracies and the inability to scale the solution in large organizations. That said, it has its place in small decisions where the cost of making a decision is proportional to the level of investment in the product itself. Small investments in effort should not be overly burdened by large investments in process.
The second, more formal method of tradeoff analysis is comparison of pros and cons. Using the product triangle, list the pros and cons of each leg modification. As an example of how this works, let’s assume you are trying to making a decision about what to do with a payment feature on your Web site. The following may be some of the tradeoffs:
1. Increase engineers allocation
• Pros: Faster payment feature development; better feature design
• Cons: Other features suffer from reallocation; cost allocated to feature increases
2. Speed feature into production
• Pros: Fulfill business need for no more manual processing
• Cons: Possibly weaker design; fewer contingencies thought through; increased cost in hardware
3. Reduce quality testing
• Pros: Meet business timeline
• Cons: More unidentified and/or unfixed bugs
The next step is to analyze the pros and cons to determine the best approach. One widely used approach is to apply weights (impact) to the pros and cons and determine a mathematical outcome. A simpler approach is to simply look at the preponderance of information and make an informed decision. Again, effort should be proportional to the value of the decision. Larger decisions likely are worth the extra cost of a methodical weighing of pros and cons.
The third method of tradeoff analysis is a more formal process that builds on the mathematical approach of the pros-and-cons method. In this process, you take the tradeoffs identified and add to them factors that are important in accomplishing the project. At the end of the analysis, you have a score that you can use to judge each tradeoff based on the metrics that you deem most important for your organization. As stated earlier, we cannot guarantee that you will make a correct decision when using this (or any other) approach, because factors that may impact you in the future might not be known at this point. However, this method provides some reassurance that you have made a decision that is based on data and is the best one you can make at this time.
Let us continue with the example of a payments feature on your Web site to see how this analytical approach works. In addition to the pros and cons, we need to specify the factors that are most important to us in accomplishing this feature. Our work results in identification of the following factors:
• Meet the business goal of launching by the end of the month.
• Maintain availability of the entire system at 99.99%.
• The feature should scale to 10× growth.
• The other product releases should not be pushed off track by this effort.
• We want to follow established processes as much as possible.
Now we must rank order these factors to find out which ones are the most important. In Figure 19.4, the tradeoffs are listed down the left column and the factors across the top of the matrix. These factors are sorted and have a weight below each factor. For simplicity, we used 1 through 5, as there are five factors. For more elaborate matrices, you can use a variety of scales, such as 1, 3, 9, or allocation out of a 100-value sum, where you have 100 points to allocate among the factors (one may get 25, whereas others may get 3).
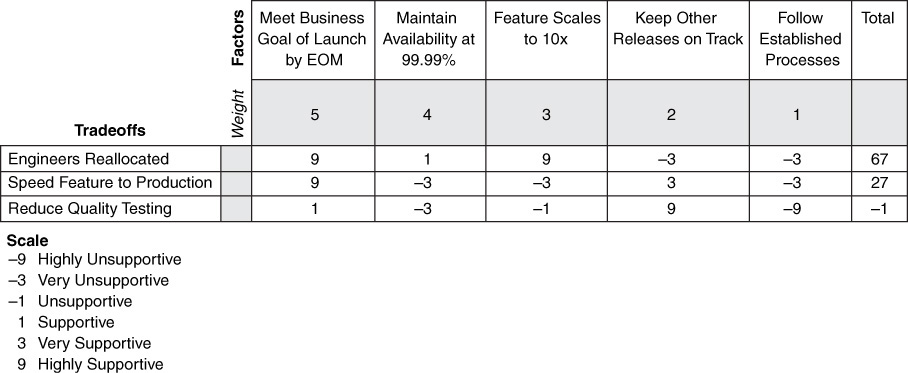
After the matrix is created, you need to fill in the middle, which is the strength of support that a tradeoff has on a factor. Here we use a scale from –9 to 9, with increments of 1, 3, –3, and –1. If a tradeoff fully supports a factor, it would receive a score of 9. If it somewhat supports the factor, it gets a 3. If it is unsupportive of the factor, in which case it would cause the opposite of the factor, it gets a negative score; the higher this negative score, the more it is unsupportive. For example, the tradeoff of Reduce Quality Testing for the feature has a –9 score for Follow Established Processes in Figure 19.4, because it clearly does not follow established processes of testing.
After the matrix is filled out, we can perform the calculations on it. The formula is to multiply each score in the body of the matrix by the weight of each factor and then sum these products for each tradeoff, thereby producing the total score. Using the Engineers Reallocated tradeoff, we have a formula as depicted in Figure 19.5.
The total score for this tradeoff in the equation in Figure 19.5 is 67. This formula is calculated for each tradeoff. Armed with the final score, we can analyze each tradeoff individually as well as all the tradeoffs collectively. From this sample analysis, we decide to find a way to allow more time to be spent on quality testing while proceeding with reallocating engineers and expediting the feature into production.
Fast or Right Checklist
• What does your gut tell you about the tradeoff?
• What are the pros and cons of each alternative?
• Is a more formal analysis required because of the risk or magnitude of the decision?
• Is there a benefit from reducing quality and effort to produce a product faster and learn from the market (discovery)?
• If a more formal analysis is required:
![]() What are the most important factors? In Six Sigma parlance, these are critical to quality indicators.
What are the most important factors? In Six Sigma parlance, these are critical to quality indicators.
![]() How do these factors rank compared to each other—that is, what is the single most important factor?
How do these factors rank compared to each other—that is, what is the single most important factor?
![]() What are the actual tradeoffs being discussed?
What are the actual tradeoffs being discussed?
![]() How do these tradeoffs affect the factors?
How do these tradeoffs affect the factors?
• Would you feel comfortable standing in front of your board explaining your decision based on the information you have today?
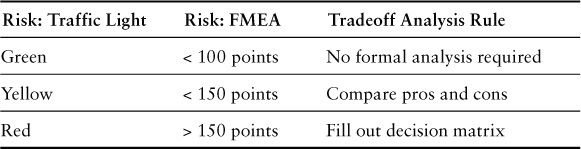
We have given you a reason to prefer speed for the purposes of discovery and three methods of analyzing the tradeoffs from balancing the cost, quality, and speed constraints. It is completely appropriate to use all three of these methods at different times or in increasing order of formality until you believe that you have achieved a sufficiently rigorous decision. Two factors that you might consider when deciding which method to use are the risk of the project and the magnitude of the decision. The risk should be calculated by one of the methods described in Chapter 16. There is not an exact level of risk that corresponds to a particular analysis methodology. Using the traffic light risk assessment method, projects that would be considered green could be analyzed by gut feeling, whereas yellow projects should at least have the pros and cons compared as described in the pros-and-cons comparison process earlier. Examples of these tradeoff rules are shown in Table 19.1. Of course, red projects should be candidates for preparation of a fully rigorous decision matrix. This is another great intersection of processes where a set of rules to work by would be an excellent addition to your documentation.
Conclusion
In this chapter, we tackled the tough and ever-present balancing act between cost, quality, speed, and scope. The project triangle is used to show how each constraint is equally important and worthy of attention. Each project will have a different predilection for satisfying one or more of these constraints. Some projects have a greater need to satisfy the “reduce cost” goal; in others, it is imperative that the quality of the feature be maintained even at the detriment of cost, speed, and scope.
The cost of a feature or project includes both the direct and indirect costs associated with. It can become a fairly exhaustive effort to attempt to allocate all costs with a particular feature, and this exercise is generally not necessary. Rather, it typically suffices to be aware that there are many levels of costs, which occur over both the short and long terms. The definition of quality includes both the amount of bugs in a feature and the amount of full functionality. A feature that does not have all the functions specified is of poorer quality than one that has all the specified features. Speed can be defined as the time to market or the pace at which the feature moves through the product development life cycle into production but not beyond. Post-production support is a special case that is more a cause of cost, quality, and speed tradeoffs, rather than a part of them.
As business leaders and technology managers, we are constantly making tradeoff decisions among these three constraints of cost, quality, and speed. We are well aware of some of these tradeoffs, but others are more subliminal. Some of these decisions occur consciously, whereas others are subconscious analyses that are done in a matter of seconds.
There is a direct relationship when these constraints are applied to infrastructure or scalability projects. In contrast, there is an indirect relationship when decisions made for features affect the overall scalability of the system many months or years later because of predictable—and in some cases unforeseen—factors.
Within Agile environments, speed (time to market) should always trump other concerns, with a focus on limiting the overall scope of a project primarily by limiting quality. In this context, quality addresses market fit. This focus helps speed initiatives to market so that we can collect real customer feedback (in terms of usage) on our products. In so doing, we hope to make better-informed decisions in the future.
Whether you employ Agile methods or not, you will still find yourself needing to make tradeoffs among cost, quality, and speed. To help you make these decisions, we introduced three methods for decision analysis: the gut feel method (first introduced in the discussion of risk), a pros-and-cons comparison, and a rigorous decision matrix that provides formulas to calculate scores for each tradeoff. Although we conceded that there is no correct answer possible due to the unknowable factors, there are certainly best answers that can be achieved through rigorous analysis and data-driven decisions.
As we consider the actual decisions made on the tradeoffs to balance cost, quality, speed, and scope, as well as the method of analysis used to arrive at those decisions, the fit within your organization at this particular time is the most important aspect in selecting a specific decision-making process. As your organization grows and matures, it may need to modify or augment these processes, make them more formal, document them further, or add steps that customize them more for the company. For any process to be effective, it must be used, and for it to be used, it needs to be a good fit for your team.
Key Points
• There is a classic balance among cost, quality, and speed in almost all business decisions.
• Technology decisions, especially in the product development life cycle, must balance these three constraints daily.
• Agile methods tend to have a bias toward speed for the purposes of developing market insights (discovery). They do so by reducing scope/quality (quality is defined as market fit here) to gain insights at an earlier stage in the product development life cycle.
• Each project or feature can make different allocations across cost, quality, and speed.
• Cost, quality, and speed are known as the project triangle because a triangle represents the equal importance of all three constraints.
• There are short- and long-term ramifications of the decisions and tradeoffs made during feature development.
• Tradeoffs made on individual features can affect the overall scalability of the entire system.
• Technologists and managers must understand and be able to make the right decisions in the classic tradeoff among speed, quality, and cost.
• There are at least three methods of performing a tradeoff analysis: gut feel, pros-and-cons comparison, and decision matrix.
• The risk of the project should influence which method of tradeoff analysis is performed.
• A set of rules to govern which analysis method should be used in which circumstances would be extremely useful for your organization.