
Chapter 12
Inspecting Traffic Without Blocking It
An FTD device can block packets when you deploy it in Inline Mode. However, there are some scenarios where you may not want to block a packet right away but instead want to watch the traffic pattern, determine the effectiveness of your access rules or intrusion rules on live traffic, and then tune the overall access control policy accordingly. Sometimes, you want to analyze any suspicious activities on your honeypot and detect any potential attacks. Occasionally, the business continuity policy of your organization may demand passive detection rather than inline protection. In this chapter, you will learn how to deploy FTD to inspect traffic and detect any suspicious activities without dropping the traffic in real time.
Traffic Inspection Essentials
When you consider deploying FTD for detection-only purposes, you mainly have two choices—Passive Mode and Inline Tap Mode. The following sections emphasize the differences between various interface modes and monitoring technologies.
Passive Monitoring Technology
To understand the architecture of a passive deployment, you must be familiar with the underlying technologies, including the following:
![]() Promiscuous Mode: On an FTD device, when you configure an interface in passive mode, you set the interface into Promiscuous Mode. Promiscuous Mode allows an interface to see any packet in a network segment—even packets that are not aimed at that interface. This capability empowers an FTD device to monitor the network activities without being an active part of a network.
Promiscuous Mode: On an FTD device, when you configure an interface in passive mode, you set the interface into Promiscuous Mode. Promiscuous Mode allows an interface to see any packet in a network segment—even packets that are not aimed at that interface. This capability empowers an FTD device to monitor the network activities without being an active part of a network.
Figure 12-1 introduces Promiscuous Mode and SPAN port, which are technologies used in a passive FTD deployment.

![]() SPAN port: Some switch models can replicate traffic from multiple switch ports and send the copies to a specific switch port. An FTD device can monitor a network without being an active part of the network flow; this feature is called port mirroring. A switch port enabled with the port mirroring feature is known as the switch port analyzer (SPAN) port.
SPAN port: Some switch models can replicate traffic from multiple switch ports and send the copies to a specific switch port. An FTD device can monitor a network without being an active part of the network flow; this feature is called port mirroring. A switch port enabled with the port mirroring feature is known as the switch port analyzer (SPAN) port.
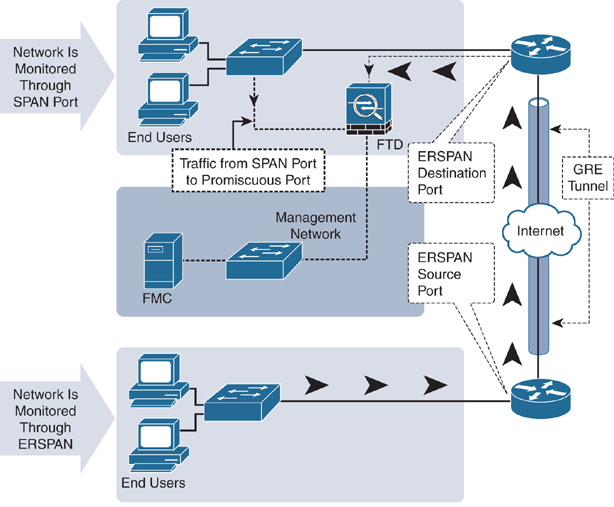
A SPAN port can receive mirrored traffic from the same Layer 2 switch. However, if you want to send the replicated traffic to multiple switches, you can use the Encapsulated Remote Switched Port Analyzer (ERSPAN) technology. ERSPAN transports mirrored traffic over a Layer 3 network by encapsulating it using the Generic Routing Encapsulation (GRE) tunneling protocol.
FTD supports inspection of both SPAN and ERSPAN traffic. However, the configuration examples in this chapter use only SPAN port.
Figure 12-2 illustrates the differences between two types of passive deployments—using SPAN and ERSPAN ports.
![]() TAP: A TAP is a network device that copies and transfers traffic to another system. Unlike a SPAN port on a switch, which is configured at the software level, a network TAP is dedicated hardware that is designed to replicate and transfer traffic. For an additional cost, a TAP offers numerous advantages over a SPAN port. One of the most important benefits is that a TAP is able to capture and copy all the traffic (including any errors) from a highly utilized network and transfer it to a monitoring device, such as FTD, without any packet drop.
TAP: A TAP is a network device that copies and transfers traffic to another system. Unlike a SPAN port on a switch, which is configured at the software level, a network TAP is dedicated hardware that is designed to replicate and transfer traffic. For an additional cost, a TAP offers numerous advantages over a SPAN port. One of the most important benefits is that a TAP is able to capture and copy all the traffic (including any errors) from a highly utilized network and transfer it to a monitoring device, such as FTD, without any packet drop.
A SPAN port, in contrast, drops packets if the utilization of a SPAN link exceeds its capacity. In a highly utilized network, if a SPAN port fails to transfer all the traffic from all the switch ports, an FTD device loses the complete visibility of a network and may miss detecting any suspicious activities.
Figure 12-3 shows two types of cabling that an FTD device supports. Both deployments are operational in detection-only mode.

Inline Versus Inline Tap Versus Passive
In Chapter 11, “Blocking Traffic Using Inline Interface Mode,” you learned about the operation of an FTD device in Inline Mode, which can block traffic based on the access control and intrusion rules you enable.
In contrast, if you apply a rule to block packets with certain conditions, an FTD device does not actually block the original traffic when you configure it in Inline Tap Mode or Passive Mode. It only generates an event and lets the packet go through the FTD.
Figure 12-4 provides a flowchart of various security components of the Firepower software that can block a packet. However, the Passive Mode and Inline Tap Mode deployments do not block any traffic; they only generate an event when a packet matches a rule.

From a user standpoint, a block or drop action on both modes—Passive and Inline Tap—has the same effect. For example, if a packet matches an access rule with a Block action, it triggers a connection event displaying the Block action, while the original packet goes through. Likewise, if a packet matches an intrusion rule with the Drop and Generate Event rule state, FTD displays the matching packets with the Would Have Dropped action and lets the traffic go through the FTD.
Although the outcomes are the same, the big advantage of Inline Tap Mode over Passive Mode is the ease of transition to the inline mode, when necessary. The physical cabling of Inline Mode and Inline Tap Mode is exactly same. If your FTD is currently deployed in Inline Tap mode, and you decide to switch to Inline Mode to block traffic in real time, you can do it simply by changing a setting in the GUI.
Best Practices for Detection-Only Deployment
Consider the following best practices before you deploy an FTD in Passive Mode:
![]() If your plan is to deploy an FTD device in Detection-Only Mode, so that you could observe any network activities and tune the security policies accordingly, you may choose Inline Tap Mode over the traditional Passive Mode. This allows you to switch to Inline Mode faster, without touching any physical cables.
If your plan is to deploy an FTD device in Detection-Only Mode, so that you could observe any network activities and tune the security policies accordingly, you may choose Inline Tap Mode over the traditional Passive Mode. This allows you to switch to Inline Mode faster, without touching any physical cables.
![]() If your ultimate plan is to deploy an FTD device in Detection-Only Mode permanently, you can choose Passive Mode over Inline Tap Mode to eliminate any chance of traffic interruption due to an accidental outage of the FTD device.
If your ultimate plan is to deploy an FTD device in Detection-Only Mode permanently, you can choose Passive Mode over Inline Tap Mode to eliminate any chance of traffic interruption due to an accidental outage of the FTD device.
![]() If the utilization of a network is medium to high, use a TAP instead of a SPAN port.
If the utilization of a network is medium to high, use a TAP instead of a SPAN port.
![]() Although an FTD device in Passive Mode cannot block traffic, you should still select an FTD model based on the throughput specification to ensure that the FTD device inspects all the traffic without dropping it.
Although an FTD device in Passive Mode cannot block traffic, you should still select an FTD model based on the throughput specification to ensure that the FTD device inspects all the traffic without dropping it.
Fulfilling Prerequisites
If you previously configured an FTD device as a firewall in Routed Mode, you need to remove any platform settings, IP addresses, and DHCP server configurations from the FTD data interfaces, as they are not necessary in Inline, Inline Tap, and Passive Modes.
Inline Tap Mode
Inline Tap Mode comes as an add-on feature to an inline set configuration. To enable Inline Tap Mode, at first, you have to perform all the steps to add an inline set in Inline Mode.
Configuring Inline Tap Mode
The following steps are necessary to create an inline set with Inline Tap Mode and to verify the operation:
![]() Part 1: Configuration
Part 1: Configuration
Step 1. Build an inline pair.
Step 2. Associate an inline pair with the inline set.
Step 3. Turn on the fault tolerance features.
Step 4. Enable Inline Tap Mode.
Step 5. Save the changes, and deploy the new settings.
![]() Part 2: Verification
Part 2: Verification
Step 1. Add an access rule with Block action.
Step 2. Save the changes, and deploy the new settings.
Step 3. Run traffic that matches the access rule.
Note
Except for Step 4 in Part 1—enabling Inline Tap Mode—all of the above steps are described and configured in Chapter 11. If you skipped that chapter, please read it now. This section discusses only the additional step—enabling Inline Tap Mode.
If your FTD is currently running in Inline Mode, follow these steps to enable Inline Tap Mode:
Step 1. Log in to the FMC GUI.
Step 2. Navigate to the Devices > Device Management page. A list of managed devices appears.
Step 3. Click the pencil icon next to the FTD device where you want to enable Inline Tap Mode. The device editor page appears.
Step 4. Select the Inline Sets tab. If you configured an inline set earlier, it appears here (see Figure 12-5).

Step 5. Click the pencil icon next to the inline set to modify the existing settings. The Edit Inline Set window appears.
Step 6. Select the Advanced tab.
Step 7. Enable the Tap Mode check box (see Figure 12-6).

Step 8. Click OK to return to the Inline Sets tab.
Step 9. Click Save to save the settings, and click Deploy to deploy them.
Verifying an Inline Tap Mode Configuration
Upon a successful deployment, you should be able to communicate from your inside host 192.168.1.2 to the outside server 192.168.1.200. The examples in this chapter use a TCP service, Telnet, to test connectivity and generate a Block event for it.
Note
This section assumes that the FTD device is running the same access control policy that you created in Chapter 11, which blocks any traffic destined for port 23 (Telnet). If you revoked that policy or skipped Chapter 11, please read it now to learn how to block Telnet traffic in Inline Mode.
After you deploy an access control policy to block traffic with destination port 23, try to Telnet into the outside system 192.168.1.200 from the inside host 192.168.1.2. You should be able to access the system successfully. You should also be able to view an event for the corresponding connections.
FTD generates only one event—for its Block action—when it is in Inline Mode because it logs an event at the beginning of a connection and is unable to see the rest of the connection. However, when an FTD device is in Detection-Only Mode, it generates multiple events—for Block and Allow actions—because it can see the entire connection without interrupting the flow.
Figure 12-7 shows two Block events that are generated in Inline Tap Mode and Inline Mode at the beginning of a Telnet connection.

If a communication attempt fails and the FMC does not indicate an error for it, you can begin troubleshooting by using the FTD CLI.
Example 12-1 confirms that the interface set is in Inline Tap Mode. The command output displays various components of an inline set configuration, such as member interfaces of an inline pair, their statuses, and advanced settings.
Example 12-1 Tap Mode Enabled on the INSIDE_OUTSIDE_PAIR Inline Set
> show inline-set
Inline-set INSIDE_OUTSIDE_PAIR
Mtu is 1500 bytes
Failsafe mode is on/activated
Failsecure mode is off
Tap mode is on
Propagate-link-state option is on
hardware-bypass mode is disabled
Interface-Pair[1]:
Interface: GigabitEthernet1/1 "INSIDE_INTERFACE"
Current-Status: UP
Interface: GigabitEthernet1/2 "OUTSIDE_INTERFACE"
Current-Status: UP
Bridge Group ID: 0
>
Example 12-2 demonstrates that the GigabitEthernet1/1 and GigabitEthernet1/2 interfaces are in Inline Tap Mode. Both of them are part of an inline pair called INSIDE_OUTSIDE_PAIR. The command output also provides detailed statistics about the packets.
Example 12-2 Status of Each Interface of an Inline Pair
> show interface GigabitEthernet 1/1
Interface GigabitEthernet1/1 "INSIDE_INTERFACE", is up, line protocol is up
Hardware is Accelerator rev01, BW 1000 Mbps, DLY 10 usec
Auto-Duplex(Full-duplex), Auto-Speed(1000 Mbps)
Input flow control is unsupported, output flow control is off
MAC address a46c.2ae4.6bc0, MTU 1500
IPS Interface-Mode: inline-tap, Inline-Set: INSIDE_OUTSIDE_PAIR
IP address unassigned
9241 packets input, 945431 bytes, 0 no buffer
Received 89 broadcasts, 0 runts, 0 giants
.
.
> show interface GigabitEthernet 1/2
Interface GigabitEthernet1/2 "OUTSIDE_INTERFACE", is up, line protocol is up
Hardware is Accelerator rev01, BW 1000 Mbps, DLY 10 usec
Auto-Duplex(Full-duplex), Auto-Speed(1000 Mbps)
Input flow control is unsupported, output flow control is off
MAC address a46c.2ae4.6bc1, MTU 1500
IPS Interface-Mode: inline-tap, Inline-Set: INSIDE_OUTSIDE_PAIR
IP address unassigned
9065 packets input, 924609 bytes, 0 no buffer
Received 30 broadcasts, 0 runts, 0 giants
Passive Interface Mode
A passive interface is simpler to configure than an inline set. You can use just one interface to receive traffic from a mirror port. An egress interface is not necessary, as an FTD does not forward traffic in Passive Mode.
Configuring Passive Interface Mode
An FTD device supports both SPAN and ERSPAN ports, but the ports require additional configuration on a switch or router. However, you can install a plug-and-play TAP that can mirror traffic without any additional software configuration.
The following section details the steps to connect an FTD passive interface with a SPAN port on a switch—one of the most common port mirroring options.
Configuring Passive Interface Mode on an FTD Device
To configure a passive interface on an FTD device, follow these steps:
Step 1. Log in to the FMC GUI.
Step 2. Navigate to the Devices > Device Management page. A list of managed devices appears.
Step 3. Click the pencil icon next to the device name where you want to enable the passive interface mode. The device editor page appears.
Step 4. On the Interfaces tab, select an interface that will function in Promiscuous Mode. The interface connects to a SPAN port on a switch. The Edit Physical Interface window appears. Figure 12-8 shows the configuration of GigabitEthernet1/1 interface as a passive interface.

Step 5. From the Mode dropdown, select Passive.
Step 6. Give the interface a name and select the Enabled check box.
Step 7. Click OK to return to the device editor page.
Step 8. Click Save to save the configuration, and click Deploy to deploy it.
Figure 12-9 shows an overview of the FTD interfaces. Note that you do not need to copy an IP address and security zone for a passive interface.

Configuring a SPAN Port on a Switch
If you are using a Cisco switch to transmit mirrored traffic to an FTD device, you have to define the source ports (the ports from which the traffic is copied) and a destination port (the port that sends duplicated traffic to an FTD device).
Example 12-3 shows the setup of a SPAN port on a Cisco switch. According to the following configuration, this switch receives traffic on the GigabitEthernet0/1 and GigabitEthernet0/2 interfaces, duplicates them, and retransmits the duplicated traffic through the GigabitEthernet0/8 interface.
Example 12-3 Essential Commands to Configure a SPAN Port
Switch(config)# monitor session 1 source interface gigabitEthernet 0/1
Switch(config)# monitor session 1 source interface gigabitEthernet 0/2
Switch(config)# monitor session 1 destination interface g0/8
Verifying a Passive Interface Mode Configuration
After you deploy configuration, initiate a Telnet connection from inside to outside systems. You will notice that, although the access control policy is configured to block Telnet traffic, FTD does not block any traffic in Passive Mode; it just generates events.
Figure 12-10 shows three Block actions that are generated in three different interface modes during three Telnet connection attempts.

If a passive interface on an FTD device does not see traffic, you need to check both devices—FTD and switch. The following examples demonstrate some commands that you run during investigation.
Example 12-4 offers two useful commands that you can run on an FTD device. First, enter the show nameif command to determine the active interfaces. Then you can run the show interface command with the interface to identify the interface status, mode, traffic statistics, and so on
Example 12-4 Verifying a Passive Interface
> show nameif
Interface Name Security
GigabitEthernet1/1 PASSIVE_INTERFACE 0
Management1/1 diagnostic 0
>
> show interface GigabitEthernet 1/1
Interface GigabitEthernet1/1 "PASSIVE_INTERFACE", is up, line protocol is up
Hardware is Accelerator rev01, BW 1000 Mbps, DLY 10 usec
Auto-Duplex(Full-duplex), Auto-Speed(1000 Mbps)
Input flow control is unsupported, output flow control is off
MAC address a46c.2ae4.6bc0, MTU 1500
IPS Interface-Mode: passive
IP address unassigned
289 packets input, 30173 bytes, 0 no buffer
Received 7 broadcasts, 0 runts, 0 giants
0 input errors, 0 CRC, 0 frame, 0 overrun, 0 ignored, 0 abort
0 pause input, 0 resume input
0 L2 decode drops
161 packets output, 17774 bytes, 0 underruns
0 pause output, 0 resume output
0 output errors, 0 collisions, 0 interface resets
0 late collisions, 0 deferred
0 input reset drops, 24 output reset drops
input queue (blocks free curr/low): hardware (991/894)
output queue (blocks free curr/low): hardware (1023/1018)
Traffic Statistics for "PASSIVE_INTERFACE":
104 packets input, 6520 bytes
0 packets output, 0 bytes
104 packets dropped
1 minute input rate 0 pkts/sec, 0 bytes/sec
1 minute output rate 0 pkts/sec, 0 bytes/sec
1 minute drop rate, 0 pkts/sec
5 minute input rate 0 pkts/sec, 0 bytes/sec
5 minute output rate 0 pkts/sec, 0 bytes/sec
5 minute drop rate, 0 pkts/sec
>
Example 12-5 provides two useful commands that can confirm the SPAN port status on a switch.
Example 12-5 Configuring and Verifying a SPAN Port
Switch# show running-config | include monitor
monitor session 1 source interface Gi0/1 - 2
monitor session 1 destination interface Gi0/8
Switch#
Switch# show monitor session 1
Session 1
---------
Type : Local Session
Source Ports :
Both : Gi0/1-2
Destination Ports : Gi0/8
Encapsulation : Native
Ingress : Disabled
Switch#
Analyzing Traffic Inspection Operation
If a host experiences any connectivity issues despite the FTD device being deployed in Detection-Only Mode, you can determine the root cause of an issue by analyzing the tracing information of a packet, as described in the following sections.
Analyzing a Connection Event with a Block Action
The following sections show how to analyze the packets that trigger connection events. There are two ways to analyze them: by capturing live traffic with the trace functionality and by running the packet-tracer tool.
Analyzing Live Traffic
Follow these steps to capture live Telnet traffic and analyze the flow of packets in Inline Tap Mode:
Step 1. Enter a capture rule with the trace keyword. Example 12-6 shows the use of the trace keyword with the capture command. It probes the inside interface and matches any packets with destination port 23. The Capturing - 0 Bytes message on the show capture command confirms that the process is running but has not seen a packet yet.
Example 12-6 Capturing Telnet Traffic with Tracing Information
> capture telnet_inside trace interface INSIDE_INTERFACE match tcp any any eq 23
>
> show capture
capture telnet_inside type raw-data trace interface INSIDE_INTERFACE [Capturing - 0
bytes]
match tcp any any eq telnet
>
Step 2. Initiate a Telnet request from the inside host to the outside server. Although you enabled an access rule to block Telnet traffic, the traffic is able to go through because the interface is in Inline Tap Mode.
Example 12-7 shows the capture of 13 packets with destination port 23 (Telnet). The output displays only three packets for brevity. Each packet has a sequence number on its left.
Example 12-7 Capturing Telnet Traffic
> show capture telnet_inside
13 packets captured
1: 01:56:01.756735 192.168.1.2.59358 > 192.168.1.200.23: S 1923550801:
1923550801(0) win 29200 <mss 1460,sackOK,timestamp 2340482 0,nop,wscale 7>
2: 01:56:01.757101 192.168.1.2.59358 > 192.168.1.200.23: . ack 2745314499
win 229 <nop,nop,timestamp 2340483 1541951>
3: 01:56:01.757239 192.168.1.2.59358 >
192.168.1.200.23: P 1923550802: 1923550829(27) ack 2745314499 win 229 <nop,nop,timestamp 2340483 1541951>
.
.
<Output_Omitted_for_Brevity>
Step 3. From the show capture output shown in Example 12-6, select a packet you want to trace by using its associated number on the left. Example 12-8 shows the tracing data for a Telnet packet. Note the final action of the flow: Access-list would have dropped, but packet forwarded due to inline-tap.
Example 12-8 Detail Tracing Data of a Telnet Packet
> show capture telnet_inside packet-number 1 trace
13 packets captured
1: 01:56:01.756735 192.168.1.2.59358 > 192.168.1.200.23: S 1923550801:
1923550801(0) win 29200 <mss 1460,sackOK,timestamp 2340482 0,nop,wscale 7>
Phase: 1
Type: CAPTURE
Subtype:
Result: ALLOW
Config:
Additional Information:
MAC Access list
Phase: 2
Type: ACCESS-LIST
Subtype:
Result: ALLOW
Config:
Implicit Rule
Additional Information:
MAC Access list
Phase: 3
Type: NGIPS-MODE
Subtype: ngips-mode
Result: ALLOW
Config:
Additional Information:
The flow ingressed an interface configured for NGIPS mode and NGIPS services will be
applied
Phase: 4
Type: ACCESS-LIST
Subtype: log
Result: WOULD HAVE DROPPED
Config:
access-group CSM_FW_ACL_ global
access-list CSM_FW_ACL_ advanced deny tcp any any object-group TELNET rule-id 268441600 event-log flow-start
access-list CSM_FW_ACL_ remark rule-id 268441600: ACCESS POLICY: AC Policy - Mandatory/1
access-list CSM_FW_ACL_ remark rule-id 268441600: L4 RULE: Shell Access
object-group service TELNET tcp
port-object eq telnet
Additional Information:
Result:
input-interface: INSIDE_INTERFACE
input-status: up
input-line-status: up
Action: Access-list would have dropped, but packet forwarded due to inline-tap
1 packet shown
>
Analyzing a Simulated Packet
You can also use the packet-tracer tool to simulate the flow of a Telnet packet through the FTD. The tool uses the active access control policy to simulate the packet flow.
Example 12-9 simulates a Telnet packet that would have dropped, but FTD forwards it due to the Inline Tap Mode setting.
Example 12-9 Simulating Telnet Traffic Through Inline Tap Mode
> packet-tracer input INSIDE_INTERFACE tcp 192.168.1.2 10000 192.168.1.200 23
Phase: 1
Type: ACCESS-LIST
Subtype:
Result: ALLOW
Config:
Implicit Rule
Additional Information:
MAC Access list
Phase: 2
Type: NGIPS-MODE
Subtype: ngips-mode
Result: ALLOW
Config:
Additional Information:
The flow ingressed an interface configured for NGIPS mode and NGIPS services will be
applied
Phase: 3
Type: ACCESS-LIST
Subtype: log
Result: WOULD HAVE DROPPED
Config:
access-group CSM_FW_ACL_ global
access-list CSM_FW_ACL_ advanced deny tcp any any object-group TELNET rule-id
268441600 event-log flow-start
access-list CSM_FW_ACL_ remark rule-id 268441600: ACCESS POLICY: AC Policy -
Mandatory/1
access-list CSM_FW_ACL_ remark rule-id 268441600: L4 RULE: Shell Access
object-group service TELNET tcp
port-object eq telnet
Additional Information:
Result:
input-interface: INSIDE_INTERFACE
input-status: up
input-line-status: up
Action: Access-list would have dropped, but packet forwarded due to inline-tap
>
Analyzing an Intrusion Event with an Inline Result
So far, you have seen how to analyze the connection events when an FTD device is deployed in Passive Mode or Inline Tap Mode. For an access rule with a Block action, the FMC shows a connection event with a Block action, while FTD allows the traffic to go through without an interruption. However, when a packet matches against an intrusion rule with Drop and Generate Events state, the FMC shows a reason for logging the connection as well.
Note
Because this chapter is about inspecting traffic without blocking it, this section takes an opportunity to demonstrate the behavior of an FTD device when you deploy an intrusion policy in Detection-Only Mode. It will help you understand and compare different actions in different interface modes. However, to learn about the configuration and troubleshooting of an intrusion policy, read Chapter 21, “Preventing Cyber Attacks by Blocking Intrusion Attempts.”
To understand various actions on connections and the reasons for their logging, this section shows how to deploy and analyze an FTD device in various interface modes with different intrusion policy settings. You will notice different behaviors on FTD when host 192.168.1.2 attempts to connect to a Telnet server 192.168.1.200 in different deployment scenarios.
Table 12-1 highlights the deployment scenarios (1, 2, and 6) when the FTD device would have dropped a packet. A gray down arrow in the Inline Result column confirms it (refer to Figure 12-12, which appears after the table). However, an FTD device blocks a connection when it meets all three conditions together—Interface Mode is inline, the intrusion rule state is set to Drop and Generate Events, and the intrusion policy is configured with the Drop When Inline option enabled. In this case (Scenario 5), the down arrow turns black.
Table 12-1 Inline Result Behavior in Various Deployment Scenarios
Scenario |
Interface Mode |
Intrusion Rule State |
Drop When Inline Option |
Connection Event (Action, Reason) |
Intrusion Event (Inline Result) |
1 |
Inline Tap |
Drop and Generate |
Enabled |
Allow, Intrusion Block |
Down arrow (Gray) |
2 |
Inline Tap |
Drop and Generate |
Disabled |
Allow, Intrusion Block |
Down arrow (Gray) |
3 |
Inline Tap |
Generate |
Enabled |
Allow, Intrusion Monitor |
Blank |
4 |
Inline Tap |
Generate |
Disabled |
Allow, Intrusion Monitor |
Blank |
5 |
Inline |
Drop and Generate |
Enabled |
Block, Intrusion Block |
Down arrow (Black) |
Inline |
Drop and Generate |
Disabled |
Allow, Intrusion Block |
Down arrow (Gray) |
|
7 |
Inline |
Generate |
Enabled |
Allow, Intrusion Monitor |
Blank |
8 |
Inline |
Generate |
Disabled |
Allow, Intrusion Monitor |
Blank |
Figure 12-11 shows different types of connection events in different deployment scenarios. Although the reasons for logging show Intrusion Block, FTD “allows” all these connections (in Scenarios 1, 2, and 6) due to its interface modes and intrusion policies.

Figure 12-12 shows three types of inline results—blank, gray arrow, and black arrow. Inline results appear blank when FTD does not drop the original packet but generates an event only. The gray down arrow (Scenarios 1, 2 and 6) indicates that the packet would have dropped, and the black arrow (Scenario 5) denotes a drop of the original packet. Modes that can trigger “Would Have Dropped” events are Passive Mode, Inline Tap Mode, and Inline Mode with the “Drop When Inline” option disabled. All the events in this example (and in the previous example) are created using the same client host, the same server host, and the same application protocol.

Example 12-10 confirms that the intrusion policy (Snort rule) of an FTD device would have dropped a Telnet packet, but FTD forwards it due to the Inline Tap Mode setting.
Example 12-10 Analyzing Telnet Traffic Through Inline Tap Mode
> show capture telnet_inside packet-number 1 trace
36 packets captured
1: 19:39:24.086177 192.168.1.2.40744 > 192.168.1.200.23: S 2884265905:
2884265905(0) win 29200 <mss 1460,sackOK,timestamp 6199376 0,nop,wscale 7>
Phase: 1
Type: CAPTURE
Subtype:
Result: ALLOW
Config:
Additional Information:
MAC Access list
Phase: 2
Type: ACCESS-LIST
Subtype:
Result: ALLOW
Config:
Implicit Rule
Additional Information:
MAC Access list
Phase: 3
Type: NGIPS-MODE
Subtype: ngips-mode
Result: ALLOW
Config:
Additional Information:
The flow ingressed an interface configured for NGIPS mode and NGIPS services will be
applied
Phase: 4
Type: ACCESS-LIST
Subtype: log
Result: ALLOW
Config:
access-group CSM_FW_ACL_ global
access-list CSM_FW_ACL_ advanced permit ip any any rule-id 268434432
access-list CSM_FW_ACL_ remark rule-id 268434432: ACCESS POLICY: AC Policy -
Default/1
access-list CSM_FW_ACL_ remark rule-id 268434432: L4 RULE: DEFAULT ACTION RULE
Additional Information:
This packet will be sent to snort for additional processing where a verdict will be
reached
Phase: 5
Type: NGIPS-EGRESS-INTERFACE-LOOKUP
Subtype: Resolve Egress Interface
Result: ALLOW
Config:
Additional Information:
Ingress interface INSIDE_INTERFACE is in NGIPS inline mode.
Egress interface OUTSIDE_INTERFACE is determined by inline-set configuration
Phase: 6
Type: FLOW-CREATION
Subtype:
Result: ALLOW
Config:
Additional Information:
New flow created with id 257, packet dispatched to next module
Phase: 7
Type: EXTERNAL-INSPECT
Subtype:
Result: ALLOW
Config:
Additional Information:
Application: 'SNORT Inspect'
Phase: 8
Type: SNORT
Subtype:
Result: DROP
Config:
Additional Information:
Snort Verdict: (block-packet) drop this packet
Result:
input-interface: INSIDE_INTERFACE
input-status: up
input-line-status: up
Action: Access-list would have dropped, but packet forwarded due to inline-tap
1 packet shown
>
Summary
This chapter explains the configuration and operation of various detection-only modes of an FTD device, such as Passive Mode, Inline Tap Mode, and Inline Mode with drop when the inline option is disabled. It also shows various command-line tools you can use to determine the status of interfaces and traffic.
Quiz
1. Which of the following interface modes does not block a packet?
a. Transparent Mode
b. Routed Mode
c. Inline Tap Mode
d. All of the above
2. Which of the following actions ensures the analysis of maximum traffic when it goes through an FTD device?
a. Using a SPAN port on a switch
b. Deploying a TAP to replicate traffic
c. Configuring Inline Tap Mode instead of Passive Mode
d. Any FTD model can handle all of the traffic and ensures 100% detection.
3. Which of the following statements is true?
a. Passive Mode can work with just one interface, whereas an inline set requires at least two interfaces.
b. An inline interface does not require that port mirroring features—such as TAP or SPAN port—be available.
c. Transition between Detection-Only Mode and Prevention Mode is faster and easier in Inline Tap Mode.
d. All of the above.
4. Which of the following commands shows whether an interface is set to Inline Tap Mode?
a. show inline-tap
b. show inline-set
c. show interface ip brief