
2. Building Your First Project
Xcode and Interface Builder help you craft applications for the iPhone SDK. This chapter introduces you to the basics of using these tools in your projects. You see how to build a simple Hello World project, compile and test it in the simulator, and then learn how to compile for and deploy to the device. You also discover some basic debugging tools and walk through their use as well as pick up some tips about handy compiler directives. This chapter also looks at how to submit to App Store and distribute via ad hoc. By the time you finish this chapter, you’ll have followed the application creation progress from start to finish and learned valuable tricks along the way.
Creating New Projects
If diving into SDK programming without a lifeline seems daunting, be reassured. Xcode makes getting started as simple as possible. It provides preconfigured projects that you can easily adapt while exploring the SDK. Since each of these projects is a fully working skeleton, all you need to do is add a little custom functionality to make that app your own.
To get started, launch Xcode and choose File > New Project (Command-Shift-N). The New Project template window (see Figure 2-1) opens, allowing you to select one of these application styles to get started.
Figure 2-1 The Xcode New Project template selection window.
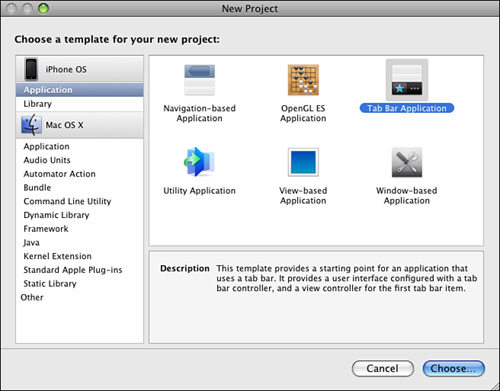
These six project styles are chosen to match the most common development patterns for iPhone. Your choices are
• Navigation-based Application—Usually based around lists and tables, navigation applications offer a series of selection choices, each choice sliding to a new screen. The bar at the top of the screen offers a Back button, letting you return to previous screens. Apple’s Contacts application is a navigation-based application.
• OpenGL ES Application—When programming with OpenGL ES, all you need is a view to draw into and a timer that offers an animation heartbeat. The OpenGL ES template provides these elements, letting you build your OpenGL ES graphics on top.
• Tab Bar Application—Apple’s iPod and YouTube applications offer typical examples of Tab bar applications. In these applications, users can choose from a series of screens by tapping buttons in a bar at the bottom of the application. For example, the YouTube application lets you choose from Featured videos, Most Viewed, Bookmarks, or the search pane. The Tab Bar Application template provides a skeleton that you can grow to add panes and their contents.
• Utility Application—Meant to be the simplest style of application, the Utility Application template creates a two-sided single-view presentation like the ones you see in the Stocks and Weather application. The template provides a main view and a flip view, which you can easily customize.
• View-based Application—The View-based template provides a skeleton that supports a single view. It provides a view controller to manage the view and an empty XIB to populate that view with custom GUI elements. This is the template you use later in this chapter to build your first Hello World application.
• Window-based Application—The window-based application offers the same template as the view-based one but without the view controller or view. You get an application delegate and a window and that’s about it. One advantage of choosing this template is that it’s relatively easy to strip out the Interface Builder elements should you prefer to build your iPhone applications completely from scratch.
Note
Apple offers sample code and tutorials at the iPhone Reference Library. The library is located at http://developer.apple.com/iphone/library/navigation/index.html; you must use your developer credentials to access its contents. In addition to sample code, you’ll find release notes, technical notes, Getting Started guides, Coding How-To’s, and more.
Building Hello World the Template Way
Xcode’s preconfigured template offers the easiest path to creating a Hello World-style sample application. In the following steps, you create a new project, edit it to say Hello World, and run it on the iPhone simulator. As you build your first Xcode project, you’ll discover some of the key development pathways.
Create a New Project
With the iPhone SDK installed, launch Xcode. Close the Xcode news page; it’s the window that says Welcome to Xcode and offers options like Create a new Xcode project. This window continues to appear until you uncheck Show at Launch before closing.
Note
If you ever change your mind about hiding the window, you can find it again by choosing Help > Welcome to Xcode.
To create the new project, choose File > New Project (Command-Shift-N). This opens the template selection window shown previously in Figure 2-1. Notice that there are currently just two sets of iPhone templates (called Application and Library in the left-hand column) available versus a dozen project styles available for the Macintosh. You can, in fact, add new iPhone templates to Xcode, and you learn how to do so later in this chapter. For now, choose Application if it has not already been selected for you.
Select View-based Application and click Choose. When Xcode prompts you to Save As, name the project HelloWorld and save it to your Desktop with Save. A new HelloWorld Xcode project window opens (see Figure 2-2). This project contains all the files you need to design an application centered on a primary view.
Figure 2-2 This brand-new HelloWorld project was created by choosing the View-based Application template.
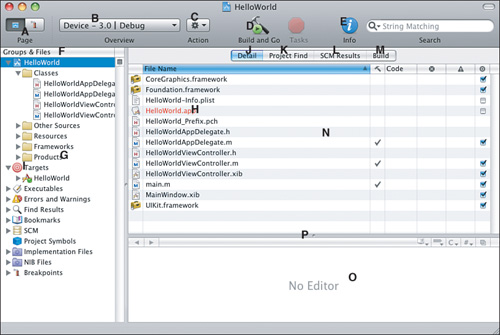
The style of the project window depends on an Xcode setting. Choose Xcode > Preferences (Command-,), select the General pane, and choose the layout from the pop-up. The samples in this chapter use the All-In-One layout that combines operations to a single window, as shown in Figure 2-2. Other options include Condensed, offering separate windows for most tasks, and Default, which has a core project window and separate tool windows.
Note
When creating new iPhone projects, some templates offer a Use Core Data for Storage check box. These projects offer a skeleton that creates a Core Data stack for persistent storage. See Chapter 19, “A Taste of Core Data,” for more details about Core Data.
Review the Project Window
The default Xcode project window is normally divided into three parts as you can see in Figure 2-2. These parts include the gray toolbar at top, the left-hand column, and the center-right portion of the window. Each part has a role to play in managing your project.
At the top, the gray toolbar provides a number of useful tools. The toggle on the very left (A) moves you between the project overview and the visual debugger. To its right, a pop-up (B) sets your targets and configuration. These control the application you intend to build and the way you intend to build it. The default iPhone templates provide two configurations, Debug and Release, which you can see from the pop-up choices. These configurations are actually a poor match for the realities of iPhone development, where better choices would have been Debug (for in-house development), Ad Hoc (for ad hoc distribution), and Distribution (for App Store release). Fortunately, the configurations are editable, and you discover how to create better choices later in this chapter.
To the right of the Configuration pop-up is Action (C), a pop-up that offers typical project functionality like adding new files and Reveal in Finder to locate those files on your Macintosh. To the right of that, you see the Build and Go button (D). Click it to compile your application and run it, whether on the device or in the simulator. The Info button (E) when clicked opens a window that you can use to customize parts of your project.
On the left side of the project window is the Groups and Files column (F). This column starts off with the source for your project. This list includes any files used to build the application plus any other files you’ve added to the project. The folder system shown is completely arbitrary. You can group with folders to organize your materials or skip the folders entirely. Groups provide an elegant way to organize your code and resources inside Xcode without touching the organization on the file system.
The Products folder (G), which is the last item in the folders list by default, contains the item you intend to build. In this case, that is the HelloWorld.app application (H). It is shown in red as it has not yet been built. Once built, it appears in black.
Below the first group of files is the Targets item (I). Click the gray disclosure triangle to reveal the HelloWorld entry under Targets. Locating your target is important. Select it and click the blue Info button at the top of the project window to open the Target “Hello World” Info window. This Target Info window is going to become one of your most important tools. Remember this sequence: Open the Target disclosure triangle, select the target, and click Info.
To the right of the Groups and Files column is a tabbed area. At the top, are four options: Detail (J), Project Find (K), SCM Results (L), and Build (M). Although they’re stacked together, these four pane options have different roles and yet they all provide critical project information.
• Detail lists and previews files in your project. It helps you find files and open them to edit.
• Project Find searches through entire projects. You can match strings in files and frameworks. It mirrors and expands upon the single-file Find pop-up you access via Command-F.
• SCM Results shows the status of your files relative to a Source Code Management System. SCM systems track changes to your project both for single and multiple programmers. Xcode integrates with SVN, Perforce, or CVS, and displays the results of your syncs. Unfortunately, there is no support for the git version control system at this time.
• Build presents a results window for building your projects, showing any errors and their details.
The Detail Pane
You’ll likely spend much of your time looking at the Detail pane (N), which is the default selection for the project window. The pane lists all the files in your project. Here you find all the individual elements listed by name. The Groups and Files column controls what you see. Click the HelloWorld group at the very top of the column to see all the files at once. Clicking on a group restricts the file list to just those files contained in that group.
The bottom pane (O) offers a preview of whichever element has been selected on the top. It’s also a live editor, so any changes made in the bottom pane update the file in question. Click main.m and the bottom immediately updates with the contents of that file. A resize bar (P) sits between the top file list and the bottom editor/preview. Use this to adjust the proportions between the two elements. If you do not want to see a preview, drag the bar all the way down to the bottom.
Editor Windows
You will normally not want to edit your files in the tiny preview pane of the project window. Double-click any source file at the top, such as main.m, to open a stand-alone editor window (see Figure 2-3). This source code window offers some of the same options as the project window in the top gray bar. Below the top bar, it offers a standard Xcode source-code editing window. Make any changes you need by editing the text in the window. Be sure to regularly save your work using File > Save (Command-S).
Figure 2-3 An Xcode source code editing window.
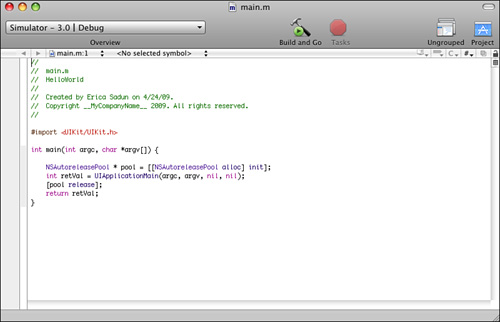
Xcode provides full undo support for a single session. You can even undo past a previous save so long as you do so within the same session. That is, you cannot close a project, reopen it, and then revert changes made before the project was closed.
Note
To add line numbers to your source code editing windows, open Preferences (Xcode > Preferences, Command-,). Scroll over to the Text Editing pane, check Show line numbers (on the left, under Display Options), click Apply, and then click OK.
Review the Project
When Xcode creates your new project, it populates it with all the basic elements and frameworks you need to build your first iPhone application. Items you see in this project include the following:
• Foundation and Core Graphics frameworks—These essential frameworks enable you to build your iPhone applications using the same fundamental classes and calls you are familiar with from the Macintosh.
• UIKit framework—This framework provides iPhone-specific user interface elements and is key to developing applications that can be seen and interacted with on the iPhone screen.
• HelloWorld.app—Displayed in red, this placeholder is used to store your finished application. Like on the Macintosh, iPhone applications are bundles and consist of many items stored in a central folder.
• HelloWorld-Info.plist—This file describes your application to the iPhone’s system and enables you to specify its executable, its application identifier, and other key features. It works in the same way Info.plist files work on the Mac.
• MainWindow.xib—This Interface Builder file creates an unpopulated window. You will not use this for this first walk-through.
• HelloWorldViewController.xib—This Interface Builder file builds the view that displays in your first application. You edit this to customize how it looks.
• main.m, HelloWorldAppDelegate.h, HelloWorldAppDelegate.m, HelloWorldViewController.h, and HelloWorldViewController.m—These files contain a rough Objective-C skeleton that you can customize and expand to create your application. Feel free to browse through the code, but you will not edit these in this walk-through. Instead, you use the way that Xcode set them up and limit your modifications to the view controller .xib.
Open the View Controller .xib
In the HelloWorld project window, locate the HelloWorldViewController.xib file. As you read in Chapter 1, “Introducing the iPhone SDK,” .xib files store Interface Builder layouts. Double-click the .xib file to launch Interface Builder so you can begin to edit the file. This may take a few seconds as the program opens and loads data. Once launched, locate the primary .xib window in Interface Builder shown in Figure 2-4.
Figure 2-4 The Interface Builder window for a view controller .xib
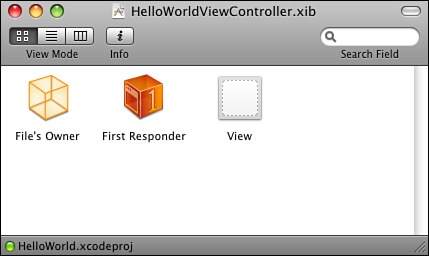
The three icons in the .xib window represent three elements of the interface you’re editing. To the very right is the View. The view is by default a member of the UIView class. It contains the onscreen elements that you want to display in your application.
On the left, the File’s Owner represents the view controller. This is an abstract class, and its icon is called a proxy because it plays a role in IB, but the object is not itself embedded in the .xib archive.
View controllers don’t have a visual presentation. They manage views, but they don’t display anything of their own. Each view controller has an instance variable called “view” which is set to some UIView (in this case, the one at the right) that is responsible for providing the actual onscreen presentation. So in the case of view controllers, the File’s Owner proxy represents the object that loads and owns the .xib.
You can discover this for yourself by opening an inspector window. Choose Tools > Identity Inspector (Command-4). Click the File’s Owner object and look at its class in the inspector. It is set to HelloWorldViewController. Then click the View object. Its class is UIView.
To see how the two are connected, click the File’s Owner in the .xib window and then choose Tools > Connections Inspector (Command-2). You see that there is one Outlet listed. Outlet is IB-talk for instance variable. Move your mouse over the view-View listing in the Connections Inspector and you see the View object in the .xib window highlight. That’s because the view outlet for your view controller is already connected to that view. Xcode prebuilt the file to work properly with the view.
The last icon, the one in the middle of Figure 2-4, is called First Responder. Like File’s Owner, it’s a proxy object. It represents the onscreen object that is currently responding to user touches. During the lifetime of an application, the first responder changes as users interact with the screen. For example, imagine a form. As the user touches each text field in that form, that field becomes active and assumes the first responder role.
Edit the View
To start customizing the view, double-click the View object in the .xib window. This opens a new editor window (see Figure 2-5, left). By default, the view is empty. It’s up to you to customize it and add some content. To do so, you rely on two tools: the Interface Builder library and the inspector.
Figure 2-5 An empty view editor window (left); the Interface Builder Library (right).
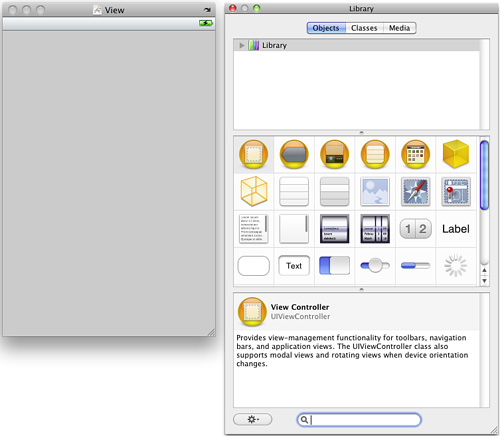
Select the view editor by clicking on it and then choose Tools > Attributes Inspector (Command-1). In the inspector, locate the Background swatch. Click on it and choose a new color from the Colors palette. The View automatically updates the background color. As you can see, the attributes inspector lets you adjust the properties of the currently selected object, in this case the view that you are editing.
Next, open the library by choosing Tools > Library (Command-Shift-L). The library (refer to Figure 2-5, right) presents a list of all the prebuilt Cocoa Touch elements you can use in your IB projects. These include both abstract elements like view controllers as well as visual components like buttons and sliders. Enter UILabel in the search field at the bottom of the library window. Drag the label from the middle pane, which is highlighted in Figure 2-5 (right) and drop it onto your view. Alternatively double-click the label in the middle pane. This automatically adds that item to your view. The bottom pane offers documentation of the selected class and you cannot drag from it.
Once dragged to the view, double-click the label and change the words from “Label” to “Hello World.” You can also move the label around in the window to appeal to your aesthetic sensibilities or set its location in the Size Inspector (Command-3). Once satisfied, save your project with File > Save (Command-S). You have now customized your view with this content.
Run Your Application
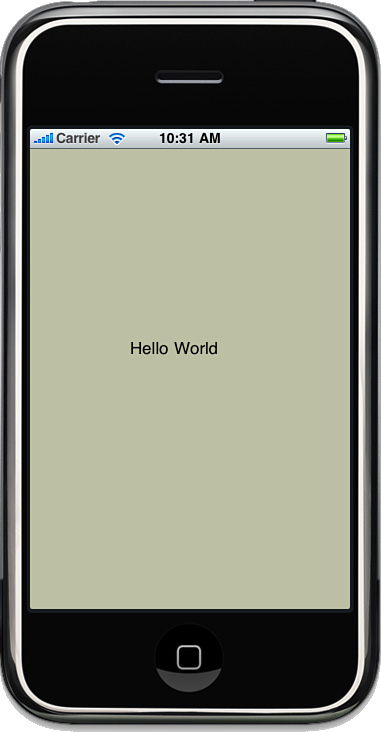
Return to Xcode and to your project window. Choose Project > Set Active SDK > iPhone Simulator (3.0). This tells Xcode to compile your project for the Macintosh-based iPhone Simulator. Click Build and Go in the main project window and then wait as Xcode gets to work. It takes a few seconds to finish compiling and then Xcode automatically launches the simulator, installs your project, and runs it. Figure 2-6 shows the result, the Hello World application running on the simulator.
Figure 2-6 The customized Hello World application runs on the simulator.
Using the Simulator
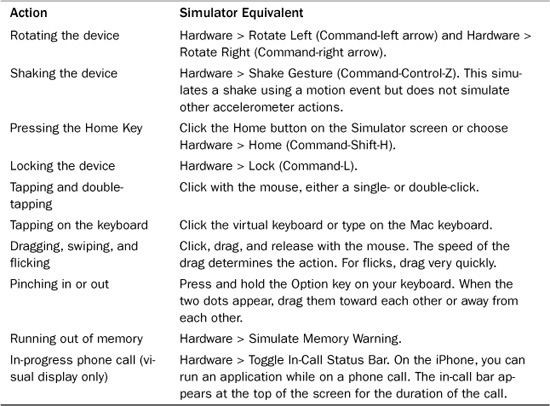
The iPhone SDK Simulator makes it possible to test applications on the Macintosh using many of the same actions a user would perform on an actual device. Because the Macintosh is not a handheld touch-based unit, you must use menus, keyboard shortcuts, and the mouse to approximate iPhone-style interactions. Table 2-1 shows how to perform these tasks via the simulator.
Table 2-1 Simulator Equivalents for iPhone Actions
Simulator: Behind the Scenes
Because the simulator runs on a Macintosh, Xcode compiles simulated applications for the Intel chip. Your application basically runs natively on the Macintosh within the simulator using a set of Intel-based frameworks that mirror the frameworks installed with the iPhone OS onto actual units. The simulator versions of these frameworks are located in the Xcode developer directory: /Developer/Platforms/iPhoneSimulator.platform/Developer/SDKs/iPhoneSimulator3.0.sdk/System/Library.
You can find your applications in your home’s Library/Application Support folder. They are stored in iPhone Simulator/User/Applications/. It’s helpful to visit this folder to peek under the hood and see how applications get deployed to the iPhone.
Each application is stored in an individual sandbox. The name of the sandbox is random, using a unique code (generated by CFUUIDCreateString()). Until OS 3.0, a sandbox file usually accompanied the sandbox folder. It used the same name with a .sb extension and stored the permissions associated with the file. Starting with 3.0, these sandbox permissions files no longer seem to be used. In the past, you had to zip up both the folder and the .sb file to share compiled simulator applications with others. Now you can zip up just the folder and still be able to share between Macintoshes.
Each sandbox name hides the application it’s hosting, so you must peek inside to see what’s there. Inside you find the application bundle (HelloWorld.app, for example), a Documents folder, a Library folder, and a /tmp folder. While running, each application is limited to accessing these local folders. They cannot use the main user Library as applications might on a Macintosh.
If you want to clean out your applications folder, you can delete files directly while the simulator is not running. Alternatively, use the press-and-hold-until-it-jiggles interface on the simulator that you’re used to on the iPhone device itself. After pressing and holding any icon for a few seconds, the application icons start to jiggle. Once in this edit mode, you can move icons around or press the corner X icon to delete applications along with their data. Press the Home button to exit edit mode. You can also delete all of the simulator data by choosing iPhone Simulator > Reset Contents and Settings.
Although applications cannot access the user library folder, you can. If you want to edit the simulator’s library, the files are stored in the iPhone Simulator/User/Library folder in your home Application Support folder. Editing your library lets you test applications that depend on the address book for example. You can load different address book sqlitedb files into Library/AddressBook to test your source with just a few or many contacts.
Note
The iPhone Simulator and Mac OS X use separate clipboards. The simulator stores its own clipboard data, which it gathers from the copy/paste features new to 3.0 firmware. Although you can use Edit > Paste (Command-V) to paste text from the Macintosh into simulator applications, this does not affect the simulator’s onboard clipboard.
The Minimalist Hello World
While exploring the iPhone SDK, and in the spirit of Hello World, it helps to know how to build parsimonious applications. That is, it helps know how to build an application completely from scratch, without five source files and two interface files. So here is a walk-through showing you exactly that, a very basic Hello World that mirrors the UIViewController approach shown with the previous Hello World example but that manages to do so with one file and no .xibs.
Start by creating a new project (File > New Project, Command-Shift-N) in Xcode. Choose Window-based Application and save it as HelloWorld2 to your desktop. When the project window opens, select the Classes folder from the left column and click backspace to delete it. Choose Also Move to Trash when prompted. Next, delete MainWindow.xib.
Locate HelloWorld2-Info.plist (in the Resources folder) and double-click to open its editor. The last line should read Main nib file base name. Select this line and delete it. Save and close the file.
Open main.m and replace its contents with Listing 2-1. The source is included in the sample code for this book (see the preface for details), so you don’t have to type it in by hand.
Listing 2-1 Reductionist main.m
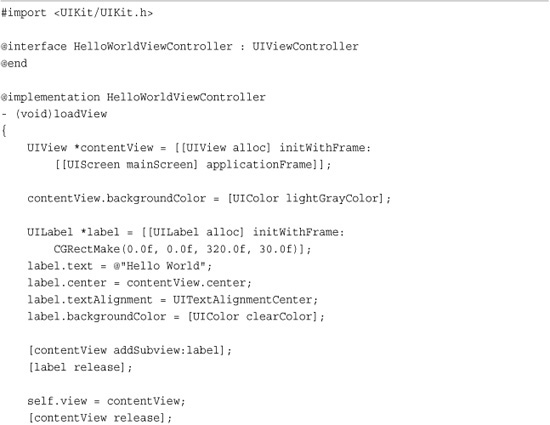
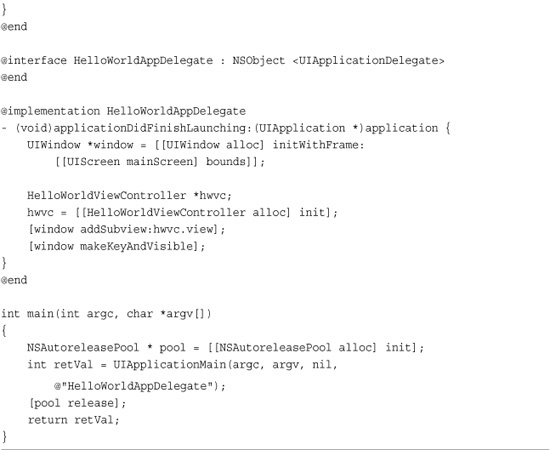
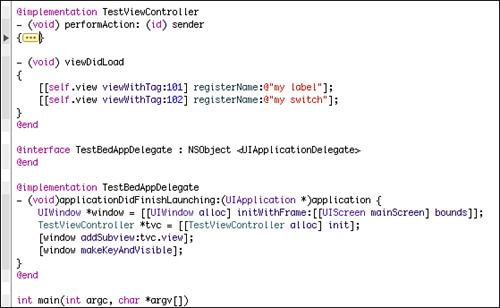
So what does this application do? It builds a view, colors the background, and adds a label that says “Hello World.” In other words, it does exactly what the first Hello World example did, but it does so by hand, without using Interface Builder.
It starts in main.m by establishing the autorelease pool and calling UIApplicationMain. From there, control passes to the application delegate, which is specified as the last argument of the call. This is a critical point for building a non-Interface Builder project, and one that has snagged many a new iPhone developer.
The delegate, receiving an application did launch message, builds a new window and creates a new instance of a custom view controller. It adds that controller’s view to the window. The view controller waits for a request to load its view and when that request comes in, it runs loadView, which builds the view and adds the Hello World text.
Building views by hand means using this loadView method to set up the primary view and its children. This sample starts by creating a new view and telling it to fill the full space available to the application. It then sets the background color, in this case to light gray. Next, the sample builds a new instance of the UILabel class. Each of the label properties is set by hand.
In Interface Builder, the attributes inspector fills the same function. The inspector shows the label properties, offering interactive controls to choose settings like left, center, or right alignment. Here, that alignment is set programmatically to the constant UITextAlignmentCenter, the background color is set to clear, and the label programmatically moved into place via its center property. In the end, both the by-hand and Interface Builder approaches do the same thing, but here the programmer leverages specific knowledge of the SDK APIs to produce a series of equivalent commands.
As with other examples in this book, this code does not provide a dealloc method for the application delegate as it never gets called. The iPhone OS recovers all application memory during the application tear-down. Technically, the view controller leaks. In practice, this isn’t a problem.
Browsing the SDK APIs
The iPhone SDK APIs are fully documented and accessible from within Xcode. Choose Help > Documentation (Command-Option-Shift-?) to open the Xcode Developer Documentation browser. Choose a documentation set from the top bar and search for UILabel from the top-right. This brings you to the full UILabel Class Reference (see Figure 2-7) where you can find all the class methods, properties, and instance methods as well as a general class overview.
Figure 2-7 Apple offers complete developer documentation from within Xcode itself.

Apple’s Xcode-based documentation is thorough and clear. With it you have instant access to an entire SDK reference. You can look up anything you need without having to leave Xcode. When material goes out of date, a document subscription system lets you download updates directly within Xcode.
Interface Builder offers an extremely useful tool for developers at all expertise levels. Relying on it for many developer tasks, such as hooking up instance variables and crafting callbacks, may prove limiting. There is a lot more you can do in code that you cannot do in IB. Xcode’s developer documentation helps you move past those limits and lets you focus your IB work on interface design, which is what the tool best offers. By understanding the SDK at a deeper level, you can craft more nuanced and powerful applications.
Converting Interface Builder Files to Their Objective-C Equivalents
A handy open source utility by Adrian Kosmaczewski allows you to convert Interface Builder files to Objective-C code. With it, you can extract all the layout information and properties of your visual design and see how that would be coded by hand. nib2objc does exactly what its name suggests. With it, you can generate converted code that takes into account the class constructors, method calls, and more.
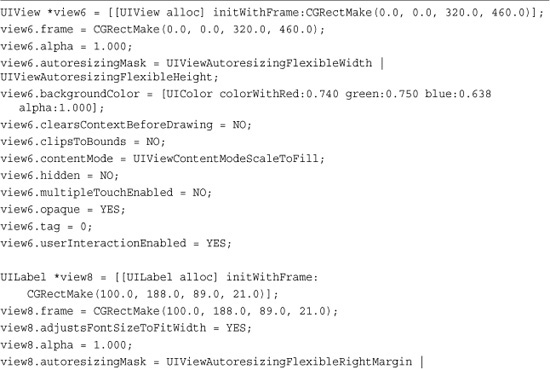
Listing 2-2 shows the result of running nib2objc on the .xib file used in the first walk-through. Compare it to the far simpler (and less thorough) by-hand version in Listing 2-1. It performs more or less the same tasks. It creates a new view, then creates a new label, and adds the label to the view. However, this conversion utility exposes all the underlying properties, of which just a few were edited in Listing 2-1.
Listing 2-2 HelloWorldViewController.xib after Conversion to Objective-C

To peek at the original IB xml, open the .xib file in Text Edit. You can do so by issuing open -e from the Terminal command line while in the HelloWorld project folder.
open -e HelloWorldViewController.xib
Note
nib2obj is hosted at http://github.com/akosma/nib2objc/tree/master and issued under a general “Use this for good not evil” style of license.
Using the Debugger
Xcode’s integrated debugger provides a valuable tool for iPhone application development. The following walk-through shows you where the debugger is and provides a simple grounding for using it with your program. In these steps, you discover how to set breakpoints and use the debugger console to inspect program details. These steps assume you are working on the second, minimalist Hello World example just described and that the project window is open and the main.m file displayed.
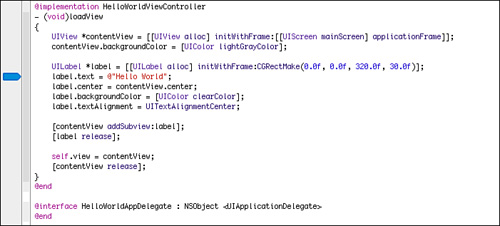
Set a Breakpoint
Locate the loadView method in the main.m file of your Hello World project. Click in the leftmost Xcode window column, just to the left of the label.text assignment line. A blue breakpoint indicator appears (see Figure 2-8). The dark blue color means the breakpoint is active. Tap once to deactivate—the breakpoint turns light blue—and once more to reactivate. You can remove breakpoints by dragging them offscreen and add them by clicking in the column, next to any line of code.
Figure 2-8 Blue breakpoint indicators appear in the leftmost Xcode window column.
Open the Debugger
Click the Project/Debug toggle in the project window to view the debugger. The debugger provides a graphical front end for inspecting program objects, as well as a source window, and a log area with an interactive gdb shell. Locate the Activate/Deactivate button at the top-right of the debugger and make sure that it is activated, that is, that the button says “Deactivate.”
Run the Program
Make sure the breakpoint is dark blue and that the button at the top of the debugger says “Deactivate” (which means that the breakpoint is active), and click Build and Go to run the program in the simulator. The program automatically stops when it hits the breakpoint. The simulator window remains black and the debugger window updates to show the interactive interface of Figure 2-9.
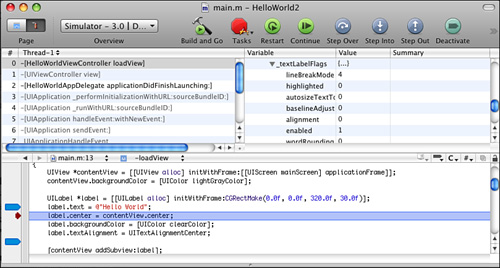
Figure 2-9 Xcode’s graphical debugger enables you to interactively inspect program state. A command-line version of gdb runs concurrently in the console window, as shown by the (gdb) prompt. A red arrow appears at the active breakpoint.
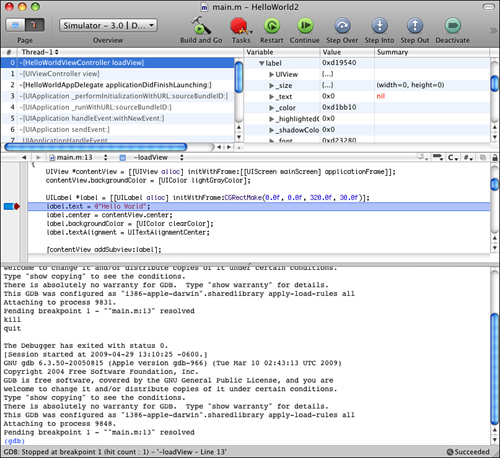
Inspect the Label
Once stopped at the breakpoint, the interactive debugger and the gdb command line let you inspect objects in your program. For this example, navigate down the variable chain; the variable inspection pane appears at the top-right of the debugger window. Locate the Locals list of variables by scrolling down slightly below the Arguments list. Inside, click the disclosure triangle to the left of label to show the properties of the label object. Notice that text is labeled either nil or Invalid.
The gray Step Into button appears in the top toolbar of the window. Click it once. The text assignment executes and the red arrow moves down by one line. The summary of the label.text updates. It should now say Hello World.
Set Another Breakpoint
You can set additional breakpoints during a debugging session. For example, add a second breakpoint just after the line that sets the text alignment to center. You can do this in the middle pane; there’s no need to reopen the original source window. Once again click in the leftmost column next to the line where you want to set the breakpoint.
Confirm that the current alignment is set to 0, the default value, by inspecting the label’s textLabelFlags. You may have to scroll down a little and resize the variable column. Figure 2-10 shows the two breakpoints, the red arrow just after the assignment, and the alignment value defaulting to 0.
Figure 2-10 You can set additional breakpoints during the debugging session.
With the new breakpoint set, click the green Continue button. HelloWorld resumes execution until the next breakpoint, where it stops. The red arrow should now point to the addSubview line, and the alignment flag updates from 0 to 1 as that code has now run, changing the value for that variable.
Note
Remove breakpoints by dragging them out from the left column.
Going Text
The bottom pane of the debugging window offers text-based GNU debugger (gdb) output that mirrors the results and data from the top two panes. For example, type backtrace at the gdb prompt to view the same trace shown in the top-left pane. After stopping at the second breakpoint, the backtrace should show that you are near line 19 in the source from main.m.
This bottom section is also known as the console. In Xcode, choose Run, Console (Command-Shift-R) to jump to the Xcode console. If the debugger is already open, the cursor jumps to the bottom pane. This pane is where your printf, NSLog, and CFShow messages are sent by default when running in tethered standard debug mode or when you use the simulator. You can resize the console by adjusting the resize bar at its top. If you want, you can drag it all the way to the top. This provides a full-window text-based console when needed.
To test console logging, add a NSLog(@"Hello World!"); line to your code; place it after the contentView release. Compile and run the application in the simulator. The log message appears in the console pane. The console keeps a running log of messages regardless of how many times you have tested your application. You can manually clear the log as needed.
You don’t have to be running with gdb and the debugger console to see log messages. Tethered iPhones automatically send their NSLog output to the Xcode organizer (Window > Organizer > Device Name > Console). The Organizer console shows the output created by NSLog. For example, when run on an iPhone, that NSLog command displays like the following. It shows the date and time, the program name and the NSLog output (in this case, “Hello World!”).
Sun May 3 09:08:11 unknown HelloWorld2[2198] <Warning>: Hello World!
Moving the Clear Log Button
In the current version of the iPhone SDK, the Clear Log button defaults to the very right of the toolbar. Because of this, Clear Log does not appear when the window is sized too small, as shown in Figure 2-10. You can access it by clicking the double-chevron at the top right of the window. I find this default location too much of a pain as I use the button constantly.
Fortunately, like most OS X toolbars, Xcode supports customization. To customize, Control- or right-click the toolbar. Choose Customize Toolbar from the contextual pop-up. From here you can drag Clear Log to a better location so less important buttons get sent to the chevron submenu and the Clear Log remains available at all times. To clear the console log via the keyboard, type the extremely awkward Control-Option-Command-R key combo. Alternatively, use Xcode’s hotkey rebinding support. See the Key Bindings pane in Xcode preferences (Command-,).
You can also automatically clear the console, although this can sometimes erase content that you are still reviewing. Open Xcode Preferences (Xcode > Preferences, Command-,), and then check Debugging > Auto Clear Debug Console. This erases the console each time you execute the application.
Enabling Zombies
In the movies, a zombie is something dead that starts walking around. In Xcode vernacular, a zombie is an object that has been destroyed or released that you are still trying to send messages to. During debugging, you can set a special mode called NSZombieEnabled. This debug mode lets you gather information about messages sent to invalid objects. Say, for example, you create an instance variable called array. You set this and release it in the application’s loadView method:
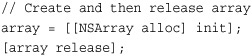
Should you attempt to access this object elsewhere in the program, the application will crash. The debugger will fail with objc_msgSend and at best you can view a backtrace to try to locate the error. Backtraces show a system stack, tracing the chain of messages that led to the current error.
NSZombieEnabled lets you locate the exact problem. In your project, select the Project view (as opposed to the Debug view). Locate Executables in the project list and open the disclosure triangle. Select your application, and click the blue Info button at the top toolbar. Click the Arguments tab and locate the Variables section at the bottom of the Arguments pane. Click +, add NSZombieEnabled as the name (zombie, not zombies) and YES as the value. Close the Executable Info window.
Now when you run the program, you receive a far more helpful message:
![]()
This message lets you use the interactive debugger window to match the instance value with the identity of the object; you’ll know exactly which object went zombie on you. To disable zombies, delete the NSZombieEnabled from the variables section of the Executable Info. Make sure to do so before distributing the application.
Note
In Xcode 3.2 and newer, you can also use Run > Run with Performance Tool > Instruments > Zombies.
Memory Management
The iPhone does not offer garbage collection. It relies on a reference counted memory management system. As a developer that means you must control when objects are created, retained, and released from memory. Use too much memory and the iPhone warns your application delegate and UIViewControllers. Delegates receive applicationDidReceiveMemoryWarning: callbacks; view controllers get didReceiveMemoryWarning. Continue to use too much memory and the iPhone will terminate your application, crashing your user back to the SpringBoard. As Apple repeatedly points out, this is probably not the user experience you intend for your user, and it will keep your application from being accepted into App Store.
You must carefully manage memory in your programs and release that memory during low-memory conditions. Low memory is usually caused by one of two problems: leaks that allocate memory blocks that can’t be accessed or reused and holding on to too much data at once.
Note
In addition to retain and release, Objective-C offers autorelease memory management. Sending autorelease to an object, typically at the time of its creation, says that you want it disposed of automatically at some time in the future. The method that requests the object can use the autoreleased object right away, and let it be disposed of at the end of the current run loop, or it can retain the object for future use. Chapter 3, “Objective-C Boot Camp,” discusses memory management in further detail.
Leaks
Every object in Objective-C is created with an integer-based retain count. So long as that retain count remains at one or higher, objects will not be deallocated. It is up to you as a developer to implement strategies that ensure that objects get released at the time you will no longer use them.
Every object built with alloc, new, or copy starts with a retain value of 1. Sending a retain message to the object increases that count by one; sending release decreases the count. (Assigning the object to a retained property also increases the count.) If you lose access to an object without reducing the count to 0, that lost object creates a leak, that is, memory that is allocated and cannot be recovered. The following code leaks an array:
NSArray *leakyarray = [[NSMutableArray alloc] init];
leakyarray = nil;
Caching
When you load too much data at once, you can also run short of memory. Holding on to everything in your program when you are using memory-intense resources such as images, audio, or PDFs may cause problems. A strategy called caching lets you delay loads until resources are actually needed and release that memory when the system needs it.
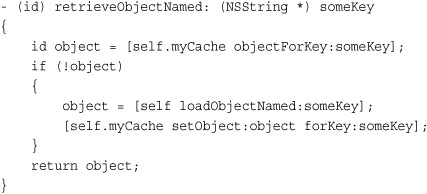
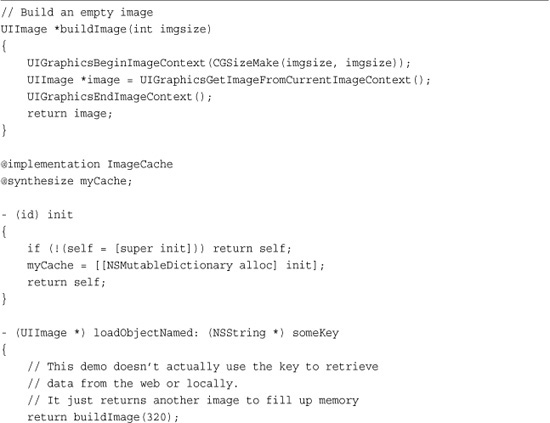
The simplest approach involves building a cache from a NSMutableDictionary object. A basic object cache works like this. When queried, the cache checks to see whether the requested object has already been loaded. If it has not, the cache sends out a load request based on the object name. The object load method might retrieve data locally or from the Web. Once loaded, it stores the new information in memory for quick recall.
This code here performs the first part of a cache’s duties. It delays loading new data into memory until that data is specifically requested. (In real life, you probably want to type your data and return objects of a particular class rather than use the generic id type.)
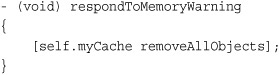
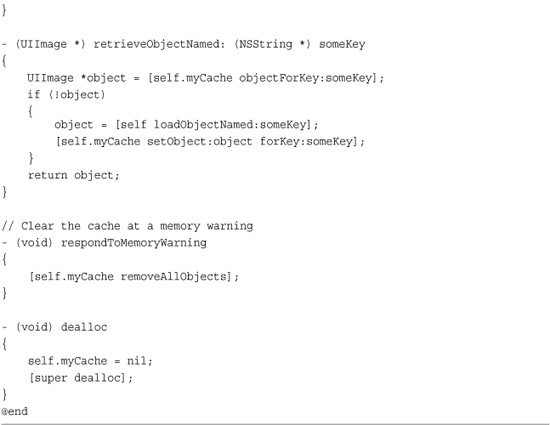
The second duty of a cache is to clear itself when the application encounters a low-memory condition. With a dictionary-based cache, all you have to do is remove the objects. When the next retrieval request arrives, the cache can reload the requested object.
Combining the delayed loads with the memory-triggered clearing allows a cache to operate in a memory-friendly manner. Once objects are loaded into memory, they can be used and reused without loading delays. However, when memory is tight, the cache does its part to free up resources that are needed to keep the application running.
Recipe: Using Instruments to Detect Leaks
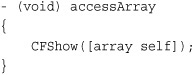
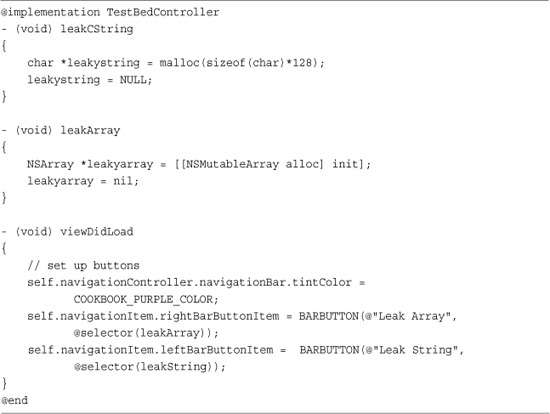
Instruments plays an important role in tuning your applications. It offers a suite of tools that lets you monitor performance. Its leak detection lets you track, identify, and resolve memory leaks within your program. Recipe 2-1 shows an application that creates two kinds of leaks on demands: a string built by malloc() that is not balanced by free(), and the NSArray example shown earlier in this chapter.
Recipe 2-1 Creating Programmatic Leaks
Get This Recipe’s Code
To get the code used for this recipe, go to http://github.com/erica/iphone-3.0-cookbook-, or if you’ve downloaded the disk image containing all of the sample code from the book, go to the folder for Chapter 2, and open the project for this recipe.
To see Instruments in action, first load the sample project for Recipe 2-1. Choose Run > Run with Performance Tool > Leaks in Xcode. This launches both Instruments and the simulator. The application begins to run in the simulator and Instruments watches over its progress.
Click either button in the application to leak memory. The string button leaks a 128-byte malloc’ed block. The array button leaks a 32-byte NSArray. Memory leaks appear in Instruments as an orange triangle. The size of the triangle indicates the size of the leak.
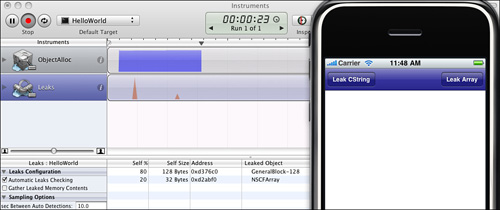
Be sure to click on the Leaks line to see the list of individual leaks as shown in Figure 2-11. By default, the ObjectAlloc line is selected. Each leak shows the amount of memory leaked, the address at which the leak starts, and the kind of object leaked.
Figure 2-11 Instruments tracks leaks created by memory that cannot be recovered.
To track details about where the leak occurred, open the Extended Detail pane (View > Extended Detail, Command-E). Alternatively, click the detail button just to the left of the words “Leaked Blocks” at the bottom of the Instruments window. Click any item in the list of leaks. This opens a stack trace for that leak in the extended detail view, as shown in Figure 2-12.
Figure 2-12 The stack trace in the Extended Detail view reveals where leaks occurred.
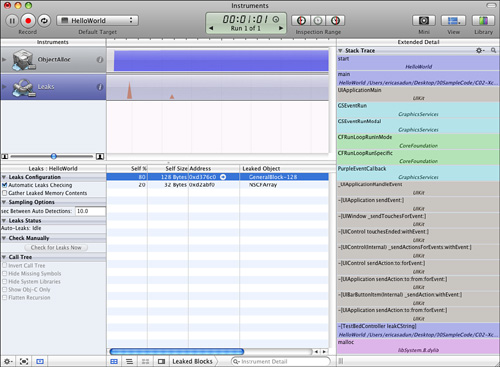
Here, you find a stack trace that connects the leak to its creation. As this screenshot shows, the memory leak in question was allocated in leakCString after being malloc’ed. Finding the genesis of the object can help you track down where the leak occurs during its lifetime. Once discovered, hopefully you will be able to plug the leak and remove the memory issue from your application.
Recipe: Using Instruments to Monitor Cached Object Allocations
One feature of the simulator allows you to test how your application responds to low-memory conditions. Selecting Hardware > Simulate Memory Warning sends calls to your application delegate and view controllers, asking them to release unneeded memory. Instruments, which lets you view memory allocations in real time, can monitor those releases. It ensures that your application handles things properly when warnings occur. With Instruments, you can test memory strategies like caches discussed earlier in this chapter.
Recipe 2-2 creates a basic image cache. Rather than retrieve data from the Web, this image cache builds empty UIImage objects to simulate a real use case. When memory warnings arrive, as shown in Figure 2-13, the cache responds by releasing its data.
Get This Recipe’s Code
To get the code used for this recipe, go to http://github.com/erica/iphone-3.0-cookbook-, or if you’ve downloaded the disk image containing all of the sample code from the book, go to the folder for Chapter 2 and open the project for this recipe.
Figure 2-13 Instruments helps monitor object allocations, letting you test your release strategies during memory warnings.
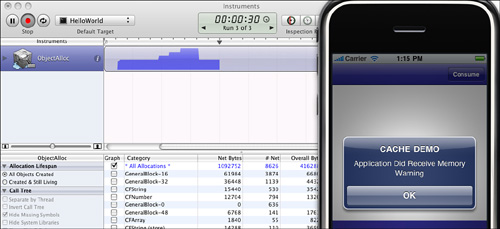
The stair-step pattern shown here represents three memory allocations created by pressing the Consume button. After, the simulator issued a memory warning. In response, the cache did its job by releasing the images it had stored. The memory then jumped back down to its previous levels. Instruments lets you save your trace data, showing the application’s performance over time. Choose File > Save to create a new trace file. By comparing runs, you can evaluate changes in performance and memory management between versions of your application.
Some SDK objects are automatically cached and released as needed. The UIImage imageNamed: method retrieves and caches images in this manner, although it has gained a deserved reputation for not operating as smoothly as it should and retaining memory that should rightly be released. Nibs used to build UIViewControllers are also cached, and reload as necessary when controllers need to appear.
Note
As a general rule of thumb for the first two generations of iPhones, an application can use up to about 20MB of memory before memory warnings occur and up to about 30MB until the iPhone OS kills your application.
Using the Clang Static Analyzer
The LLVM/Clang static analyzer automatically helps detect bugs in Objective-C programs. It’s a terrific tool for finding memory leaks and other issues. Starting with Xcode version 3.2, you can run the analyzer directly from Xcode. Choose Build > Build and Analyze (Command-Shift-A). The interactive screen shown in Figure 2-14 guides you through all suspected leaks and other potential problems.
Figure 2-14 The Clang static analyzer creates bug reports for source code and displays them in an Xcode feedback window.
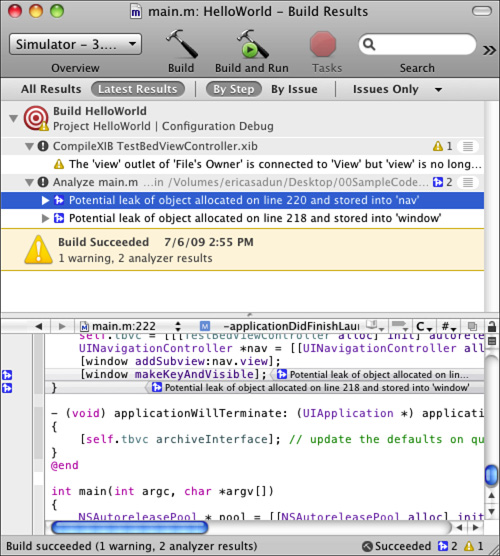
Issues found by the static analyzer are not necessarily bugs. It’s possible to write valid code that Clang identifies as incorrect. Always critically evaluate all reported issues before making any changes to your code.
A stand-alone version of Clang can be used with legacy Xcode. Here are the steps you can take to download, install, and use the static analyzer with your own projects:
1. Download a copy of the analyzer from http://clang-analyzer.llvm.org/. Unzip it and rename the folder. I use the name “analyzer”; adapt the script in step 3 to match your name.
2. Move the folder into place, typically into your home directory. I placed mine in ~/bin and the short shell script that follows uses this path.
3. I created and added the following script to ~/bin, naming it “clangit.” Again, use your own judgment on placement and naming.
4. Open an Xcode project, choose the Simulator|Debug configuration, and then close Xcode.
5. From the command line, navigate to the project folder. Run the clangit script from that folder. Once analyzed, the analyzer report opens automatically in your Web browser.
Building for the iPhone
Building for and testing in the simulator takes you only so far. The end goal of iPhone development is to create applications that run on actual devices. There are three ways to do so: building for development, for distribution, and for ad hoc distribution. These three, respectively, allow you to test locally on your device, to build for the App Store, and to build test and review versions of your applications that run on up to 100 registered devices. Chapter 1 introduced mobile provisions and showed how to create these in the Apple iPhone developer program portal. Now it’s time to put these to use and deploy a program to the iPhone itself.
Install a Development Provision
At a minimum, a development provision is a prerequisite for iPhone deployment. So before going further, make sure you have created a wild-card dev provision and installed it into Xcode by dragging the mobileprovision file onto the Xcode application icon. (Alternatively, drop the provision onto iTunes.) After doing so, quit and restart Xcode to ensure that the provision is properly loaded and ready to use.
You may also want to review your keychain and ensure that the WWDR (Worldwide Developer Relations) and your developer identity certificates are available for use. During compilation, Xcode matches the provision against the keychain identity. These must match or Xcode will be unable to finish compiling and signing your application. To check your certificates, open Keychain Access (from /Applications/Utilities) and type “developer” in the search box on the top right. You see, at a minimum, an Apple Worldwide Developer Relations certifications Authority and one labeled iPhone Developer followed by your (company) name.
Edit Your Application Identifier
Your project application identifier can be set in the Target Info window under the Properties tab. To find this, open the disclosure triangle next to Targets in the left-hand column of your project window. Select the item inside. Its name matches the name of your project. Click the big blue Info button at the top of the project window. This opens the Target Info window with its five tabs. Click Properties, which is the fourth tab (see Figure 2-15).
Figure 2-15 The Properties tab reveals the current application identifier settings.
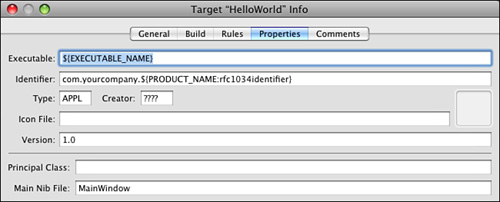
Your wild-card development provision must match your actual application identifier. So if you registered a wild-card application identifier of, say, com.sadun.* and used that to generate your provisioning profile, your project’s application identifier must match the registered identifier. You could use com.sadun.helloworld or com.sadun.testing, for example, but not helloworld or com.mycompany.helloworld.
By default, Xcode sets the application identifier to com.yourcompany.productname, where the product name is automatically filled in using the name you used to create your project. Edit com.yourcompany without touching the Xcode variable, which starts with the dollar sign, to match the values used in your wildcard identifier.
Note
You can change the default company name by editing the templates found at /Developer/Platforms/iPhoneOS.platform/Developer/Library/Xcode/Project Templates/Application or, better yet, by copying them and transforming them into custom templates. This process is described later in this chapter.
Set Your Code Signing Identity
After setting your identifier, click on the Build tab and confirm that the Configuration drop-down list at the top-left of the screen is set for the configuration type you want to modify (Debug or Release). Scroll down to find the Code Signing Identity entry. Click the triangle to disclose Any iPhone OS Device and click the pop-up to its right. This is where you select the provisioning profile identity you use to sign your application.
As you start to accumulate provisions and identities, the list of options can become long indeed. The sample shown in Figure 2-16 has been trimmed for narrative purposes. Normally, it’s triple that size mostly due to third-party ad hoc provisions like the Polar Bear Farm Beta Program one.
Figure 2-16 Select a provisioning profile for your Code Signing Identity. To be used, provisions must match the application identifier.
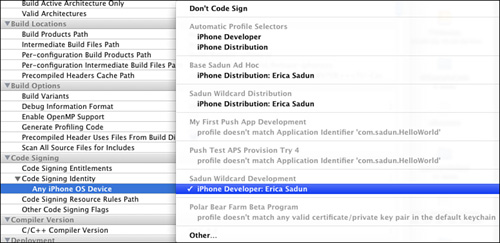
You can see that there are items in black and items in gray. Gray items do not match the project’s application identifier. They cannot be used to sign. In this example, these include a couple of push notification provisions, which are tied to specific application IDs that aren’t equal to the current com.sadun.HelloWorld identifier.
The black items include my three matching provisions: my normal ad hoc provision, my wild-card distribution provision, and my wild-card development provision, which is selected in the image. Each of these three is listed with a certificate identity, namely iPhone Developer or iPhone Distribution followed by a colon, followed by my name. These match both the identities stored in the keychain and the certificates used in the portal to generate the provisions.
The two Automatic Profile Selectors automatically pick the first matching profile. This works well for the Developer identity. I have only one. This works poorly for the Distribution identity, which matches first to my ad hoc profile, which I rarely use. In day-to-day work, ignore the automatic profile selector and make sure you pick the item you actually intend to use by inspecting both the certificate name and the profile identity just above that name before choosing a profile.
Compile and Run the Hello World Application
Finally, it’s time to test Hello World on an actual iPhone or iPod touch. Connect a unit that you will use for development. If this is your first time doing so, Xcode prompts you to confirm that you want to use it for development. Go ahead and agree, understanding that Apple always warns about possible dire consequences for doing so. First-time developers are sometimes scared that their device will be locked in some “development mode”; in reality, I have heard of no long-lasting issues. Regardless, do your homework before committing your device as a development unit. Read through the latest SDK release notes for details.
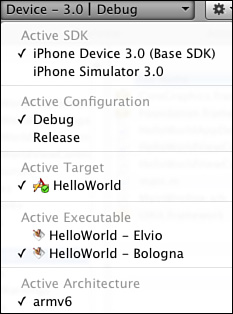
Before you compile, you must tell Xcode to build for the iPhone’s ARM architecture rather than the Macintosh’s Intel one. In the project window, choose iPhone Device as your Active SDK (see Figure 2-17). Then, check the Active Executable setting. If you have attached more than one development unit to your Macintosh, choose the one you want to test on. A check mark appears next to the unit name that will be used.
Figure 2-17 The Active Executable selection chooses which device to use. Two development units are connected to this Mac, with the Bologna unit chosen.
Click the Build and Go button in the project window. Assuming you have followed the directions earlier in this chapter properly, the Hello World project should compile without error, copy over to the iPhone, and start running.
If the project warns you about the absence of an attached provisioned device, open the Xcode Organizer window and verify that the dot next to your device is green. If this is not the case, you may need to reboot your device or your computer.
Signing Compiled Applications
You can sign already compiled applications at the command line using a simple shell script. This works for applications built for development. Signing applications directly helps developers share applications outside of ad hoc channels.

If you use several iPhone Developer profiles in your keychain, you may need to adapt this script so that it matches only one of those. Otherwise codesign complains about ambiguous matching.
I personally used this approach to distribute test versions of the sample code from this book. Using developer code-signing allowed me to skip the hassles of ad hoc distribution, allowing me to rapidly turn around applications to an arbitrary audience.
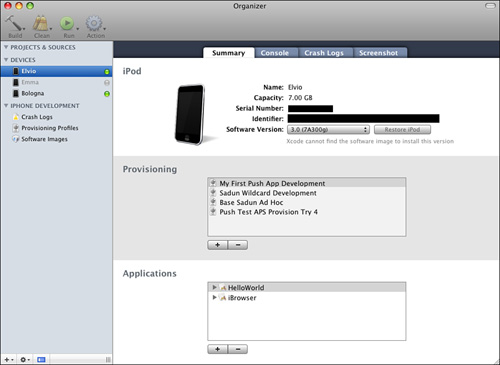
From Xcode to Your iPhone: The Organizer Interface
The Xcode Organizer helps manage your development units. Choose Window > Organizer (Control-Command-O). This window (see Figure 2-18) forms the control hub for access between your development computer and your iPhone or iPod testbed. This window allows you to add and remove applications, view midtest console results, examine crash logs, and snap screenshots of your unit while testing your application. Here’s a quick rundown of the major features available to you through the Organizer.
Figure 2-18 The Xcode-based iPhone Organizer window (Window > Organizer) provides a single control hub for most of your application testing needs. Here, you can load firmware, install and remove applications, read through crash logs, snap device-based screenshots, and more.
Projects and Sources List
Keep your current projects in easy reach by dragging them onto the Organizer. You can drag in the entire project folder. Once added, double-click the project file to open that project. You can add individual source files as well as complete projects. Use the Build, Clean, Run, and Action options at the top of the Organizer window, to perform even more development tasks directly from the Organizer.
In addition to storing files, the Projects and Sources list can be used for viewing the contents of sandboxes. When you download sandbox data from a device with the Summary tab, Xcode automatically adds that folder to this list, where you can browse through the file contents.
To remove items from this list, especially items that were added automatically and that you didn’t choose to include, open the contextual pop-up. Right-click or control-click any item and choose Remove from Organizer, and then click OK. Doing so does not affect any files on your disk. You’re not deleting files; you’re just omitting the listing in the Projects and Sources list.
Devices List
The Devices list shows the name and status of those devices you’ve authorized as development platforms. The indicators to the right of each name show whether the device is attached (green light) or not (red light). A gray light indicates a unit that has not been set up for development or that it has been “ignored”—that is, removed from the active list. An amber light appears when a device has just been attached. Should the light remain amber-colored, you may have encountered a connection problem. This may be due to iTunes syncing, and the unit is not yet available, or there may be a problem connecting with the onboard services, in which case a reboot of your iPhone usually resolves any outstanding issues.
iPhone Development Tools
The items in this list offer Mac-based development resources. These include archival crash logs (i.e., not tied to a particular device but offloaded to your system), a Provisioning Profiles manager, and a Software Images list that shows the firmware bundles currently available on your system. The profile manager is particularly useful as it shows which device each profile is installed on, offers a profile identifier (so you can figure out which file in ~/Library/MobileDevice/Provisioning Profiles corresponds to which provision), and provides handy expiration date checks.
Summary Tab
The Summary tab tells you the name, capacity, serial number, and identifier of your iPhone or iPod touch. Here is where you can provision your unit (that is, authorize it to work with the projects you build in Xcode), add and remove applications, and load the latest firmware.
Each developer license allows you to provision your personal or corporate iPhones/iPod touches for testing. The Provisioning list shows a list of application provisions available to your unit. The provision determines which applications may or may not be run on the device. As a rule, only development and ad hoc distribution provisions are listed here, which makes sense. Distribution provisions are used to sign applications for the App Store, not for any specific device.
A list of installed applications appears at the bottom of the Summary tab. Use the – button to remove applications. To install an application, drag it onto the list or use the + button to browse for it. Make sure your application is compiled for the iPhone OS and that the device is provisioned to run that application. The application will immediately sync over. Applications installed from App Store are grayed out in the application list.
Open the disclosure triangle next to each application name to reveal the application data associated with that application. To download the application data, click the down-pointing arrow, choose a destination, and click Save. Xcode builds a dated folder and populates it with the contents of the sandbox, namely the Documents, Library, and tmp directories. Xcode also adds the folder to the Projects and Sources list, where you can browse the contents directly from the Organizer.
You can reverse this process and add edited sandboxes back to the device. Locate the folder you created (use Reveal in Finder from the contextual pop-up in Projects and Sources). Drop new items into any of the subfolders, and then drag the entire folder back onto the application name at the bottom of the Summary pane. Xcode reads the new items and instantly transfers them to the device. This is a great way to prepopulate your Documents folder with test material.
Console Tab
Use the console to view system messages from your connected units. This screen shows NSLog() calls as you’re running software on the tethered iPhone. You need not be using Xcode’s debugger to do this. The console listens in to any application currently running on the device.
In addition to the debugging messages you add to your iPhone applications, you also see system notices, device information, and debugging calls from Apple’s system software. It’s basically a text-based mess. Logged data also appears on the Xcode debugging console (Run > Console) along with any printf output. Click Save Log As to write the console contents out to disk.
Crash Logs Tab
Get direct access to your crash logs by selecting a particular crash (labeled with the iPhone application name and the date and time of the crash) from the scrolling list. The crash details, including a stack trace, thread information, exception types, and so forth, appear in the bottom pane.
In addition to crash logs that you generate yourself, you can also retrieve crash reports from users from their home computer and from iTunes Connect. The iPhone automatically syncs crash reports to computers when units back up to iTunes. These reports are stored in different locations depending on the platform used to sync the device:
• Mac OS X—~/Library/Logs/CrashReporter/MobileDevice/DeviceName
• Windows XP—C:Documents and SettingsUserNameApplication DataApple ComputerLogsCrashReporterMobileDeviceDeviceName
• Windows Vista—C:UsersUserNameAppDataRoamingApple ComputerLogsCrashReporterMobileDeviceDeviceName
iTunes Connect collects crash log data from your App Store users and makes it available to you. Download reports by selecting Manage Your Applications > App Details > View Crash Report for any application. There you find a list of the most frequent crash types and Download Report buttons for each type.
Copy reports into the Mac OS X crash reporter folder and they load directly into the Organizer. Make sure to load them into the device folder for the currently selected device. The reports appear in IPHONE DEVELOPMENT > Crash Logs.
Once in the Organizer, Xcode uses the application binary and .dSYM file to replace the hexadecimal addresses normally supplied by the report with function and method names. This process is called symbolication. You don’t have to manually locate these items; Xcode uses Spotlight and the application’s unique identifier (UUID) to locate the original binary and .dSYM files so long as they exist somewhere in your home folder.
As with crash logs in the Organizer, the reports from users provide a stack trace that you can load into Xcode to detect where errors occurred. The trace always appears in reverse chronological order, so the first items in the list were the last ones executed.
In addition to showing you where the application crashed, Crash Reports also tell you why they crashed. The most common cause is EXC_BAD_ACCESS, which can be generated by accessing unmapped memory (KERN_INVALID_ADDRESS) or trying to write to read-only memory (KERN_PROTECTION_FAILURE).
Other essential items in the crash report include the OS version of the crash and the version of the application that crashed. Users do not always update software to the latest release, so it’s important to distinguish which crashes arose from earlier, now potentially fixed, versions.
Note
See Apple Technical Note TN2151 for more details about iPhone OS Crash Reporting.
Screenshot Tab
Snap your tethered iPhone’s screen by clicking the Capture button on the Screenshot tab. The screenshot feature takes a picture of whatever is running on the iPhone, whether your applications are open or not. So you can access shots of Apple’s built-in software and any other applications running on the iPhone.
Once snapped, you can drag snapped images onto the desktop or save them as an open project’s new Default.png image. Archival shots appear in a library on the left side of the window. To delete a screenshot, select one and press the Delete key to permanently remove it.
Note
Screenshots are stored in your home Library/Application Support/Developer/Shared/Xcode/Screenshots folder.
Using Compiler Directives
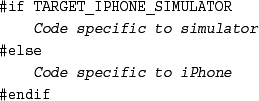
Xcode directives issue instructions to the compiler that can detect the platform and firmware you’re building for. This lets you customize your application to safely take advantage of platform- or firmware-only features. Adding #if statements to your code lets you block or reveal functionality based on these options. To detect if your code is compiled for the simulator or for the iPhone, for example, use target defines: TARGET_IPHONE_SIMULATOR and TARGET_OS_IPHONE.
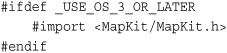
The simple “OS 3 or later” version check lets you build OS-specific blocks. For example, you might want to include code specific to the 3.0 MapKit within these blocks so a program would still compile and run on 2.2.x devices. This approach lets you create version-specific builds. Your program will not adapt on the go to changing device conditions; as with the platform directive, this is a compile-time only check.
Another approach involves checking the minimum OS version required to run the application. For this, you can use any of the OS presets. This ensures that 3.0 code applies strictly to apps compiled for 3.0 and later.

The values for the OS versions use the following basic naming pattern, which will presumably continue from 3.1 on. These definitions were pulled from a global set of iPhone defines. The next section shows you how to recover these for yourself.

Recovering iPhone-Specific Definitions
Although directive-specific definitions are not secret, they are not exactly well known. To check the current list of iPhone-specific defines, do the following. These steps dump a list from Xcode during compilation that you can use as a ready reference.
1. Open the Target Info window for the Hello World iPhone project from earlier in this chapter.
2. Add the following flags to the OTHER_CFLAGS in the Build tab:
-g3 -save-temps -dD.
3. Build your project. It will compile with errors. Ignore these.
4. Open a Terminal shell and navigate to your project folder. Inside, you find a new file: main.mi.
5. Issue the following command: grep -i iPhone main.mi | open -f. This searches through the main.mi for all iPhone references and adds them to a new TextEdit document. This list contains all the currently defined macro elements. Save the list somewhere convenient.
6. Remove the custom flags from your project and save. You should now be able to rebuild without error.
Note
Platform-specific limitations like onboard camera or microphone access should also be addressed by your code. Read more about coding around these potential roadblocks in Chapter 14, “Device Capabilities.”
Runtime Checks
Compiler directives allow you to build 2.x- and 3.x-specific versions of your applications. They do not, however, provide a way to run code that adapts to the current firmware.
To sell your application to the greatest number of customers, do not build for any SDK higher than your lowest desired customer. If your iPod customers are hesitant to pay for upgrades to newer firmware, you can still sell software that uses an older firmware specification so long as it has been thoroughly tested to run on newer firmware.
However, if you want to use more modern classes and calls, you either have to cut out older firmware customers entirely or you need to develop applications that provide those features while being compiled for earlier firmware. That means checking for compatibility at runtime rather than compile time.
You can accomplish this in a number of ways. First, you can check against the system running on the device, calling the firmware-appropriate methods. This sample does exactly that. It produces compile-time warnings for a 2.x build, letting you know that table cells may not respond to textLabel. This is not the preferred way of doing things. Apple recommends that you check for functionality and availability, not against specific firmware versions.
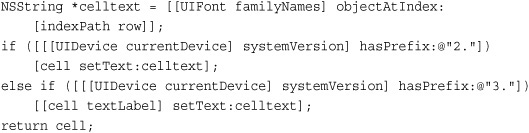
You can also test objects to see whether they respond to specific selectors. When 3.X versions of the frameworks are available, objects will report that they respond to those selectors, letting you call them without crashing the program. As with the previous approach, this too generates compile-time warnings about unimplemented selectors.
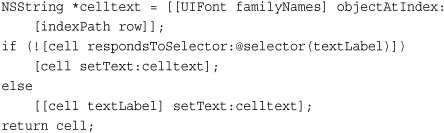
To avoid those compile-time warnings, you can add 3.x specific interface declarations to your 2.x source.

A better approach, however, is to set the Base SDK and Deployment targets for your project. In Target Info > Build Settings, set Base SDK to the highest version of the OS you want to target, namely some 3.x version. Set the iPhone OS Deployment Target to the lowest OS version you intend to build for.
You can also use a variety of other workarounds like pulling the label out indirectly. This code retrieves the label and sets its text.
UILabel *label = (UILabel *)[cell valueForKey:@"textLabel"];
if (label) [label setText:celltext];
You can access 3.x classes from a 2.x build by using NSClassFromString(). Test to see whether the class returns nil. If not, the class is available for your use in the current firmware. Link against any framework you might use, regardless of whether it is available for the 2.x build.
Class MFMCVC = NSClassFromString(@"MFMailComposeViewController");
If (MFMVC) myMFMCViewController = [[MFMCVC alloc] init];
And if you really want to go hard core, you can build NSInvocation instances directly, as discussed in Chapter 3.
Pragma Marks
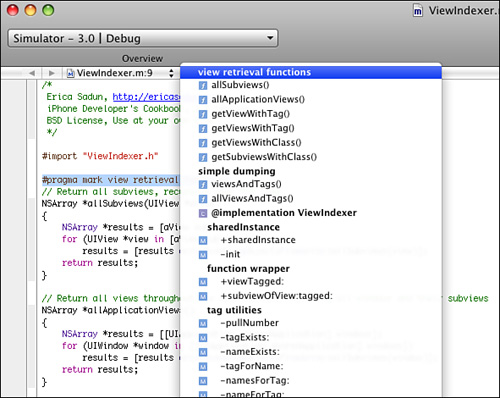
Pragma marks organize your source code by adding bookmarks into the method list pop-up button at the top of each Xcode window. This list shows all the methods and functions available in the current document. Adding pragma marks lets you group related items together, as shown in Figure 2-19. By clicking on these labels from the drop-down list, you can jump to a section of your file (for example, to tag utilities) as well as to a specific method (such as -tagExists:).
Figure 2-19 Use pragma marks to organize your method and function list.
To create a new bookmark, just add a simple pragma mark definition to your code. To replicate the first group in Figure 2-20, for example, add:
#pragma mark view retrieval functions
Figure 2-20 Xcode lets you collapse individual methods and functions. This allows you to see parts of your program that normally would not fit onscreen together.
You can also add a separation line with a special pragma mark call. Do not add any text after the hyphen or Xcode will add a normal bookmark, not a spacer.
#pragma mark -
The marks have no functionality and otherwise do not affect your code. They are simply organizational tools that you choose to use or not.
Collapsing Methods
When you need to see more than one part of your code at once, Xcode lets you close and open method groups. Place your mouse in the gutter directly to the left of any method. A pair of disclosure triangles appears. Click a triangle and Xcode collapses the code for that method, as shown in Figure 2-20. The ellipsis indicates the collapsed method. Click again on the disclosure triangle, and Xcode reveals the collapsed code.
Building for Distribution
Building for distribution means creating a version of your application that can be submitted to Apple for sale in the App Store. Before you even think about building, know how to clean up builds, how to create a distribution configuration, and how to find your built product. You want to compile for the App Store with precision. Cleaning first, then compiling with a preset distribution configuration helps ensure that your application uploads properly. Locating the built application lets you compress and submit the right file. The following sections cover these skills and others needed for distribution compiles.
Creating and Editing Configurations
In Xcode, configurations store build settings. They act as a quick reference to the way you want to have everything set up, so you can be ready to compile for your device or for the App Store just by selecting a configuration. Standard Xcode projects offer Debug and Release configurations. You may want to create a few others, such as ones for regular or ad hoc distribution.
Assuming you’ve been following along in this chapter, you have already set up the HelloWorld project and edited its debug build settings. It uses your development wild-card provision to sign the application. Instead of editing the build settings each time you want to switch the signing provision, you can create a new configuration instead.
In the Project window, select the HelloWorld group at the top of the Groups & Files column. Click the blue Info button to open the Project Info window. This window contains four tabs: General, Build, Configurations, and Comments. Open the Configurations tab.
Select the Debug configuration that you have already customized and click the Duplicate button in the bottom-left of the window. Xcode creates a copy and opens a text entry field for its name, as shown in Figure 2-21. Edit the name from Debug copy to Distribution. For real world development, you may want to edit and/or duplicate the Release configuration rather than the Debug one. This example uses Debug as it’s already customized.
Figure 2-21 Use the Project Info configuration window to create new configurations so you can build with preset options such as signing identities.

Next, click the Build tab and choose the new Distribution option from the Configuration pop-up. It’s important that you do so; otherwise, you’ll be editing whatever configuration was last used. Locate the Code Signing Identity and set Any iPhone OS Device to your wild-card distribution profile. When you have done so, close the Project Info window.
Following these steps adds a distribution configuration to your project, allowing you to select it when you’re ready to compile. Remember that you must create a separate configuration for each project. Configurations do not transfer from project to project and are stored as part of each project’s settings.
Clean Builds
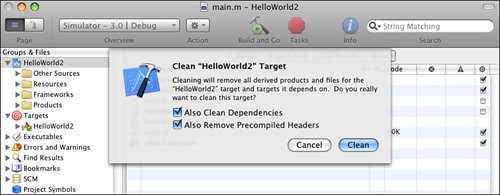
Clean builds ensure that every part of your project is recompiled from scratch. Doing a clean also ensures that your project build contains current versions of your project assets including images and sounds. You can force a clean build by deleting the build folder inside your project folder and you can use Xcode’s built-in utility. Choose Build > Clean (Command-Shift-K). As Figure 2-22 shows, Xcode prompts you to choose whether to clean dependencies and precompiled headers as well. As a general rule, there’s no harm in agreeing. Click Clean and wait as Xcode gets to work.
Figure 2-22 Xcode can thoroughly clean compiled artifacts from your project.
Apple recommends cleaning before compiling any application for App Store review, and it’s a good habit to get into. I combine methods. I dispose of the build folder and then clean out dependencies and precompiled headers. This produces a single product that is easily located and won’t be confused with other build versions.
Compiling for the App Store
To build your application in compliance with the App Store’s submission policies, it must be signed by a valid distribution provision profile using an active developer identity. If you’ve properly set up a developer configuration, most of this is taken care of for you. Here’s what’s left.
• Select Device as the active SDK. I can’t tell you how many people have attempted to submit simulator builds to App Store only to be frustrated for hours before discovering their error.
• Choose Distribution as the active configuration. You may want to open the Target Info window and confirm that your application identifier and code signing identity are set properly. Check that the Configuration at the top of the window is set to Active (Distribution) or Distribution. The Overview pop-up in the project window should say Device | Distribution.
• Compile your application using Build > Compile (Command-K). Your application should compile without errors. If not, reconsider your readiness to submit to the App Store.
• Locate the compiled product. In the Groups & Files column, find the Products group. Open it and right-click/Control-click your compiled application. It should appear in black and not in red. Choose Reveal in Finder from the contextual pop-up.
• Use the Finder window to confirm that your build is located in a folder ending with the name iphoneos. (Again, you cannot submit simulator builds to the App Store.)
• Right-click (Control-click) the application and compress it. You will submit the zip file to the App Store through iTunes Connect.
If your application is larger than 10MB, use Apple’s OS X application loader utility to submit your application to the App Store. This program is available for download through iTunes Connect on the Managing Your Applications page. Scroll to the very bottom and click Get Application Loader.
Debugging App Store Uploads
At times, it proves difficult to upload your application to the App Store. You log in to iTunes Connect. You set up your application details and get ready to upload your binary, but when you do, iTunes Connect rejects the binary. In a big pink message, the Web site tells you your upload has failed. Do you have a real signature problem? Are your certificates invalid? Sometimes you do have a signature problem and sometimes you don’t. Here are a few steps that can help. Some of these you’ve just read about in the previous section; others are new. Make sure you go down the entire list until you’ve resolved your problem.
Start by visiting the program portal and make sure that your developer certificate is up to date. It expires after a certain period of time (typically one year) and if you haven’t reissued a new one, you cannot submit software to App Store. If your certificate has expired, you need to request a new one and to build new provisioning profiles to match. For most people experiencing the “pink upload of doom,” though, their certificates are already valid and Xcode is properly configured.
Return to Xcode and check that you’ve set the active SDK to one of the device choices, like Device - 3.0. Accidentally leaving the build settings set to Simulator can be a big reason for the pink rejection. Next, make sure that you’ve chosen a build configuration that uses your distribution (not your developer) certificate. Check this by double-clicking on your target in the Groups & Files column on the left of the project window. The Target Info window opens. Click the Build tab and review your Code Signing Identity. It should be iPhone Distribution: followed by your name or company name.
The top-left of your project window also confirms your settings and configuration. It should read something like “Device | Distribution,” showing you the active SDK and the active configuration. If your settings are correct but you still aren’t getting that upload finished properly, clean your builds. Choose Build > Clean (Command-Shift-K) and click Clean. Alternatively, you can manually trash the build folder in your Project from Finder. Once you’ve cleaned, build again fresh.
Avoid spaces and special characters in the name of the zip archive you upload to iTunes Connect. You cannot rename your app file but you can freely rename the zip archive. Name issues can cause problems with some application uploads. So long as the data inside the zip archive includes the proper application, the name of the zip file really doesn’t matter.
If this does not produce an app that when zipped properly loads to iTunes Connect, do this: Quit and relaunch Xcode. This one simple trick solves more signing problems and “pink rejections of doom” than any other solution already mentioned. Quit, restart Xcode, clean your build, rebuild, zip, and submit. For most developers, this final step is all it takes to get past the invalid submission screen.
Assuming you are still having problems, download a copy of Apple’s OS X Application Loader from iTunes Connect on the Manage Your Application page. Instead of uploading directly, check the box that says Check Here to Upload Your Binary Later and use the loader to submit the archive.
If you’re still having trouble submitting to the App Store, consider compressing with a third-party archiver or try copying the application to the desktop before zipping it up. This sometimes solves the problem, creating an acceptable submission for an application that is otherwise properly signed. Some files rejected by the iTunes Connect Web site may be uploaded without error through the Application Loader.
Try launching Terminal and navigating to your compiled application. Run codesign -vvv YourApplication.app, substituting the actual application name to see whether any errors are reported about invalid signatures.
If you continue to have application submission problems even after walking through all these steps, contact Apple. Send an e-mail to iTunes Connect (they do not have a public phone) and explain your situation. Tell them that you’ve checked your certificates, that they are all valid, and mention the steps you’ve already tried. They may be able to help figure out why you’re still getting pink-rejected when you try to submit your apps. For everybody else, the checklist items you’ve already seen are probably enough to help you move past your submission issues and get your app on the way to review.
Note
When renewing your developer and distribution certificates, you must reissue all your mobile provisions. Throw away the old ones and create new ones with your updated developer identity. Make sure to remove the outdated certificates from your keychain when replacing them with the new ones.
Building for Ad Hoc Distribution
Apple allows you to distribute your applications outside the App Store via ad hoc distribution. With ad hoc, you can send your applications to up to 100 registered devices and run those applications using a special kind of mobile provision that allows the applications to execute under the iPhone’s FairPlay restrictions. Ad hoc distribution is especially useful for beta testing and for submitting review applications to news sites and magazines.
Register Devices
The ad hoc process starts with registering devices. Use the iPhone developer program portal to add device identifiers (Program Portal, Devices) and names to your account. Recover these identifiers from the iPhone directly (use the UIDevice calls from Chapter 9, “Building and Using Controls”), from Xcode’s Organizer (copy the identifier from the Summary tab), from iTunes (click on Serial Number in the iPhone’s Summary tab), from System Profiler (select USB, iPhone, Serial Number), or via Ad Hoc Helper from iTunes. Enter the identifier and a unique username.
Build the Ad Hoc Provision
If you have not done so already, build your Ad Hoc provision. To build a mobile provision, select Program Portal > Provisioning > Distribution. Click Add Profile. Select Ad Hoc, enter a profile name, your standard wildcard application identifier (for example, com.yourname.*), and select the device or devices to deploy on. Don’t forget to check your identity and then click Submit and wait for Apple to build the new mobile provision. Download the provision file and drop it onto the Xcode application icon. You will use it to build your application. You may want to restart Xcode after adding the provision.
Add an Entitlement File to Your Project
A special entitlement file is needed in ad hoc projects. (See Apple Technical Note TN2242.) In Xcode, choose File > New File > Code Signing > Entitlements. Click Next. Create a new entitlement called dist.plist. Click Finish. This creates a new file and adds it to your project. The name of the entitlement file is arbitrary.
Locate the new entitlements file. The file contains a single property that you must edit. Double-click to open it in an editor and uncheck get-task-allow (that is, set it to a Boolean value of FALSE). Save your changes and close the file.
Add the Entitlement to Your Settings
After setting up your entitlement, you need to add it to your target settings. With the Ad Hoc configuration selected, open the Target Info window. Make sure that the configuration pop-up in the Target Info window also says Ad Hoc. If it does not, select it.
In the Build tab, choose your Ad Hoc provision for your Code Signing Identity. Then, double-click Code Signing Entitlements. This pops up an interactive dialog. Click + and add the filename dist.plist to the Code Signing Entitlement (see Figure 2-23) and click OK. Alternatively, you can drag the entitlements file onto the Code Signing Entitlements field.
Figure 2-23 Add dist.plist as a new code signing entitlement for Ad Hoc distribution builds.

Build Your Ad Hoc Application
Now you’re ready to build your application. Make sure your Code Signing Identity is set to your ad hoc provision. Select Build > Build (Command-B). You can find the newly compiled product via the Products group in the project window. Right-click (Control-click) it and choose Reveal in Finder. A Finder window opens, showing the compiled item.
Distribute a copy of this application, which you just compiled with the mobile ad hoc provision, along with the provision itself that you downloaded from Apple. Your user can drop the provision and the application into iTunes before syncing your application to his or her iPhone. The application runs only on those phones you registered, providing a secure way to distribute these apps directly to your user.
Adding Artwork to Ad Hoc Distributions
Normally, iTunes does not display artwork for ad hoc programs. By default, it shows a stylized “A” instead. Fortunately, you can work around this. iPhone developer Malcolm Hall taught me how to set up ad hoc applications so they display the proper image.
Create a folder in Finder and populate it with two items. The first is a 512×512 JPEG image called iTunesArtwork. The second is a folder called Payload. Add the application bundle (do not compress it) into the Payload subfolder. Then zip up the entire folder and rename the zip file to Appname.ipa, where the name of the application matches the bundle you included in the Payload subfolder.
This IPA package (IPA stands for iPhone application) mimics the way that Apple provides applications for iTunes. When iTunes sees the iTunesArtwork file, it uses it to create the image seen in the Applications library.
Add the iTunesArtwork file without an explicit extension. If needed, remove any existing extension by renaming the file at the command line. Although the file needs to be in JPEG format, it should not use the standard .jpg or .jpeg naming.
Note
When distributing ad hoc builds to Windows Vista clients, instruct users to unzip the IPA first and then add the unzipped folder into iTunes. Vista apparently unzips the file incorrectly, resulting in application verification errors.
Customizing Xcode Identities
By definition, Xcode builds the following header into all your source code. Each of the items contained within the double chevrons is a variable and is set at the time the code gets created. Your user and organization names are retrieved from your Address Book, where they correspond to your personal contact information. The icon for this contact is marked with “me”—as shown in Figure 2-24.
Figure 2-24 In OS X’s address book, the contact used for personalizing Xcode files is marked with a “me” in the corner of the user’s icon.

You can override these settings with a pair of defaults that you assign at the command line. The following defaults command sets the organization and username to values different from those found in the address book. When used, these custom settings override the address book entry.
defaults write com.apple.Xcode PBXCustomTemplateMacroDefinitions
'{ORGANIZATIONNAME = "Apple, Inc." ; FULLUSERNAME = "Jonathan I.}'
You can also update the Organization Name in the Project Info > General settings on a project-by-project basis.
Unfortunately, the one string most iPhone developers want to override cannot be set by defaults. The com.yourcompany identifier that appears in new projects is hard coded into Xcode templates. If you want to change that identifier, you must edit Apple’s built-in templates or, better yet, create copies of those templates and edit them in your own user library.
Creating Custom Xcode Templates
When you create new projects in Xcode, the program lets you select a template. You can choose from iPhone and Mac OS X options that let you craft your application from any number of predesigned program skeletons. For the iPhone, these include view-based applications and applications built with OpenGL ES. On the Mac, you can build dynamic libraries, command-line utilities, and apps built with Cocoa, among many others.
Sometimes, though, you find yourself taking the same steps over and over to customize your projects to your own particular in-house design including updating that company identifier. Fortunately, Xcode lets you add user templates that you can precustomize so you can always start your new projects off where you really need to begin, not just where Apple left off. Jay Abbott of TinyPlay.com first showed me how to do this. His instructions involve making a copy of one of Apple’s templates, dragging it to a folder in your application support library, and customizing it.
Apple stores its project templates in Xcode’s /Developer directory. iPhone project templates are found in /Developer/Platforms/iPhoneOS.platform/Developer/Library/Xcode/Project Templates/Application. Each folder in that directory corresponds to a single template.
Overriding com.yourcompany
Replacing com.yourcompany is one of the simplest patches you can make. To start, copy the entire Application folder from the developer templates to your desktop. Search each folder for instances of com.yourcompany inside Info.plist files and edit them to match the actual identifier for your wild-card provisions. Make sure you look in subfolders in the templates to locate all Info.plist files. Use caution when editing and avoid changing any of the normal formatting information.
Once patched, locate the Library/Application Support/Developer/Shared/Xcode folder in your home directory. Create a Project Templates folder there and move the Application folder from the Desktop into that folder. When you next launch Xcode, it adds a new User Templates section and lists your version of the Application templates there, as shown in Figure 2-25.
Figure 2-25 Xcode lets you create new projects from custom User Templates. These templates are stored in your home library folder in a special Xcode directory.
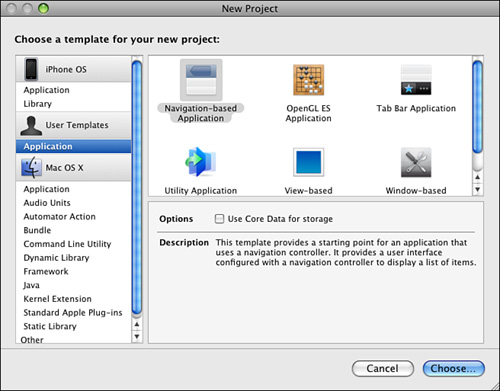
Selecting a template from User Templates rather than from iPhone OS loads your customized version, complete with the patched Info.plist. When you create new projects this way, you ensure that the application identifier has been preset to match your provisions.
Building Other Templates
There’s a lot more you can do with custom templates than just editing a single string. Think of user templates as a jumping off point for any project development you can think of. You can add custom images like your company logo or often-used classes. Any materials added to a template become available to Xcode to clone into new projects. If you find yourself repeating the same customization tasks again and again with Apple’s templates, a custom template will save you those steps. Custom templates can save you a lot of work. By carefully going through the project initialization process once, you can build on that well-executed start for all your projects.
Survey the existing templates. Copy whichever template best matches your goal onto your desktop. Adapt the folder by editing, trimming, and/or augmenting the files within. You need to update the project in Xcode to set it up. You might add Distribution and ad hoc configurations including your ad hoc entitlement file. Avoid setting provisioning profiles in the Target Info window, however. Once a template hard codes a signing identity, it becomes difficult to switch to other configurations. Perform however many edits you need.
Make sure that the template actually compiles and, if working with iPhone source, that it runs properly in the simulator. Save your work and then delete the build folder. Also delete the user-specific files in the xcodeproj subdirectory that contain your username. (You need to delete these files again should you ever reedit your project.)
Decide on a group name for your new template such as My Custom Templates. This name refers to the group that owns the template rather than the template itself. This corresponds to the Application group used for Apple’s templates. Drag your edited template into the new group folder. Rename the template folder meaningfully. The name of the folder corresponds to the name of the template shown in Xcode.
To finish, update the template description in the TemplateInfo.plist in the xcodeproj folder and, optionally, change the images in the TemplateIcons.icns file. Xcode ships with an icon editor that lets you paste art into ICNS files if you want. Otherwise, the icon defaults to the standard image used by the template you copied.
After following these steps, you’ll have created custom templates that you can use in Xcode to start new projects. You can share these templates with others by zipping up their folders. It’s probably best to zip starting at the template group level and then drop them into Project Templates folders.
One More Thing: Viewing Side-by-Side Code
When building new classes, it helps to open the header file and the method file right next to each other. Rather than flipping back and forth between two separate windows, Xcode offers a nifty trick that lets you edit both together. To accomplish this, start by opening the .m file in a standard editor.
Locate the top-right corner of the edit area, just under the Ungrouped and Project buttons. There, you see several icons in the corner. The corner is shaped like a lock and just underneath it is a bifurcated square. Hover your mouse over that square and confirm that the tool tip says Click to Split the Editor View.
Press the Option key and with the key pressed, click that square. The Option-click combination creates a vertical split rather than the default horizontal split normally introduced by the button. Once split, notice the new button that appears under the split button. It’s a merge button, and when you’re ready to do so, clicking it returns the window to a single unsplit display. For now, leave the display split.
Next, move your mouse up and to the left of the lock corner square. The tool tip for this button should read Go to Counterpart. This is used to switch between .h and .m views. Click it. (Alternatively, press Command-Option-Up Arrow.) After doing so, the screen updates, as shown in Figure 2-26, to display both the .m (at the left) and .h (at the right) versions of a class definition file in a single editor. This provides you with both items in a single window, making it simple to refer back and forth.
Figure 2-26 Xcode lets you edit header and method class sources in a single window.
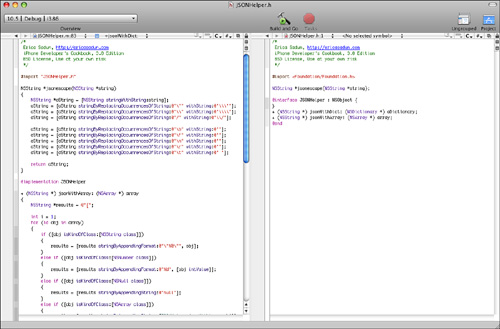
If you need to, you can resize the window and reapportion the two panes. The resize bar occurs just to the right of the scrollbar for the left-hand view. It’s hard to see at first, but when you move your mouse onto the right spot, the cursor updates to the double-arrowed resizer. Click and drag to perform the resize.
Note
Command-double-click on any class or method to automatically load the associated header file.
Summary
This chapter covered a lot of ground. From start to finish, you saw how to create, compile, and debug Xcode projects. You were introduced to most of the major Xcode components that you’ll use on a day-to-day basis, and you read about many of the different ways you can produce and run iPhone projects. Here are some thoughts to take away from this chapter.
• Although Xcode provides easy-to-use templates, think of them as a jumping off point not an endpoint. You can customize and edit projects however you want, and, as you read in this chapter, you can turn those edited projects into new templates.
• Interface Builder makes it really easy to lay out views. Although technically, you’re producing the same method calls and property assignments as if you’d designed by hand, IB’s elegant GUI transforms those design tasks into the visual domain, which is a welcome place for many developers.
• Learning to navigate through Xcode’s in-program reference documentation is an essential part of becoming an iPhone developer. No one can keep all that information in his or her head. The more you master the documentation interface, the better you’ll be at finding the class, method, or property you need to move forward.
• Everything changes. Subscribe to iPhone OS documentation in Xcode and ensure that your documentation remains as up-to-date as possible.
• Xcode’s built-in debugger and Instruments tools help you fix bugs faster than trying to figure out everything by hand. The tools may seem complex at first but are well worth mastering for day-to-day development.
• Get to know and love the Organizer pane. It gives you critical feedback for knowing which devices are connected and what state they are in. And the other tools, including the screenshot utility and the console, just add to its power.
• Configurations help prevent repetitive work. Once set, a configuration lets you choose how to compile and sign your application with a minimum of further effort.